
This article is based on publicly available IR materials and is not a recommendation to buy or sell any specific securities.
Note: Kanematsu Corporation labels the fiscal year ended March 31, 2026 as “FY2026” in its own materials, while this site classifies the most recently completed full year as FY2025; the text, tables and segment figures below keep the company’s own fiscal-year labels exactly as presented in the source presentation.
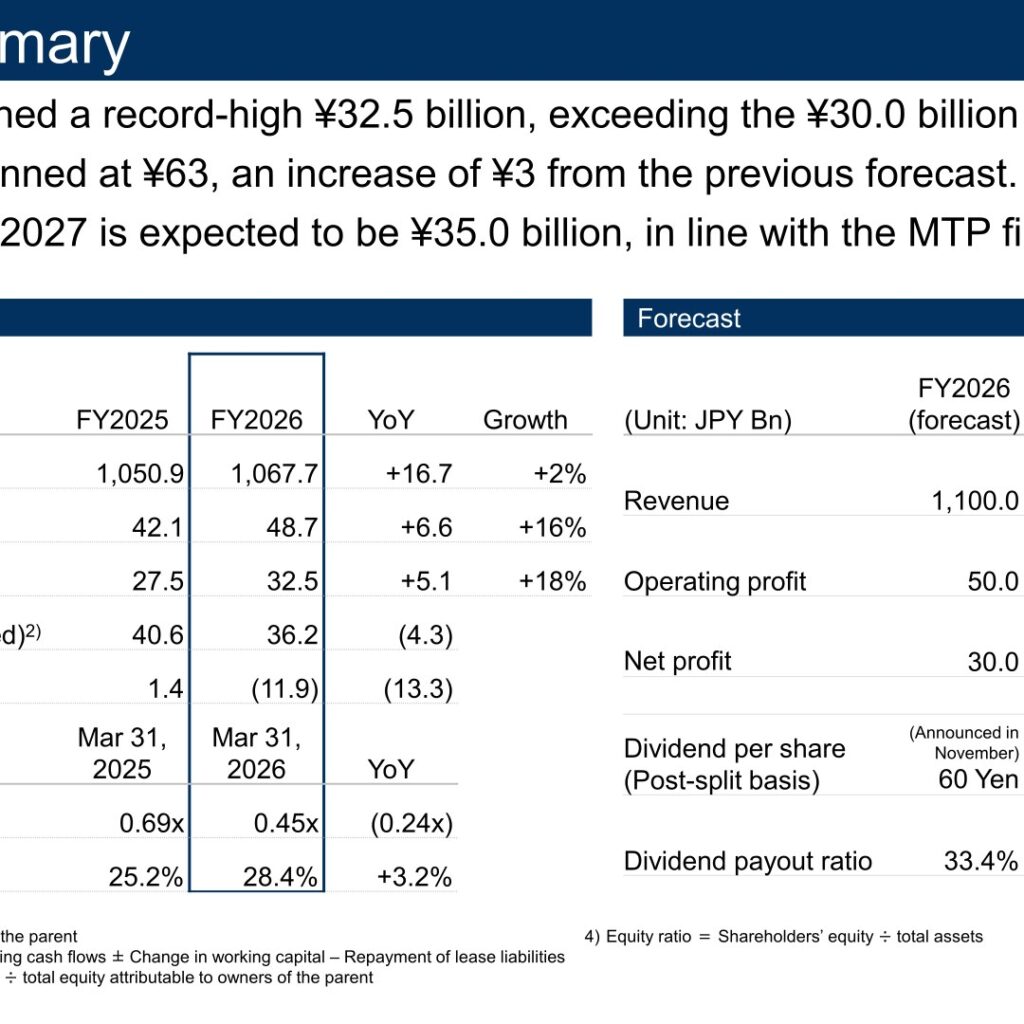
Kanematsu Corporation reported revenue of ¥1,067.7 billion for FY2026 (the fiscal year ended March 31, 2026), up ¥16.7 billion or 2% year on year, and operating profit of ¥48.7 billion, up ¥6.6 billion or 16%. Profit attributable to owners of the parent reached a record high of ¥32.5 billion, an increase of ¥5.1 billion or 18%, exceeding the company’s own forecast of ¥30.0 billion. The annual dividend per share was set at ¥63 on a post-stock-split basis, ¥3 above the previous forecast of ¥60 announced in November 2025. For FY2027 the company forecasts net profit of ¥35.0 billion, in line with the final-year target of its medium-term management plan “integration 1.1”.
Consolidated Results (Full-Year Actual)
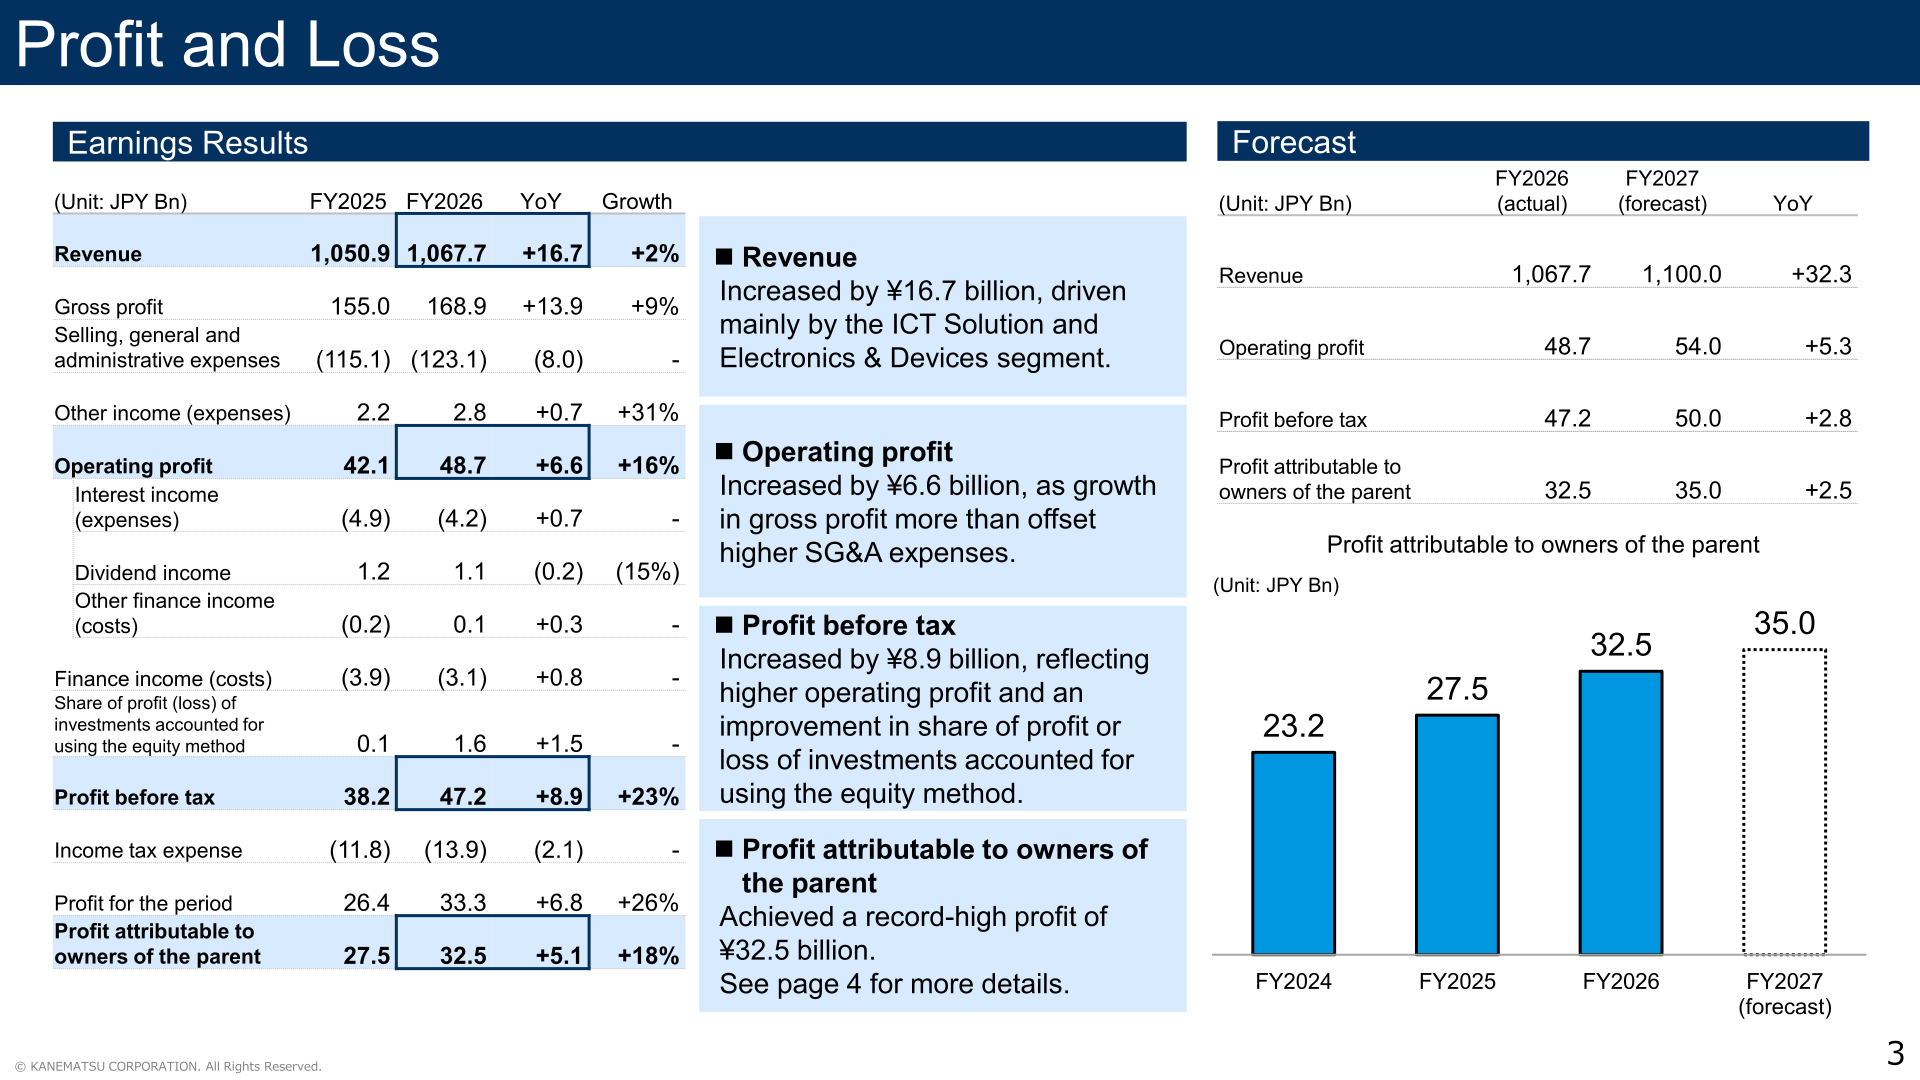
Revenue increased by ¥16.7 billion, driven mainly by the ICT Solution and Electronics & Devices segments. Operating profit increased by ¥6.6 billion, as growth in gross profit more than offset higher SG&A expenses. Profit before tax increased by ¥8.9 billion, reflecting higher operating profit and an improvement in share of profit or loss of investments accounted for using the equity method. Profit attributable to owners of the parent came to a record-high ¥32.5 billion. Figures in the presentation are rounded to the nearest 0.1 billion yen, so totals may not precisely match the sum of individual items.
| Item (Unit: JPY Bn) | FY2025 | FY2026 | YoY | Growth |
|---|---|---|---|---|
| Revenue | 1,050.9 | 1,067.7 | +16.7 | +2% |
| Gross profit | 155.0 | 168.9 | +13.9 | +9% |
| Selling, general and administrative expenses | (115.1) | (123.1) | (8.0) | – |
| Other income (expenses) | 2.2 | 2.8 | +0.7 | +31% |
| Operating profit | 42.1 | 48.7 | +6.6 | +16% |
| Finance income (costs) | (3.9) | (3.1) | +0.8 | – |
| Share of profit (loss) of investments accounted for using the equity method | 0.1 | 1.6 | +1.5 | – |
| Profit before tax | 38.2 | 47.2 | +8.9 | +23% |
| Income tax expense | (11.8) | (13.9) | (2.1) | – |
| Profit for the period | 26.4 | 33.3 | +6.8 | +26% |
| Profit attributable to owners of the parent | 27.5 | 32.5 | +5.1 | +18% |
On the balance sheet, total assets rose ¥43.7 billion to ¥733.0 billion, mainly due to the increase in trade receivables reflecting yen depreciation as well as an increase in other current assets. Net interest-bearing debt fell ¥25.7 billion to ¥94.6 billion on repayments of borrowings resulting from a reduction in working capital, while shareholders’ equity rose ¥34.4 billion to ¥208.4 billion on the accumulation of profit attributable to owners of the parent. The equity ratio reached 28.4% (from 25.2%) and the net D/E ratio improved to 0.45x (from 0.69x); PBR was 1.76x versus 1.20x a year earlier. Cash flows from operating activities were an inflow of ¥57.7 billion, cash flows from investing activities an outflow of ¥11.9 billion, and cash flows from financing activities an outflow of ¥46.9 billion, leaving free cash flow of ¥45.7 billion. ROE was 17.0% and ROIC 9.1%.
Segment Results
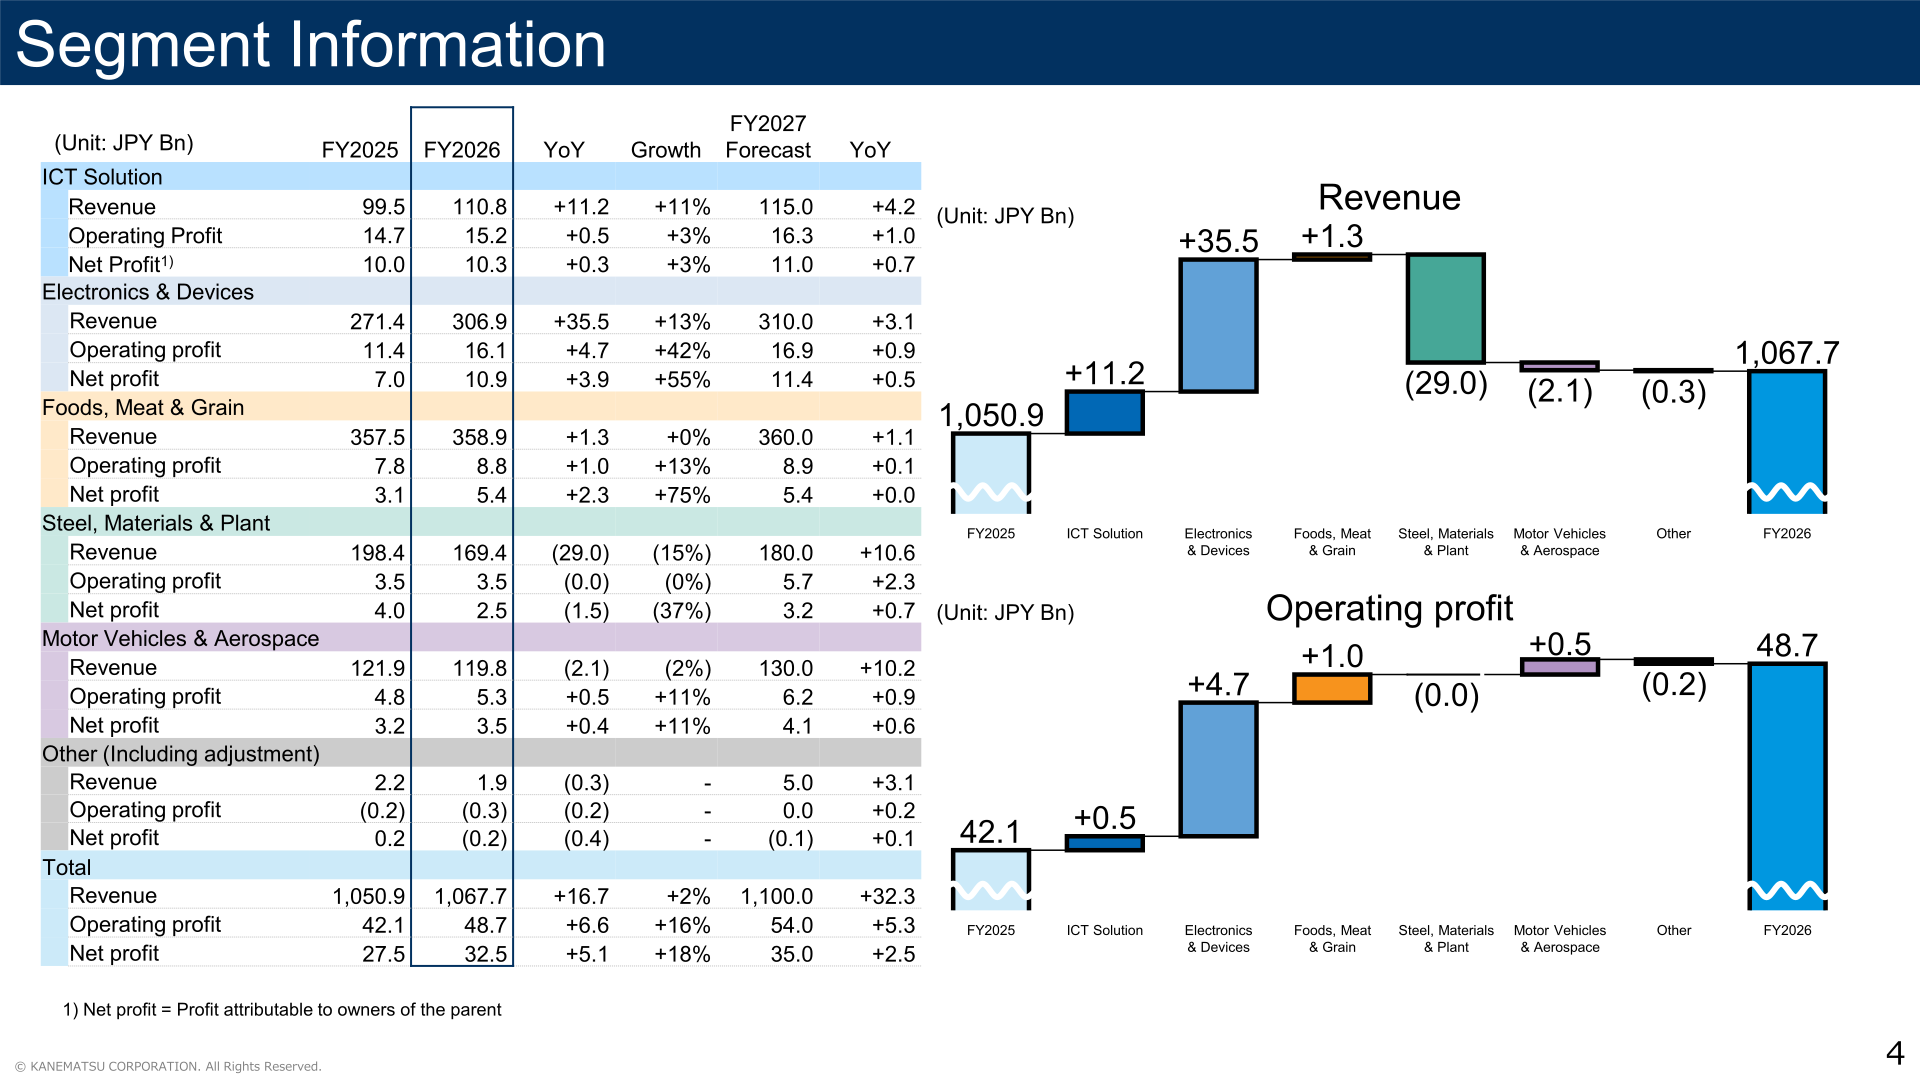
ICT Solution net profit increased by ¥0.3 billion, with strong sales of storage systems and servers to manufacturers in the defense and semiconductor industries, robust network demand in the distribution sector, and increased demand for services and security solutions. Electronics & Devices net profit increased by ¥3.9 billion: in Electronic Devices & Materials, profit increased due to the effects of M&A and the absence of goodwill impairment losses recorded in the previous fiscal year, while in Mobile, expanded sales channels and growth in the corporate-client business lifted profit. Foods, Meat & Grain net profit increased by ¥2.3 billion on strong beverage ingredients, well-performing chicken trading amid a demand shift from beef and pork to chicken, and strong imported rice and soybeans. Steel, Materials & Plant net profit decreased by ¥1.5 billion, as gains associated with the divestment of a domestic steel subsidiary and the absence of goodwill impairment losses were outweighed by valuation losses and other items related to futures transactions in Energy amid a surge in crude oil prices and by fewer ODA projects in Plant. Motor Vehicles & Aerospace net profit increased by ¥0.4 billion, helped by higher demand toward the end of the fiscal year in Machine Tools & Industrial Machinery, mainly in defense- and semiconductor-related fields.
| Segment | Metric (Unit: JPY Bn) | FY2025 | FY2026 | YoY | Growth |
|---|---|---|---|---|---|
| ICT Solution | Revenue | 99.5 | 110.8 | +11.2 | +11% |
| ICT Solution | Operating profit | 14.7 | 15.2 | +0.5 | +3% |
| ICT Solution | Net profit | 10.0 | 10.3 | +0.3 | +3% |
| Electronics & Devices | Revenue | 271.4 | 306.9 | +35.5 | +13% |
| Electronics & Devices | Operating profit | 11.4 | 16.1 | +4.7 | +42% |
| Electronics & Devices | Net profit | 7.0 | 10.9 | +3.9 | +55% |
| Foods, Meat & Grain | Revenue | 357.5 | 358.9 | +1.3 | +0% |
| Foods, Meat & Grain | Operating profit | 7.8 | 8.8 | +1.0 | +13% |
| Foods, Meat & Grain | Net profit | 3.1 | 5.4 | +2.3 | +75% |
| Steel, Materials & Plant | Revenue | 198.4 | 169.4 | (29.0) | (15%) |
| Steel, Materials & Plant | Operating profit | 3.5 | 3.5 | (0.0) | (0%) |
| Steel, Materials & Plant | Net profit | 4.0 | 2.5 | (1.5) | (37%) |
| Motor Vehicles & Aerospace | Revenue | 121.9 | 119.8 | (2.1) | (2%) |
| Motor Vehicles & Aerospace | Operating profit | 4.8 | 5.3 | +0.5 | +11% |
| Motor Vehicles & Aerospace | Net profit | 3.2 | 3.5 | +0.4 | +11% |
| Other (Including adjustment) | Revenue | 2.2 | 1.9 | (0.3) | – |
| Other (Including adjustment) | Operating profit | (0.2) | (0.3) | (0.2) | – |
| Other (Including adjustment) | Net profit | 0.2 | (0.2) | (0.4) | – |
| Total | Revenue | 1,050.9 | 1,067.7 | +16.7 | +2% |
| Total | Operating profit | 42.1 | 48.7 | +6.6 | +16% |
| Total | Net profit | 27.5 | 32.5 | +5.1 | +18% |
Note: in the presentation, “Net profit” is defined as profit attributable to owners of the parent. Segment ROIC for the total company improved to 9.1% in FY2026 from 7.6% in FY2025, with Electronics & Devices at 12.6% (up 4.1 points) and Foods, Meat & Grain at 6.1% (up 2.6 points).
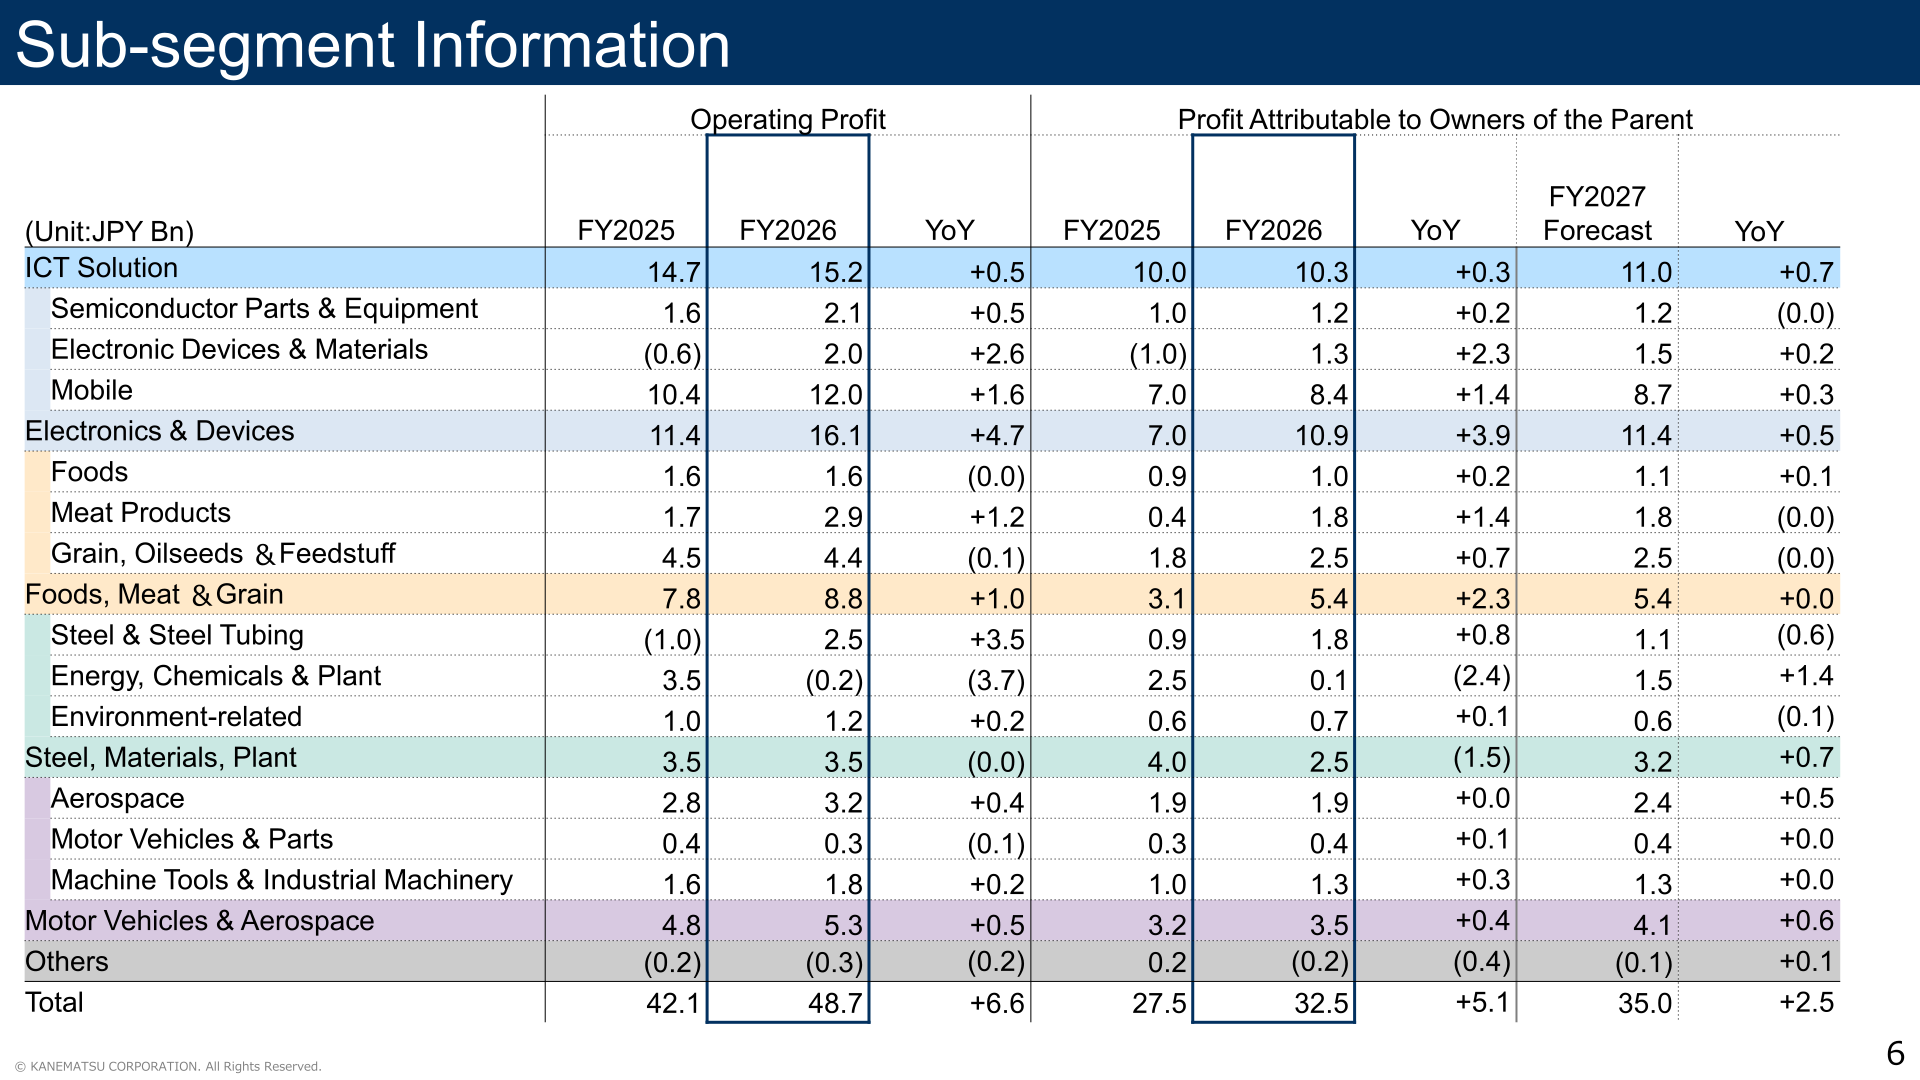
On a sub-segment basis, the largest year-on-year net profit swings were Electronic Devices & Materials (from ¥(1.0) billion to ¥1.3 billion, up ¥2.3 billion), Mobile (from ¥7.0 billion to ¥8.4 billion, up ¥1.4 billion), Meat Products (from ¥0.4 billion to ¥1.8 billion, up ¥1.4 billion) and Energy, Chemicals & Plant (from ¥2.5 billion to ¥0.1 billion, down ¥2.4 billion). Steel & Steel Tubing operating profit swung from ¥(1.0) billion to ¥2.5 billion.
FY2027 Forecast
For FY2027 (the fiscal year ending March 31, 2027) Kanematsu forecasts revenue of ¥1,100.0 billion, operating profit of ¥54.0 billion, profit before tax of ¥50.0 billion and profit attributable to owners of the parent of ¥35.0 billion, which matches the final-year target of the medium-term management plan. By segment, the company forecasts net profit of ¥11.0 billion for ICT Solution, ¥11.4 billion for Electronics & Devices, ¥5.4 billion for Foods, Meat & Grain, ¥3.2 billion for Steel, Materials & Plant and ¥4.1 billion for Motor Vehicles & Aerospace.
| Item (Unit: JPY Bn) | FY2026 (actual) | FY2027 (forecast) | YoY |
|---|---|---|---|
| Revenue | 1,067.7 | 1,100.0 | +32.3 |
| Operating profit | 48.7 | 54.0 | +5.3 |
| Profit before tax | 47.2 | 50.0 | +2.8 |
| Profit attributable to owners of the parent | 32.5 | 35.0 | +2.5 |
| Dividend per share (post-split basis) | 63 Yen | 70 Yen | +7 Yen |
| Dividend payout ratio | 32.2% | 33.3% | – |
Shareholder Returns
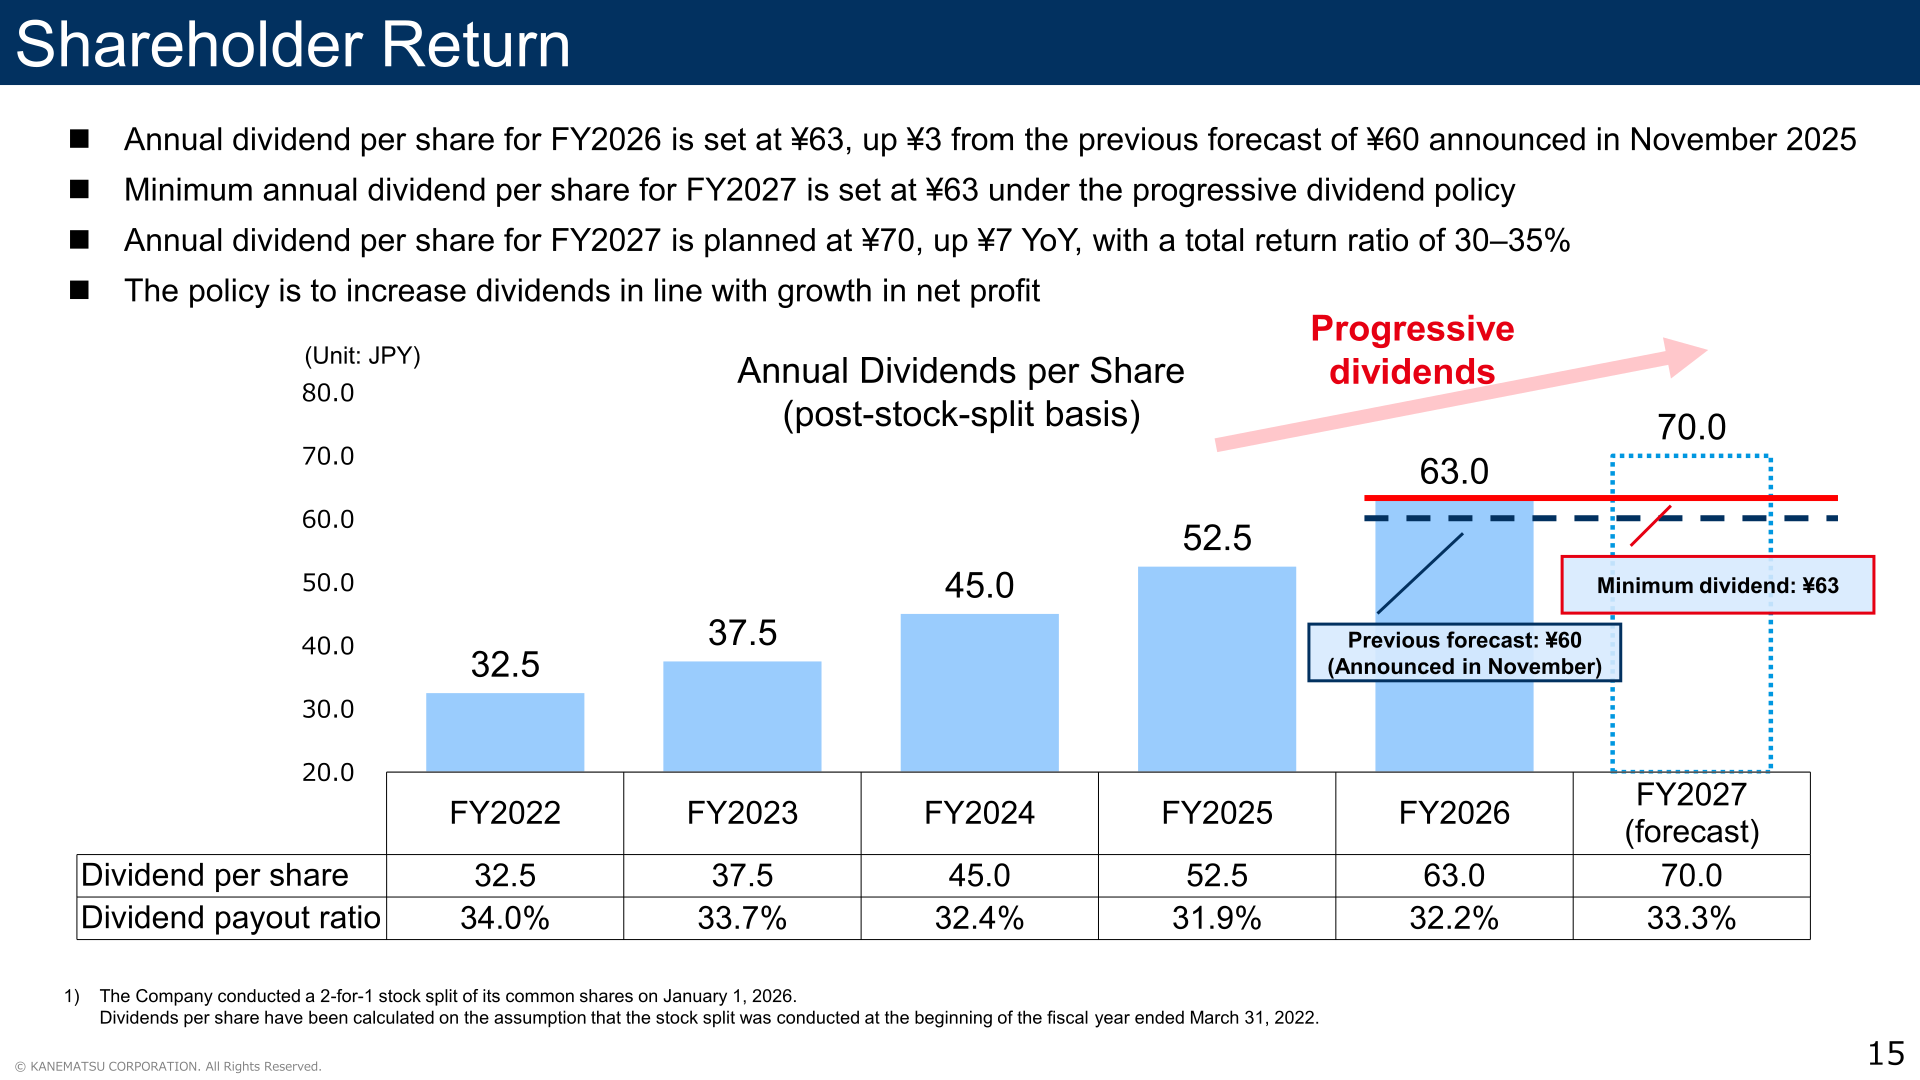
The annual dividend per share for FY2026 is set at ¥63, up ¥3 from the previous forecast of ¥60 announced in November 2025, for a payout ratio of 32.2%. Under the company’s progressive dividend policy, the minimum annual dividend per share for FY2027 is set at ¥63, and the planned annual dividend for FY2027 is ¥70, up ¥7 year on year, with a total return ratio of 30–35%. The stated policy is to increase dividends in line with growth in net profit. Kanematsu conducted a 2-for-1 stock split of its common shares on January 1, 2026, and dividends per share are presented on a post-stock-split basis, calculated on the assumption that the stock split was conducted at the beginning of the fiscal year ended March 31, 2022.
| Fiscal year | Dividend per share (Yen, post-split basis) | Dividend payout ratio |
|---|---|---|
| FY2022 | 32.5 | 34.0% |
| FY2023 | 37.5 | 33.7% |
| FY2024 | 45.0 | 32.4% |
| FY2025 | 52.5 | 31.9% |
| FY2026 | 63.0 | 32.2% |
| FY2027 (forecast) | 70.0 | 33.3% |
Medium-Term Management Plan and Topics
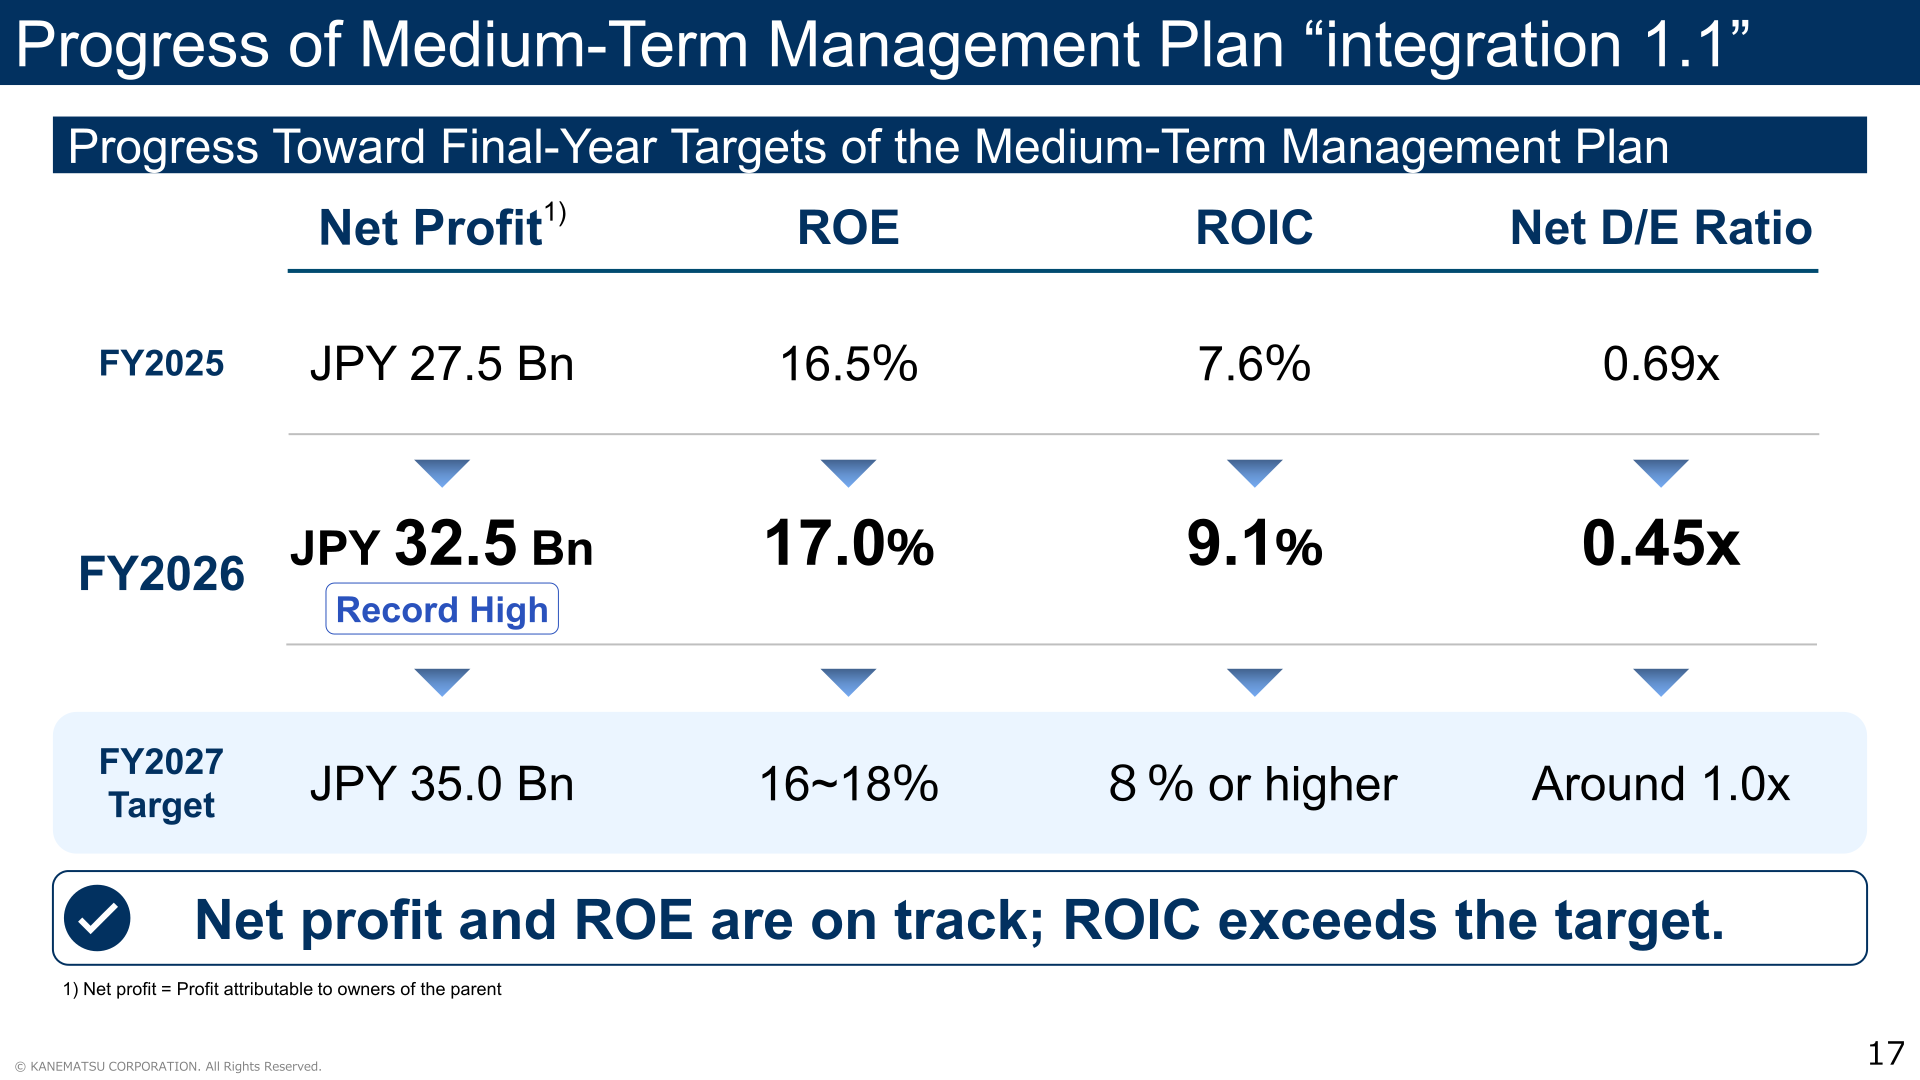
Against the final-year targets of the medium-term management plan “integration 1.1” — net profit of ¥35.0 billion, ROE of 16–18%, ROIC of 8% or higher and a net D/E ratio of around 1.0x — FY2026 delivered net profit of ¥32.5 billion, ROE of 17.0%, ROIC of 9.1% and a net D/E ratio of 0.45x. The presentation states that net profit and ROE are on track and that ROIC exceeds the target.
On growth investment, the plan sets a cumulative target of ¥60.0 billion for FY2025–FY2027, initially split into approximately ¥40.0 billion for DX-related areas centered on ICT solutions and approximately ¥20.0 billion for core strength areas. As of March 31, 2026, cumulative investments executed totaled approximately ¥23.0 billion, comprising ¥2.0 billion in DX-related areas and ¥21.0 billion in core strength areas, the latter exceeding the initial assumption. Excluding minority investments, the two-year cumulative investment of ¥23.0 billion generated an investment return of ¥1.8 billion in net profit, an ROI of approximately 9%. Major FY2026 investments included ELECTRONICS AND MATERIALS CORPORATION LIMITED (silicon and compound semiconductor wafers), Root Riff Systems, Inc. (IT network and infrastructure consulting, design and construction), KOEI SANGYO CO., LTD. (industrial machinery) and FRIGORÍFICO SAN JACINTO – Nirea S.A. (Uruguayan beef).
In the ICT Solution business, Kanematsu Electronics (KEL) recorded cumulative orders received of ¥120.5 billion in FY2026, up 20% year on year, and an order backlog of ¥34.0 billion, up 30%. KEL revenue was ¥112.8 billion, up 11%, with Manufacturing at ¥49.2 billion (up 11%) and Services at ¥35.9 billion (up 16%). In the Mobile business, net profit was ¥8.4 billion, up 20% year on year, with ROIC of 23.3% and services and offerings accounting for approximately 11% of gross profit. The presentation also highlights the defense business, citing an MT30 engine order for Australia’s next-generation frigates with delivery scheduled from 2026 to 2029, and an order for a next-generation primary trainer and ground-based training equipment with delivery scheduled from 2029 onward.
Among major consolidated subsidiaries, combined revenue rose to ¥588.9 billion from ¥551.1 billion and combined operating profit rose to ¥40.8 billion from ¥33.1 billion, an increase of ¥7.7 billion or 23%. Kanematsu Communications posted revenue of ¥214.2 billion and operating profit of ¥12.0 billion, Kanematsu Electronics ¥112.7 billion and ¥15.2 billion, and Kanematsu USA swung to operating profit of ¥2.9 billion from ¥(1.0) billion.
This article is an analysis based on publicly available information and is not a recommendation to buy or sell any specific securities. Investment decisions are your own responsibility.
![[Obayashi] Investors’ Guide 2026 — The Complete 24-Article Breakdown](https://japan-equity.com/wp-content/uploads/2026/07/hub_cover-1024x1024.png)
![[Obayashi] IR & SR Policy — Feeding Dialogue Back into Management](https://japan-equity.com/wp-content/uploads/2026/07/p32_sq-1024x1024.jpg)
![[Obayashi] Domestic Civil Engineering — Resilience Spending Supports 9.6% Margin](https://japan-equity.com/wp-content/uploads/2026/07/p11_sq-1024x1024.jpg)
![[Obayashi] Overseas Construction — Orders Reach ¥1.2tn](https://japan-equity.com/wp-content/uploads/2026/07/p15_sq-1024x1024.jpg)
![[Obayashi] Share Price & External Ratings — vs TOPIX, ESG Index Inclusion](https://japan-equity.com/wp-content/uploads/2026/07/p40_sq-1024x1024.jpg)
![[Construction] ¥75.5tn Investment, Shrinking Workforce — Big-5 Market Share](https://japan-equity.com/wp-content/uploads/2026/07/p12_sq-1024x1024.jpg)



![[Obayashi] Capital Policy & Shareholder Returns — ROE 10%+, DOE ~5%, ¥100bn Buyback](https://japan-equity.com/wp-content/uploads/2026/07/p27_sq-1024x1024.jpg)
![[Obayashi] Reducing Cross-Shareholdings — ¥285.2bn Sold in Five Years](https://japan-equity.com/wp-content/uploads/2026/07/p29_sq-1024x1024.jpg)
![[Obayashi] ¥750bn Investment Plan — ¥300bn to Development, ¥190bn to Tech/DX](https://japan-equity.com/wp-content/uploads/2026/07/p30_sq-1024x1024.jpg)
![[Obayashi] MTP2022 KPIs — Operating Profit ~2x Target, ROE 14.4%](https://japan-equity.com/wp-content/uploads/2026/07/p25_sq-1024x1024.jpg)
![[Obayashi] Cash Allocation — ¥420bn Investment CF Over Five Years](https://japan-equity.com/wp-content/uploads/2026/07/p26_sq-1024x1024.jpg)
![[Obayashi] Green Energy — 44 Plants, 344MW, and the Green Hydrogen Challenge](https://japan-equity.com/wp-content/uploads/2026/07/p21_sq-1024x1024.jpg)
![[Obayashi] Tackling the Labor Shortage — Robotics Construction®](https://japan-equity.com/wp-content/uploads/2026/07/p14_sq-1024x1024.jpg)
