
This article is based on publicly available IR materials and is not a recommendation to buy or sell any specific securities.
Note: SANYO SHOKAI’s fiscal year ends in February. The results discussed below are for the fiscal year ended February 28, 2026, which the company’s own presentation labels “Fiscal 2026” (FY2026); this site refers to the most recently completed fiscal year across companies as “FY2025” for consistency, but the figures, tables and segment labels in this article retain the company’s original FY2026/FY2027 wording exactly as reported.
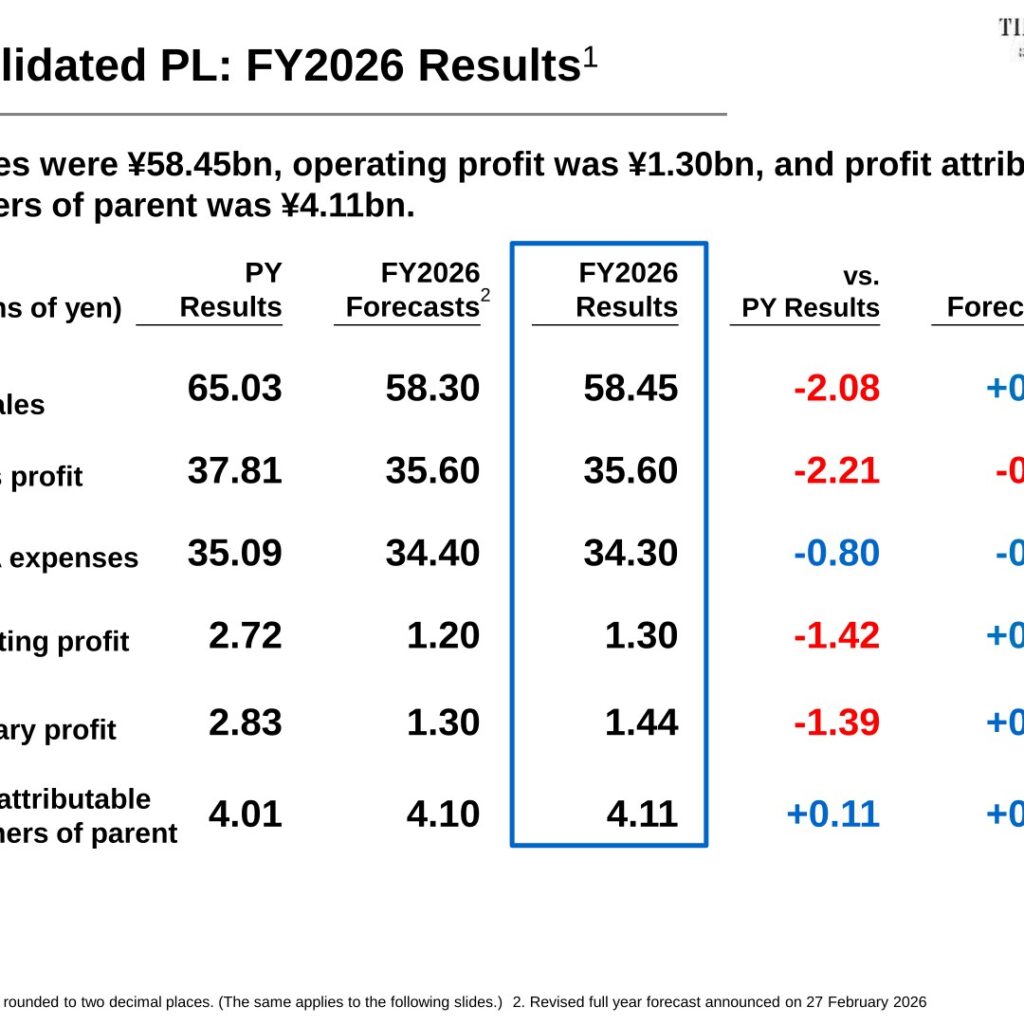
SANYO SHOKAI LTD., whose brands include MACKINTOSH LONDON, BLUE LABEL/BLACK LABEL CRESTBRIDGE and BAKER STREET, reported consolidated net sales of ¥58.45bn for Fiscal 2026 (fiscal year ended February 28, 2026), down from ¥60.53bn a year earlier, as department store sales were affected by irregular weather, weaker consumer sentiment and softer inbound demand. Operating profit fell to ¥1.30bn from ¥2.72bn and ordinary profit fell to ¥1.44bn from ¥2.83bn, but profit attributable to owners of parent rose to ¥4.11bn from ¥4.01bn. For Fiscal 2027 (year ending February 28, 2027), the company forecasts net sales of ¥60.00bn and, using a newly introduced “core operating profit” metric that excludes the impact of a planned partial sale of head office land and the rebuilding of the head office building, core operating profit of ¥2.30bn.
Consolidated Results (Fiscal 2026 Actual)
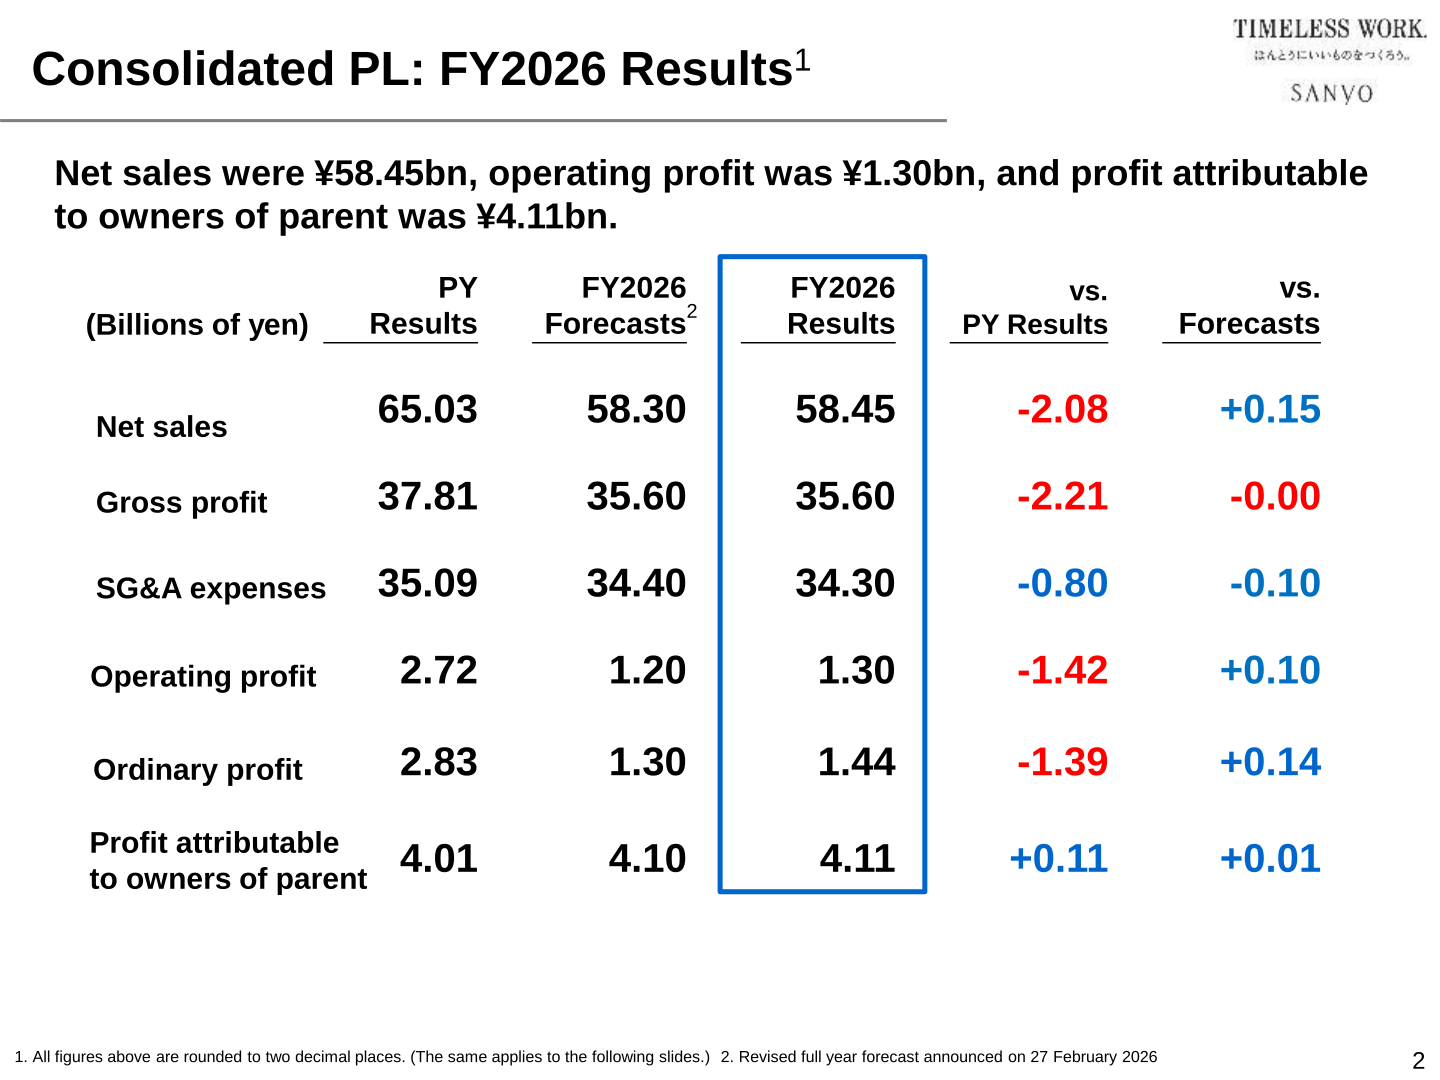
Net sales declined 3% year on year and came in ¥0.15bn ahead of the company’s revised full-year forecast announced on 27 February 2026. Gross profit margin fell 1.6 points year on year to 60.9%, 0.2 points below the revised forecast, while the SG&A expense ratio improved 0.3 points versus the forecast to 58.7%. Operating margin of 2.2% was in line with the revised forecast but 2.3 points lower than the prior year; ROE rose 0.3 points year on year to 10.3%.
| Item (Billions of Yen) | PY Results | FY2026 Forecasts | FY2026 Results | vs. PY Results | vs. Forecasts |
|---|---|---|---|---|---|
| Net sales | 60.53 | 58.30 | 58.45 | -2.08 | +0.15 |
| Gross profit | 37.81 | 35.60 | 35.60 | -2.21 | -0.00 |
| SG&A expenses | 35.09 | 34.40 | 34.30 | -0.80 | -0.10 |
| Operating profit | 2.72 | 1.20 | 1.30 | -1.42 | +0.10 |
| Ordinary profit | 2.83 | 1.30 | 1.44 | -1.39 | +0.14 |
| Profit attributable to owners of parent | 4.01 | 4.10 | 4.11 | +0.11 | +0.01 |
Note on a source discrepancy: the presentation’s summary P&L slide (P.2) prints prior-year (PY) net sales as ¥65.03bn. This is inconsistent with the ¥60.53bn shown for the same prior-year period elsewhere in the same presentation (P.16, “Net Sales Plan”), and with the year-on-year change of -¥2.08bn and the 62.5% prior-year gross margin printed on the very same slide, both of which are only consistent with a prior-year net sales figure of ¥60.53bn. This article therefore uses ¥60.53bn as prior-year net sales throughout.
| Metric | PY Results | FY2026 Forecasts | FY2026 Results | vs. PY Results | vs. Forecasts |
|---|---|---|---|---|---|
| Gross profit margin | 62.5% | 61.1% | 60.9% | -1.6pt | -0.2pt |
| SG&A expense ratio | 58.0% | 59.0% | 58.7% | +0.7pt | -0.3pt |
| Operating margin | 4.5% | 2.1% | 2.2% | -2.3pt | +0.2pt |
| Ordinary profit margin | 4.7% | 2.2% | 2.5% | -2.2pt | +0.2pt |
| Net profit margin | 6.6% | 7.0% | 7.0% | +0.4pt | 0pt |
| ROE | 10.0% | 10.2% | 10.3% | +0.3pt | +0.1pt |
SG&A expenses decreased ¥0.80bn year on year to ¥34.30bn, but on a like-for-like basis excluding a ¥0.90bn decline in sales-linked commissions, expenses rose ¥0.10bn as the company continued to control fixed costs.
Channel Sales Results
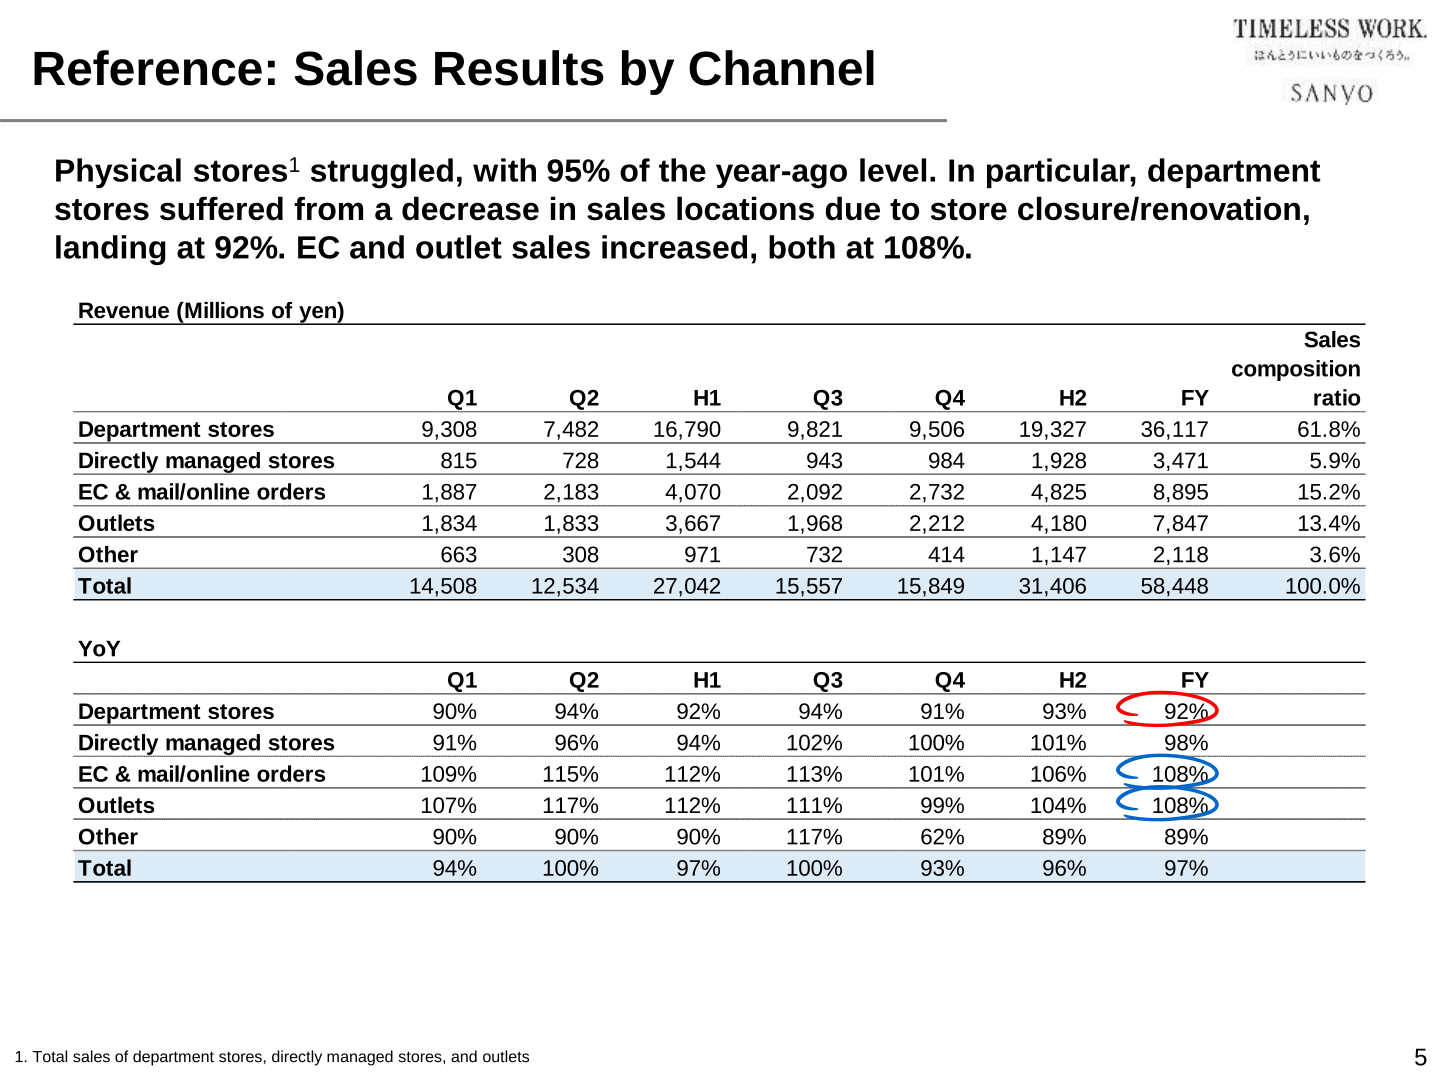
By sales channel, net sales at department stores — 61.8% of total sales — fell to ¥36,117 million (92% of the prior-year level), as some department stores closed or renovated sales floors. EC & mail/online orders grew 8% year on year to ¥8,895 million and outlet sales also grew 8% to ¥7,847 million, while directly managed stores were roughly flat at ¥3,471 million (98%). Physical stores (department stores, directly managed stores and outlets combined) reached 95% of the prior-year level.
| Channel | FY2026 Net Sales (¥mn) | Sales Composition Ratio | FY2026 YoY |
|---|---|---|---|
| Department stores | 36,117 | 61.8% | 92% |
| Directly managed stores | 3,471 | 5.9% | 98% |
| EC & mail/online orders | 8,895 | 15.2% | 108% |
| Outlets | 7,847 | 13.4% | 108% |
| Other | 2,118 | 3.6% | 89% |
| Total | 58,448 | 100.0% | 97% |
By brand, combined sales of BLUE LABEL CRESTBRIDGE and BLACK LABEL CRESTBRIDGE decreased ¥0.82bn, BAKER STREET sales decreased ¥0.8bn due to a lack of recognition following its brand transition, and women’s clothing (excluding AMACA) decreased ¥0.49bn. By channel, department store sales decreased ¥2.99bn (92% year on year), reflecting closures and reduced sales floor space at railway-affiliated department stores and a decrease of 17 stores year on year (excluding the effect of existing stores converted into combined shops), while other channels increased ¥0.91bn.
Fiscal 2027 Forecast
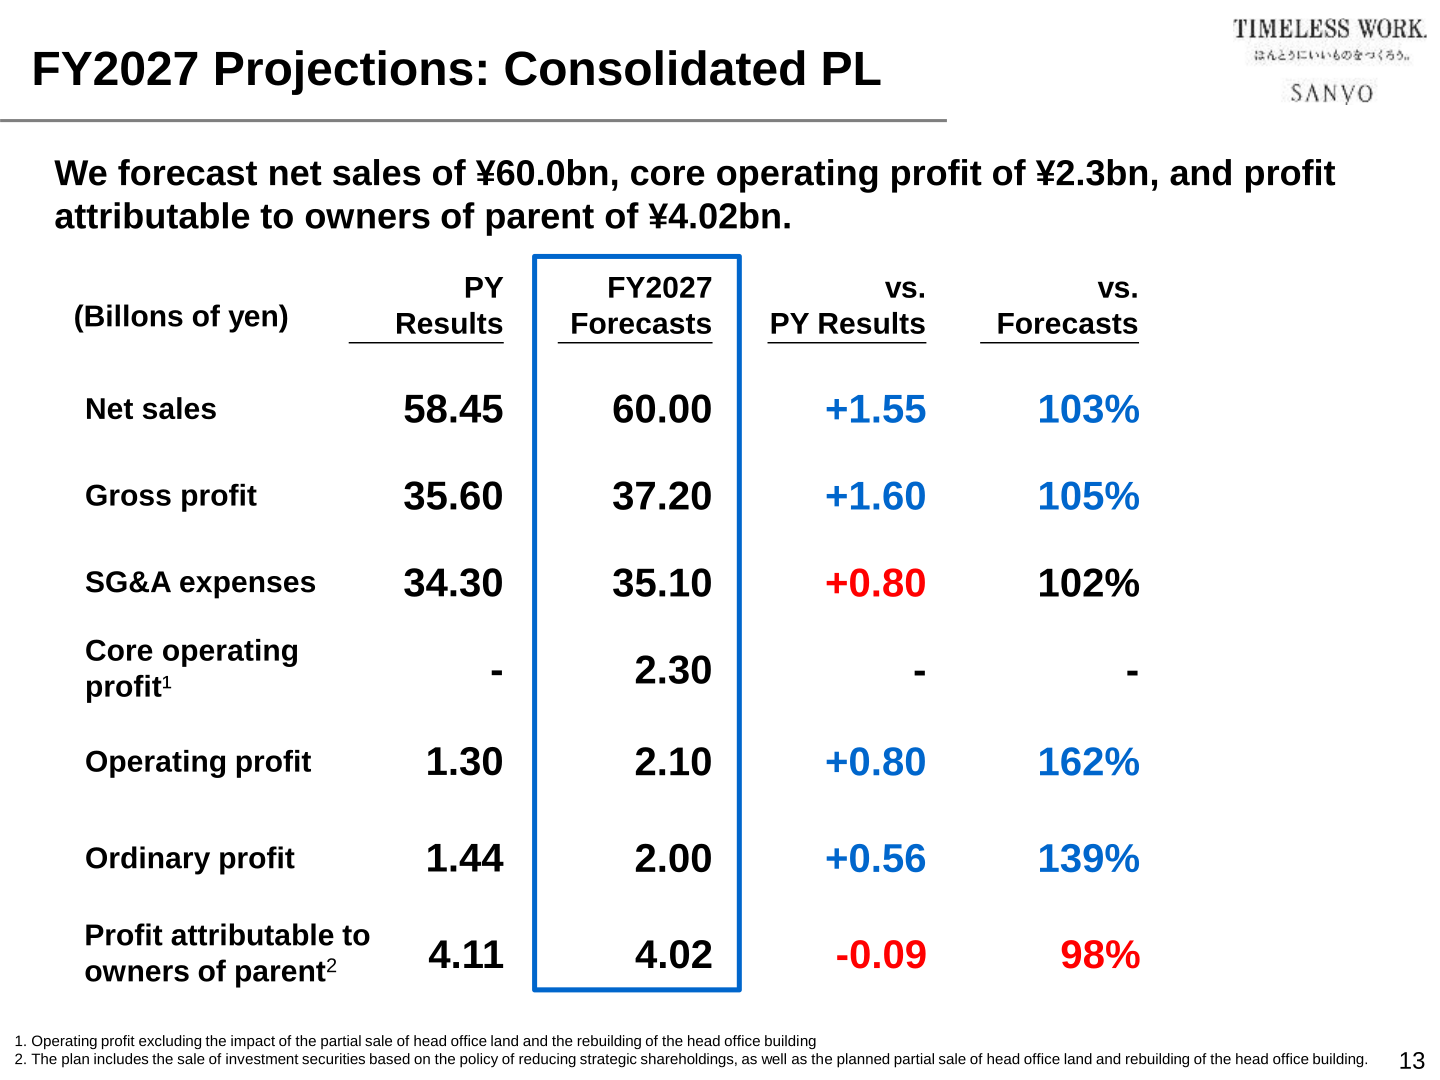
For Fiscal 2027 (fiscal year ending February 28, 2027), the company forecasts net sales of ¥60.00bn (103% of Fiscal 2026), gross profit of ¥37.20bn (105%) and SG&A expenses of ¥35.10bn (102%). It has newly introduced “core operating profit,” which excludes the impact of the planned partial sale of head office land and the rebuilding of the head office building, and forecasts core operating profit of ¥2.30bn (core operating margin of 3.8%). Operating profit is forecast at ¥2.10bn (162% of Fiscal 2026), ordinary profit at ¥2.00bn (139%) and profit attributable to owners of parent at ¥4.02bn (98%). The forecast includes the planned sale of investment securities under the company’s policy of reducing strategic shareholdings, as well as the planned partial sale of head office land and rebuilding of the head office building.
| Item (Billions of Yen) | PY Results (FY2026) | FY2027 Forecasts | vs. PY Results | vs. Forecasts (%) |
|---|---|---|---|---|
| Net sales | 58.45 | 60.00 | +1.55 | 103% |
| Gross profit | 35.60 | 37.20 | +1.60 | 105% |
| SG&A expenses | 34.30 | 35.10 | +0.80 | 102% |
| Core operating profit | – | 2.30 | – | – |
| Operating profit | 1.30 | 2.10 | +0.80 | 162% |
| Ordinary profit | 1.44 | 2.00 | +0.56 | 139% |
| Profit attributable to owners of parent | 4.11 | 4.02 | -0.09 | 98% |
On gross margin, the company targets 62.0% for Fiscal 2027 (+1.1 points versus Fiscal 2026), to be achieved by controlling the procurement cost ratio, strengthening inventory control and improving the full-price sales ratio, which is projected at 64.2% for Fiscal 2027 compared with 59.5% in Fiscal 2026. Product inventory at the end of Fiscal 2027 is projected at ¥7.33bn, down from ¥8.18bn at the end of Fiscal 2026.
Shareholder Returns
The presentation does not include a dedicated dividend slide or a specific dividend-per-share figure; this cannot be confirmed from the materials. It states that capital efficiency improved through the sale of strategic shareholdings and share buybacks, and that share buybacks and shareholder dividends were primary factors reducing cash and deposits during the year. As of February 28, 2026, equity (reference figure) was ¥40,903 million, up ¥1.6bn year on year; the equity-to-asset ratio was 68.3% (down 0.6 points year on year); and the debt-to-equity ratio (DER) was 0.18x.
Medium-Term Plan / Topics
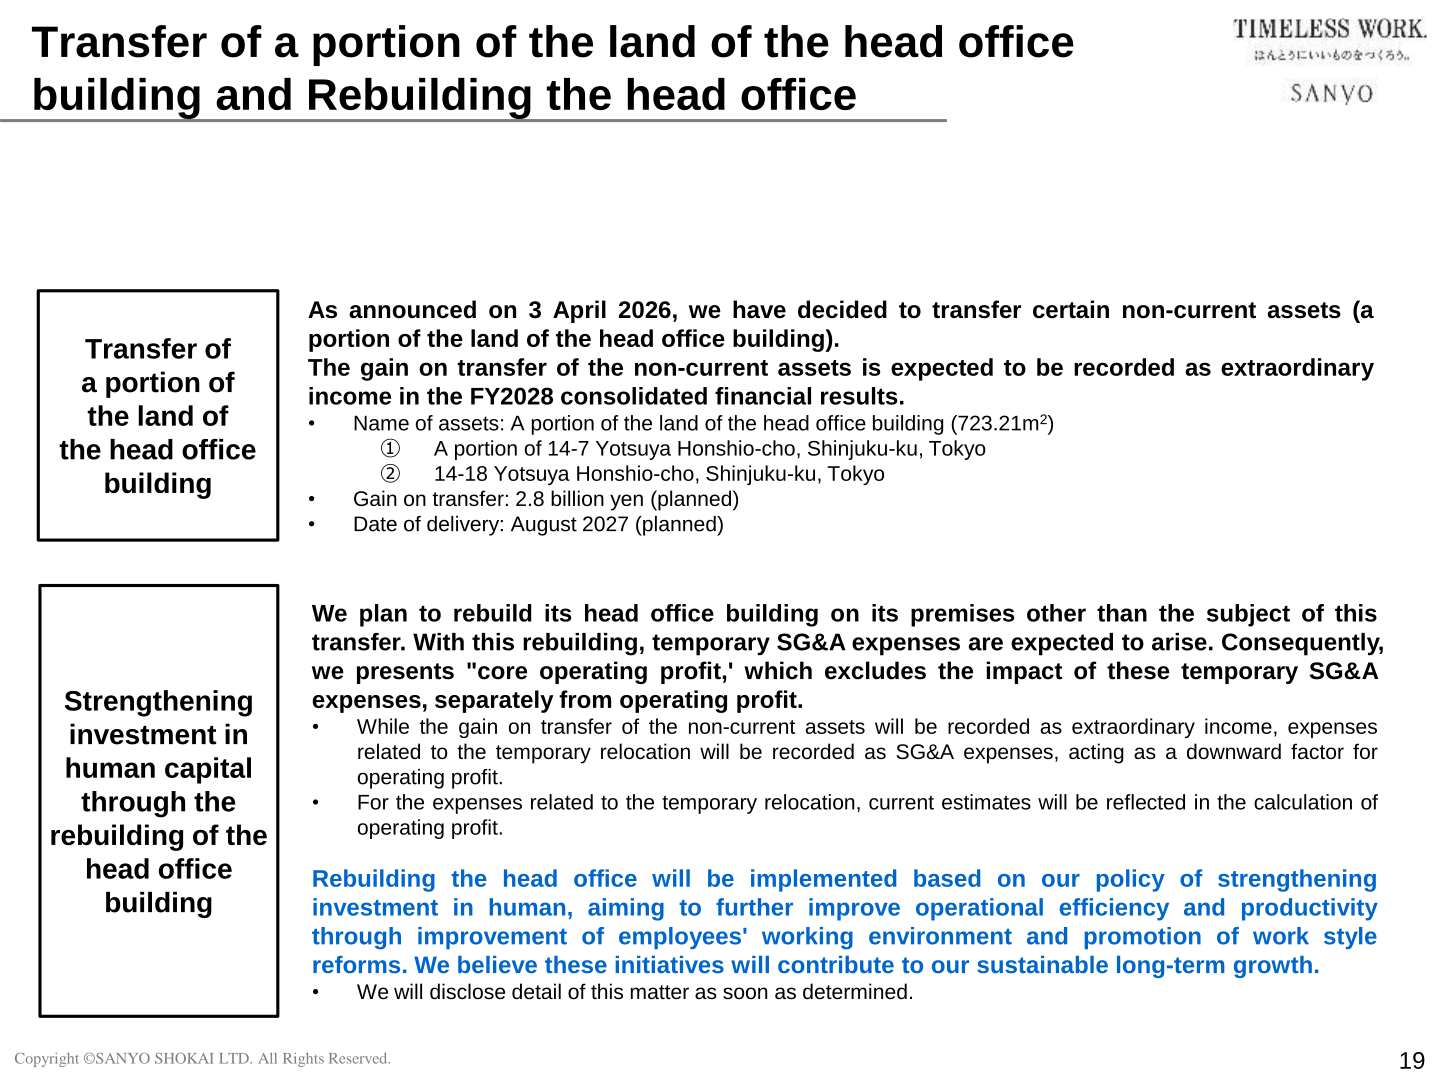
As announced on April 3, 2026, the company decided to transfer a portion of the land beneath its head office building (723.21m², at Yotsuya Honshio-cho, Shinjuku-ku, Tokyo), with a planned gain on transfer of ¥2.8 billion and a planned delivery date of August 2027; the gain is expected to be recorded as extraordinary income in the Fiscal 2028 consolidated results. The company also plans to rebuild its head office building on other premises, which will generate temporary SG&A expenses; to separate this effect from ongoing profitability, the company introduced “core operating profit,” reported alongside operating profit going forward. Management said the rebuilding is based on its policy of strengthening investment in human capital, aiming to improve operational efficiency and productivity through improved working conditions and work-style reforms.
This article is an analysis based on publicly available information and is not a recommendation to buy or sell any specific securities. Investment decisions are your own responsibility.
















