
This article is based on publicly available IR materials and is not a recommendation to buy or sell any specific securities.
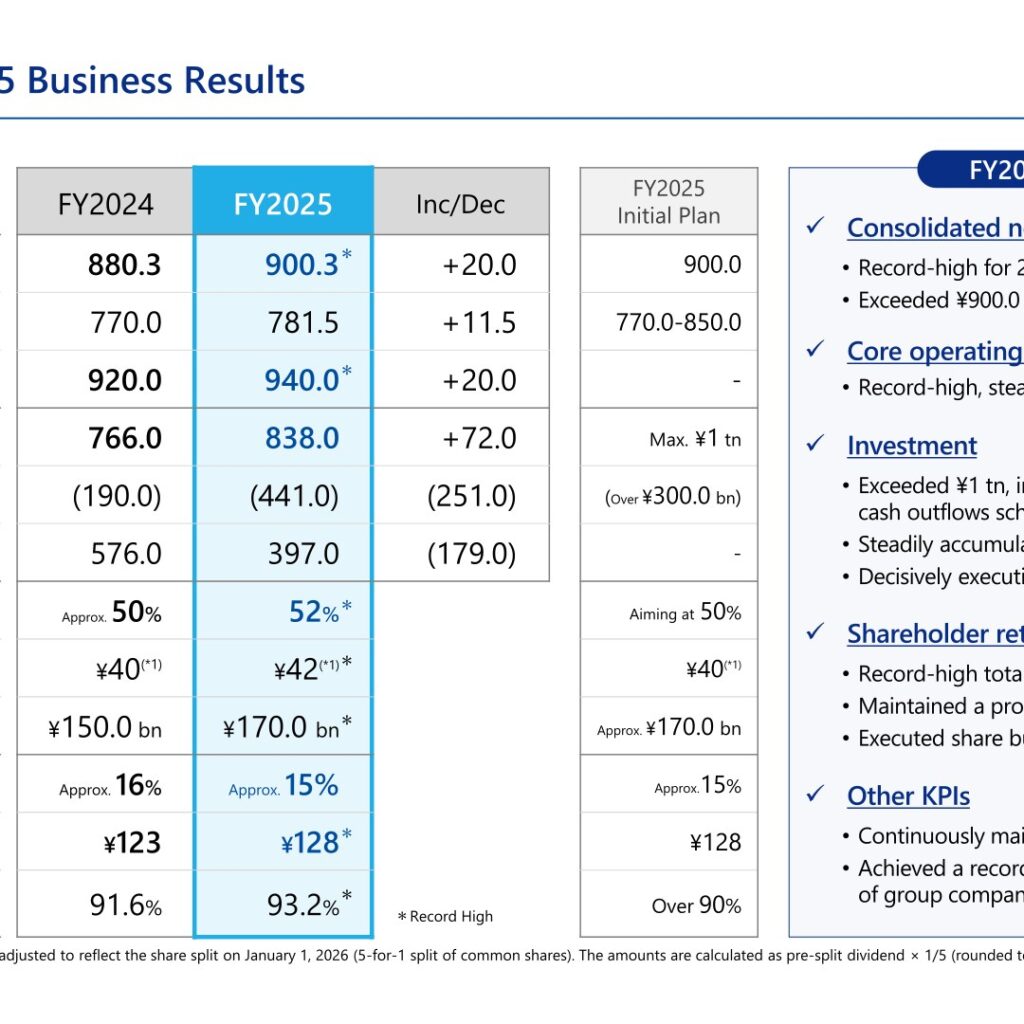
ITOCHU Corporation (8001) reported consolidated net profit of ¥900.3 billion for FY2025 (the fiscal year ended March 2026), up ¥20.0 billion year on year and a record high for two consecutive years, exceeding ¥900.0 billion for the first time. Core profit rose to ¥781.5 billion (+¥11.5 billion YoY) and core operating cash flows reached a record ¥940.0 billion (+¥20.0 billion YoY). For FY2026 (the fiscal year ending March 2027), ITOCHU has set a Management Plan targeting consolidated net profit of ¥950.0 billion, with growth investment planned at the ¥1.5 trillion level and a total payout ratio of 64%, including share buybacks of ¥300.0 billion or more and DPS of ¥44 or higher.
Consolidated Results (Full-Year Actual)
Revenues for FY2025 were ¥14,823.1 billion (+¥98.9 billion YoY) and gross trading profit was ¥2,480.5 billion (+¥104.1 billion YoY). Trading income increased to ¥701.9 billion (+¥18.0 billion YoY), and profit before tax rose to ¥1,199.5 billion (+¥44.4 billion YoY), supported in part by gains on investments of ¥175.2 billion (+¥92.0 billion YoY), which included the sale of C.P. Pokphand and the restructuring of the pulp business. Total shareholders’ equity increased to ¥6,590.0 billion (+¥834.9 billion), NET DER improved to 0.46 times (a record), and the ratio of shareholders’ equity to total assets rose to 39.4% (+1.4pt). ROE was 14.6% (down 1.2pt YoY) and ROA was 5.7% (down 0.3pt YoY). (Unit: billion yen unless otherwise noted.)
| Item | FY2024 | FY2025 | Inc/Dec | FY2025 Initial Plan |
|---|---|---|---|---|
| Consolidated net profit (billion yen) | 880.3 | 900.3 | +20.0 | 900.0 |
| Core profit (billion yen) | 770.0 | 781.5 | +11.5 | 770.0–850.0 |
| Core operating cash flows (billion yen) | 920.0 | 940.0 | +20.0 | – |
| Growth investment, gross (billion yen) | 766.0 | 838.0 | +72.0 | Max. ¥1 tn |
| EXIT (billion yen) | (190.0) | (441.0) | (251.0) | (Over ¥300.0 bn) |
| Net investment (billion yen) | 576.0 | 397.0 | (179.0) | – |
| Total payout ratio | Approx. 50% | 52% | – | Aiming at 50% |
| Dividend per share (*1) | ¥40 | ¥42 | – | ¥40 |
| Share buybacks | ¥150.0 bn | ¥170.0 bn | – | Approx. ¥170.0 bn |
| ROE | Approx. 16% | Approx. 15% | – | Approx. 15% |
| EPS | ¥123 | ¥128 | – | ¥128 |
| Ratio of Group Companies Reporting Profits | 91.6% | 93.2% | – | Over 90% |
Segment Results
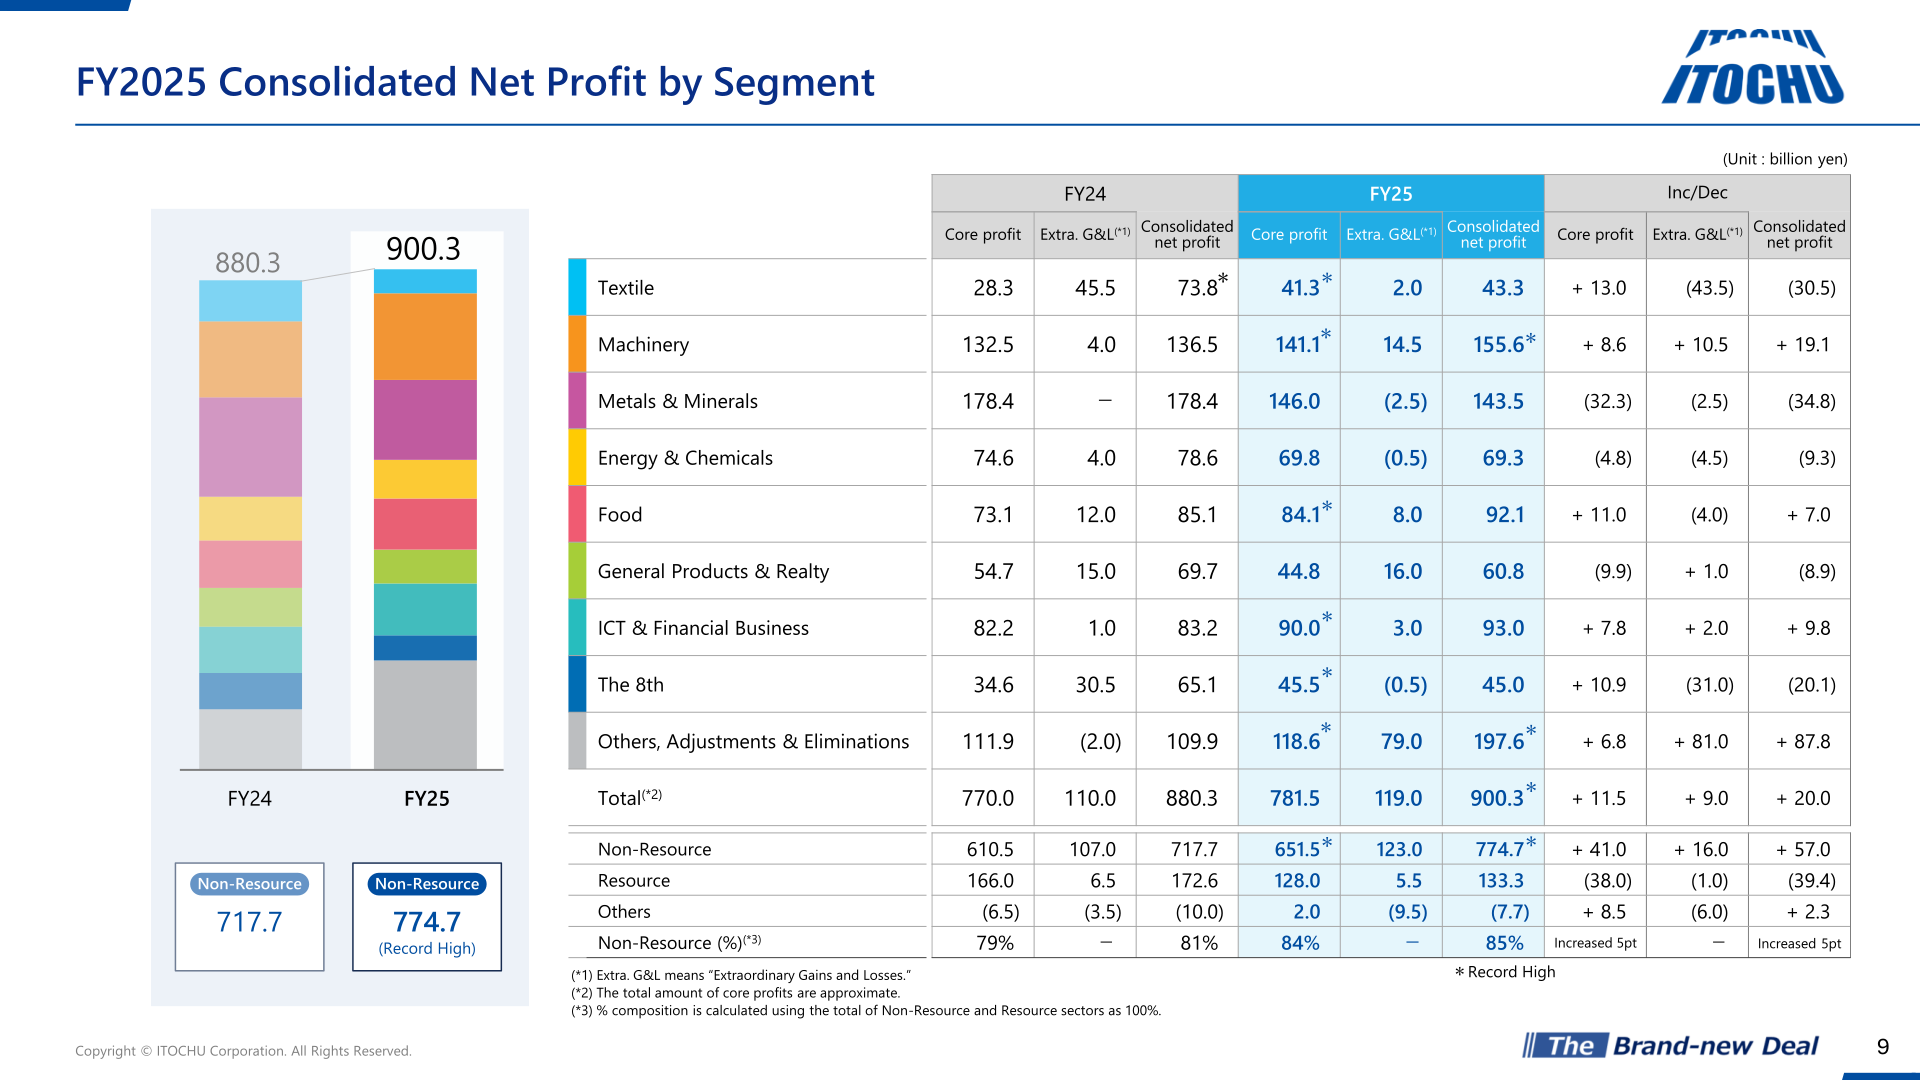
By segment, Non-Resource businesses posted a record consolidated net profit of ¥774.7 billion (+¥57.0 billion YoY), lifting the Non-Resource ratio to 85% (Increased 5pt), while Resource businesses declined to ¥133.3 billion (-¥39.4 billion YoY) on lower iron ore and coal prices, higher costs and forex impact. Others, Adjustments & Eliminations rose sharply to ¥197.6 billion (+¥87.8 billion YoY), driven mainly by an extraordinary gain of ¥88.0 billion from the sale of C.P. Pokphand. Machinery (+¥19.1 billion), ICT & Financial Business (+¥9.8 billion) and Food (+¥7.0 billion) increased year on year, while Textile declined ¥30.5 billion (mainly due to the absence of a prior-year revaluation gain from DESCENTE’s conversion into a consolidated subsidiary), Metals & Minerals declined ¥34.8 billion, and The 8th declined ¥20.1 billion.
| Segment | FY2024 Consolidated net profit | FY2025 Consolidated net profit | Inc/Dec |
|---|---|---|---|
| Textile | 73.8 | 43.3 | (30.5) |
| Machinery | 136.5 | 155.6 | +19.1 |
| Metals & Minerals | 178.4 | 143.5 | (34.8) |
| Energy & Chemicals | 78.6 | 69.3 | (9.3) |
| Food | 85.1 | 92.1 | +7.0 |
| General Products & Realty | 69.7 | 60.8 | (8.9) |
| ICT & Financial Business | 83.2 | 93.0 | +9.8 |
| The 8th | 65.1 | 45.0 | (20.1) |
| Others, Adjustments & Eliminations | 109.9 | 197.6 | +87.8 |
| Total (billion yen, approximate) | 880.3 | 900.3 | +20.0 |
| Non-Resource | 717.7 | 774.7 | +57.0 |
| Resource | 172.6 | 133.3 | (39.4) |
| Non-Resource ratio (%) | 81% | 85% | Increased 5pt |
FY2026 Forecast
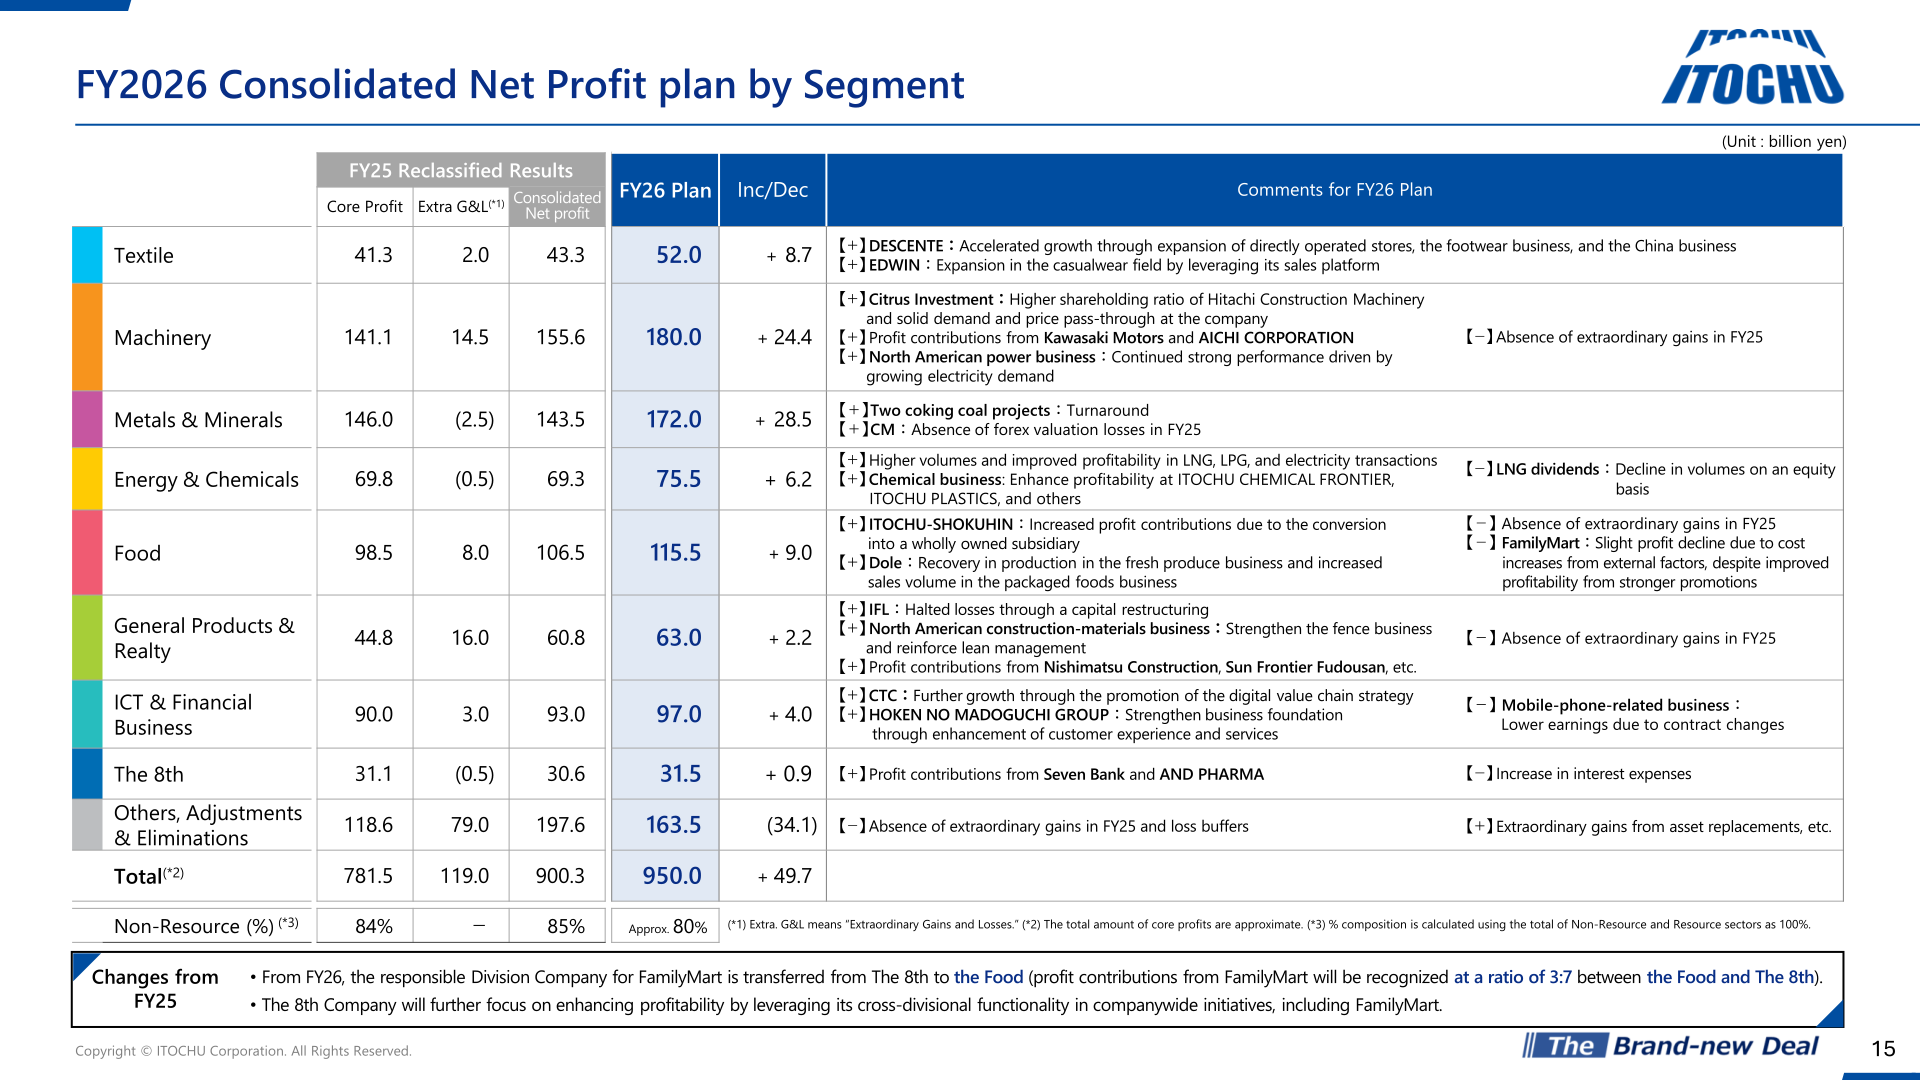
For FY2026, ITOCHU plans consolidated net profit of ¥950.0 billion (+¥49.7 billion vs. FY2025), with Core Profit planned at ¥900.0 billion, up from ¥781.5 billion in FY2025. By segment, Metals & Minerals (+¥28.5 billion, on a turnaround in two coking coal projects and the absence of forex valuation losses at CM), Machinery (+¥24.4 billion) and Food (+¥9.0 billion) are expected to lead growth, while Others, Adjustments & Eliminations is planned to decrease ¥34.1 billion mainly on the absence of extraordinary gains and loss buffers booked in FY2025. The plan assumes a Yen/US$ rate of 150 (vs. 150.67 in FY25) and TIBOR 3M of 1.50%. Note: from FY2026, responsibility for FamilyMart transfers from The 8th to Food, with profit contributions allocated 3:7 between Food and The 8th; the FY2025 figures shown below are presented on this reclassified basis for comparability. The Non-Resource ratio is planned at approximately 80% for FY2026, versus 85% in FY2025 (reclassified basis).
| Segment | FY2025 (Reclassified Actual) | FY2026 Plan | Inc/Dec |
|---|---|---|---|
| Textile | 43.3 | 52.0 | +8.7 |
| Machinery | 155.6 | 180.0 | +24.4 |
| Metals & Minerals | 143.5 | 172.0 | +28.5 |
| Energy & Chemicals | 69.3 | 75.5 | +6.2 |
| Food | 106.5 | 115.5 | +9.0 |
| General Products & Realty | 60.8 | 63.0 | +2.2 |
| ICT & Financial Business | 93.0 | 97.0 | +4.0 |
| The 8th | 30.6 | 31.5 | +0.9 |
| Others, Adjustments & Eliminations | 197.6 | 163.5 | (34.1) |
| Total (billion yen, approximate) | 900.3 | 950.0 | +49.7 |
Shareholder Returns
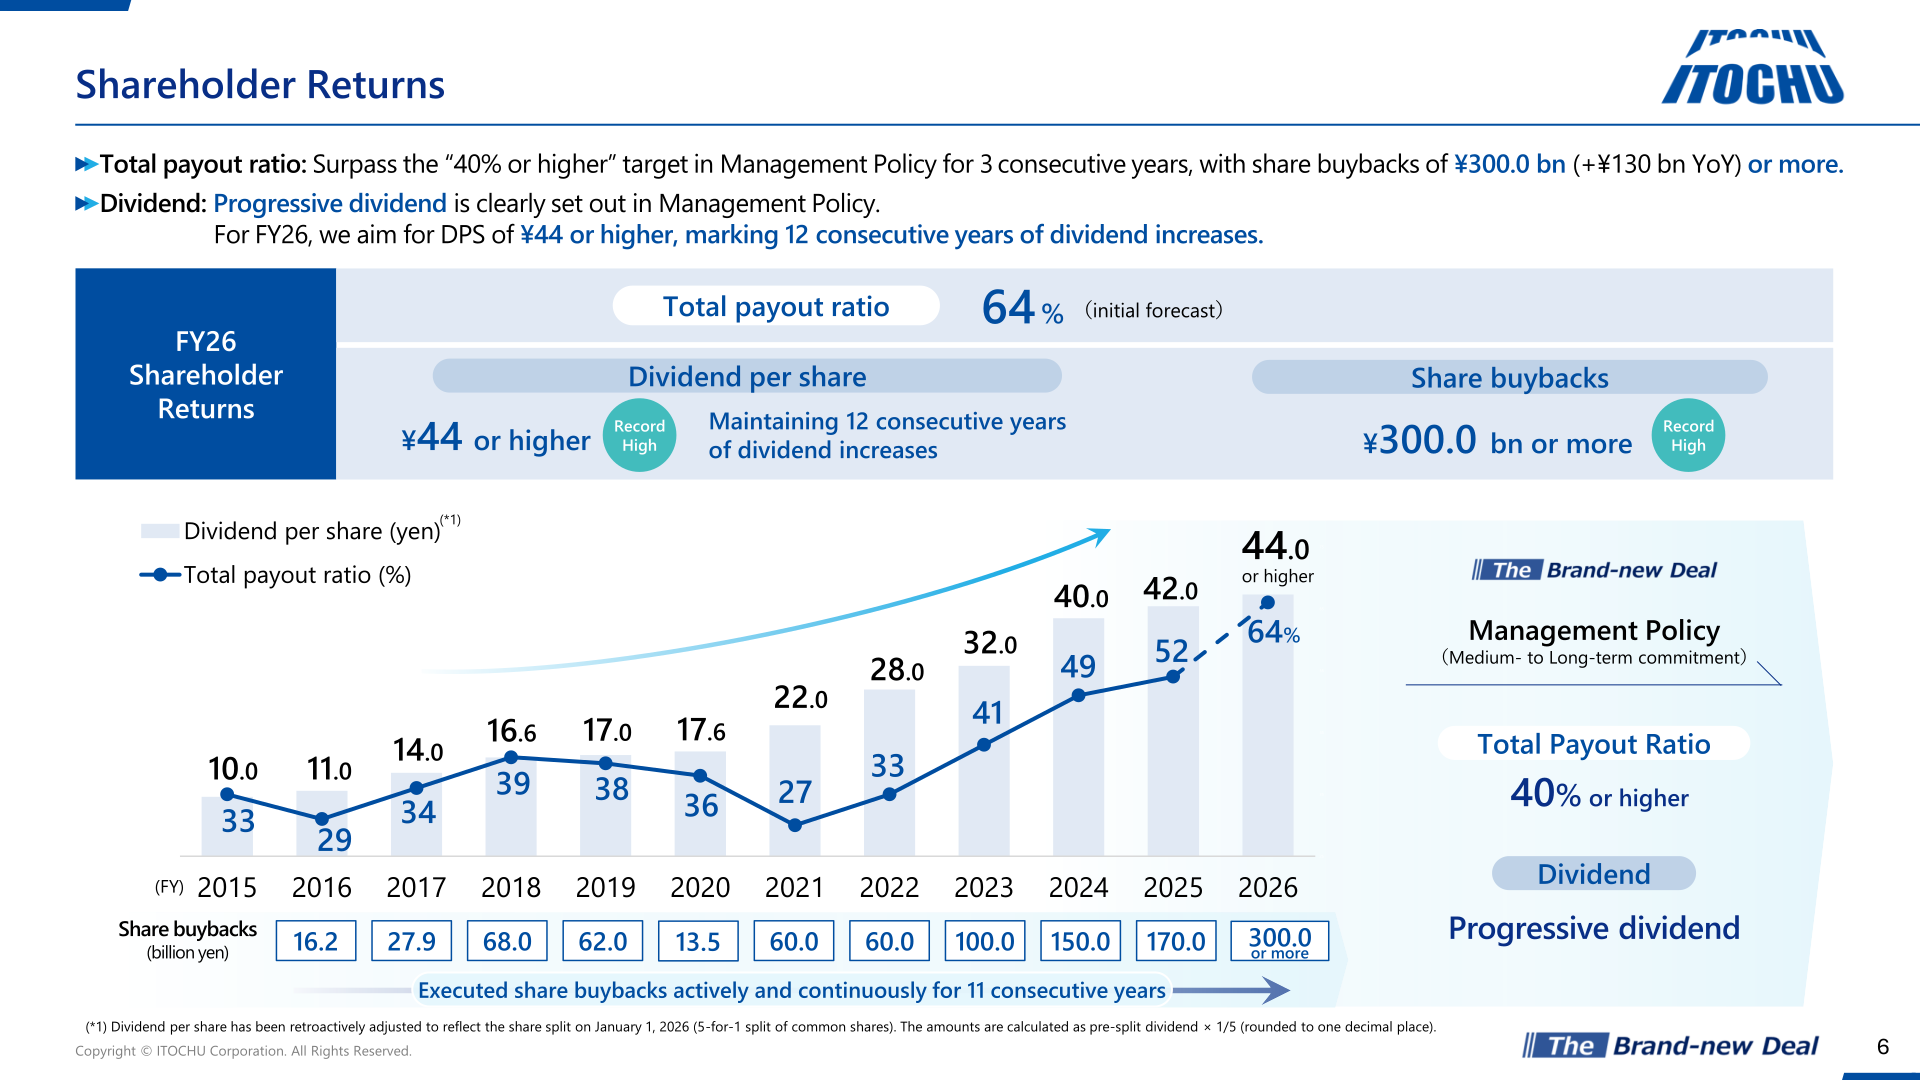
ITOCHU’s total payout ratio reached a record 52% in FY2025 (dividends plus share buybacks), surpassing the Management Policy’s “40% or higher” target for three consecutive years. Dividend per share was ¥42 in FY2025 (up from ¥40 in FY2024, retroactively adjusted for the 5-for-1 stock split effective January 1, 2026), and ITOCHU executed share buybacks of ¥170.0 billion as initially announced. For FY2026, the company is targeting a total payout ratio of 64%, with share buybacks of ¥300.0 billion or more (+¥130 billion YoY) and a progressive dividend of ¥44 or higher per share, which would mark 12 consecutive years of dividend increases and 11 consecutive years of continuous share buybacks.
| Item | FY2024 | FY2025 | FY2026 Plan |
|---|---|---|---|
| Total payout ratio | Approx. 50% | 52% | 64% |
| Dividend per share (*1) | ¥40 | ¥42 | ¥44 or higher |
| Share buybacks | ¥150.0 bn | ¥170.0 bn | ¥300.0 bn or more |
Medium-Term Plan / Topics
ITOCHU announced its Management Policy, “The Brand-new Deal,” in April 2024, built around “No growth without investments,” a commitment to a total payout ratio of 40% or higher over the long term, and enhancement of corporate brand value. In May 2026, the company clearly set out a Progressive Dividend policy within the Management Policy. Under the FY2026 Management Plan, growth investment is planned at the ¥1.5 trillion level (net investment approx. ¥1.3 trillion after EXIT of approx. ¥200.0 billion), with about ¥300.0 billion — one-quarter of the FY2026 new investment plan — already committed across four key areas: Mobility (Hitachi Construction Machinery, additional investment of ¥134.1 billion), Power (North American power business, investment of approx. ¥20.0 billion), Food (ITOCHU-SHOKUHIN, investment of ¥78.4 billion, becoming a wholly owned subsidiary), and Real Estate (Sun Frontier Fudousan, investment of ¥32.0 billion). ITOCHU also noted that it has outperformed TOPIX for 11 consecutive years and disclosed plans to hold its first Investor Day, “ITOCHU Day,” on July 8, 2026.
This article is an analysis based on publicly available information and is not a recommendation to buy or sell any specific securities. Investment decisions are your own responsibility.
![[Obayashi] Investors’ Guide 2026 — The Complete 24-Article Breakdown](https://japan-equity.com/wp-content/uploads/2026/07/hub_cover-1024x1024.png)
![[Obayashi] IR & SR Policy — Feeding Dialogue Back into Management](https://japan-equity.com/wp-content/uploads/2026/07/p32_sq-1024x1024.jpg)
![[Obayashi] Domestic Civil Engineering — Resilience Spending Supports 9.6% Margin](https://japan-equity.com/wp-content/uploads/2026/07/p11_sq-1024x1024.jpg)
![[Obayashi] Overseas Construction — Orders Reach ¥1.2tn](https://japan-equity.com/wp-content/uploads/2026/07/p15_sq-1024x1024.jpg)
![[Obayashi] Share Price & External Ratings — vs TOPIX, ESG Index Inclusion](https://japan-equity.com/wp-content/uploads/2026/07/p40_sq-1024x1024.jpg)
![[Construction] ¥75.5tn Investment, Shrinking Workforce — Big-5 Market Share](https://japan-equity.com/wp-content/uploads/2026/07/p12_sq-1024x1024.jpg)



![[Obayashi] Capital Policy & Shareholder Returns — ROE 10%+, DOE ~5%, ¥100bn Buyback](https://japan-equity.com/wp-content/uploads/2026/07/p27_sq-1024x1024.jpg)
![[Obayashi] Reducing Cross-Shareholdings — ¥285.2bn Sold in Five Years](https://japan-equity.com/wp-content/uploads/2026/07/p29_sq-1024x1024.jpg)
![[Obayashi] ¥750bn Investment Plan — ¥300bn to Development, ¥190bn to Tech/DX](https://japan-equity.com/wp-content/uploads/2026/07/p30_sq-1024x1024.jpg)
![[Obayashi] MTP2022 KPIs — Operating Profit ~2x Target, ROE 14.4%](https://japan-equity.com/wp-content/uploads/2026/07/p25_sq-1024x1024.jpg)
![[Obayashi] Cash Allocation — ¥420bn Investment CF Over Five Years](https://japan-equity.com/wp-content/uploads/2026/07/p26_sq-1024x1024.jpg)
![[Obayashi] Green Energy — 44 Plants, 344MW, and the Green Hydrogen Challenge](https://japan-equity.com/wp-content/uploads/2026/07/p21_sq-1024x1024.jpg)
![[Obayashi] Tackling the Labor Shortage — Robotics Construction®](https://japan-equity.com/wp-content/uploads/2026/07/p14_sq-1024x1024.jpg)
