
This article is based on publicly available IR materials and is not a recommendation to buy or sell any specific securities.
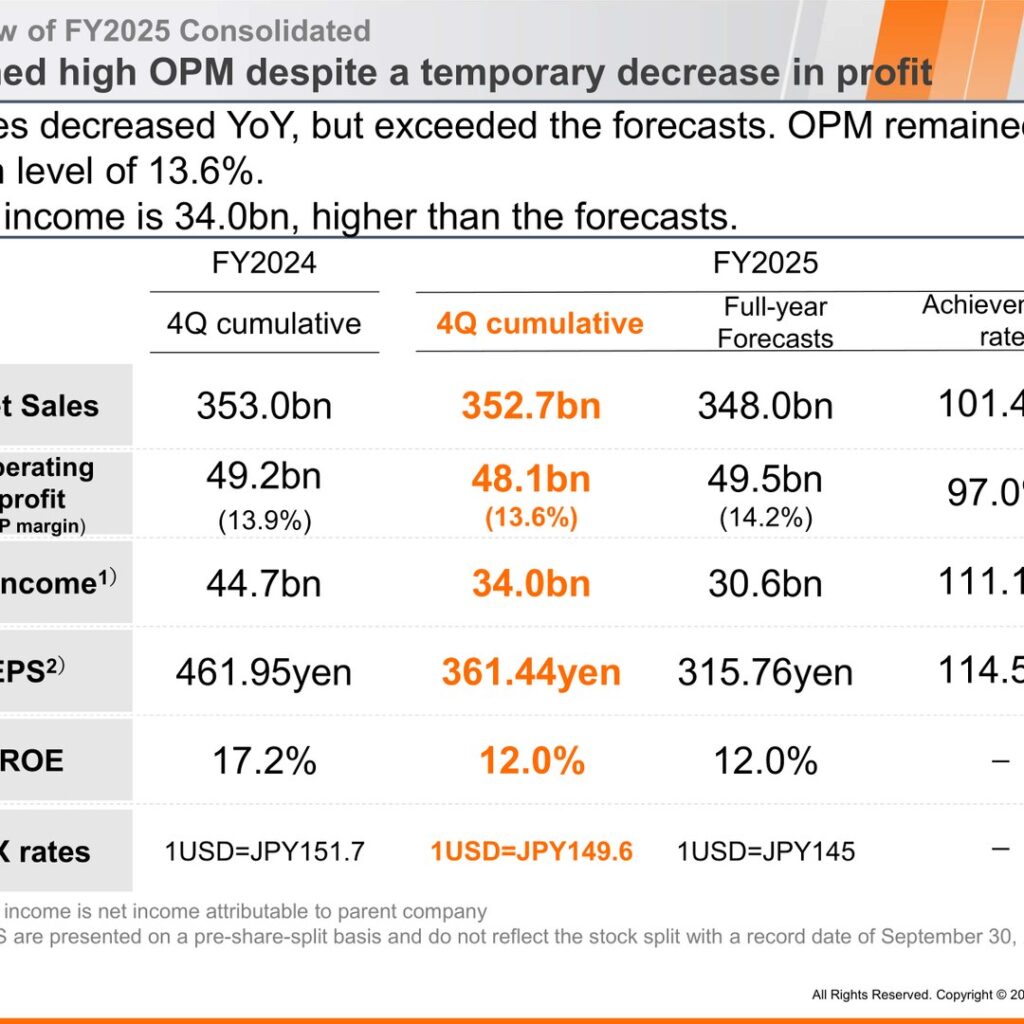
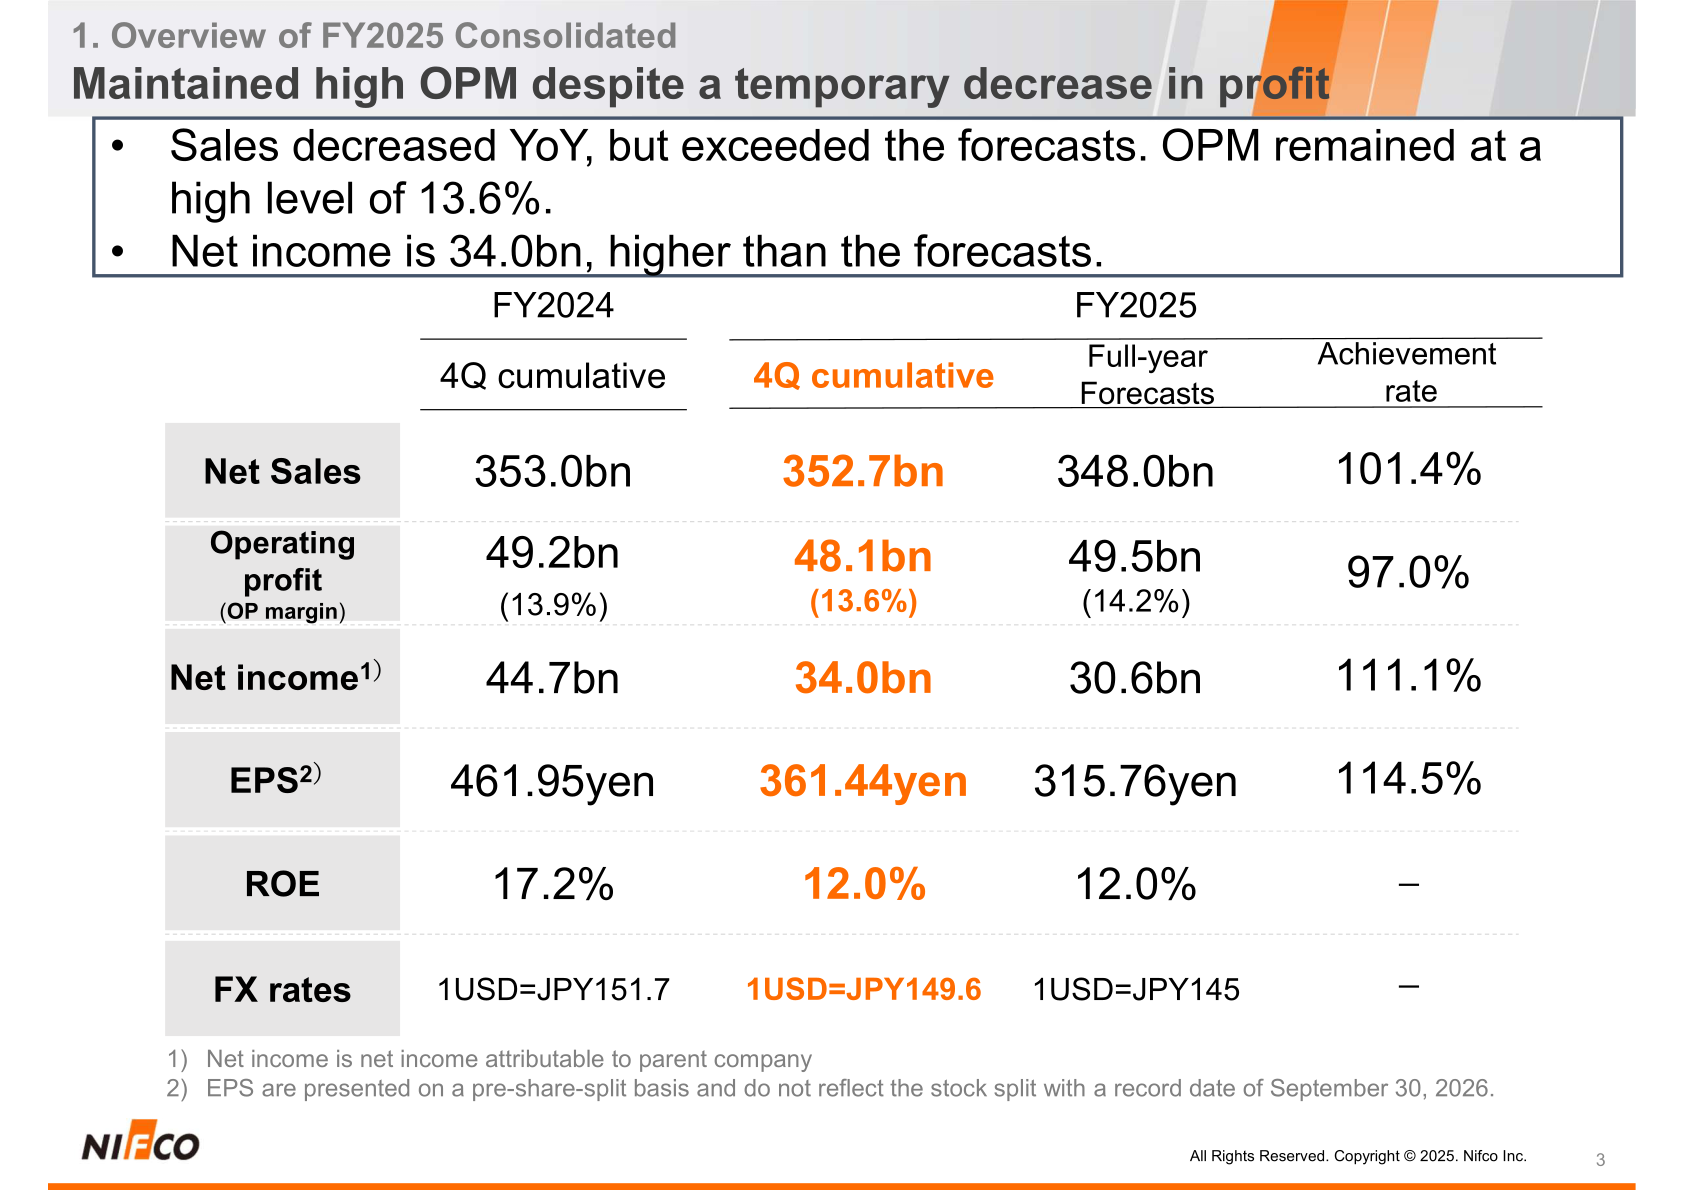
Nifco labels the completed fiscal year as “FY2025” and the forecast year as “FY2026”; segment figures are stated on the basis noted in the deck (Overseas: January – December 2025, Japan: April 2025 – March 2026). For FY2025, net sales were 352.7bn and operating profit was 48.1bn, an operating margin of 13.6%. Net income attributable to owners of the parent was 34.0bn, above the company’s full-year forecast of 30.6bn, despite one-off factors such as impairment losses. The company describes the year as one in which it maintained a high operating margin despite a temporary decrease in profit.
Consolidated Results (Full-Year Actual)
Sales decreased year on year but exceeded the forecast, and the operating margin remained at a high level of 13.6%. Net sales came in at 101.4% of the full-year forecast, operating profit at 97.0%, net income at 111.1% and EPS at 114.5%. ROE was 12.0%, in line with the forecast. The average exchange rate was 1USD=JPY149.6 against 1USD=JPY151.7 a year earlier. EPS figures are presented on a pre-share-split basis and do not reflect the stock split with a record date of September 30, 2026.
| Item | FY2024 (4Q cumulative) | FY2025 (4Q cumulative) | FY2025 Full-year Forecasts | Achievement rate |
|---|---|---|---|---|
| Net Sales | 353.0bn | 352.7bn | 348.0bn | 101.4% |
| Operating profit (OP margin) | 49.2bn (13.9%) | 48.1bn (13.6%) | 49.5bn (14.2%) | 97.0% |
| Net income (attributable to parent company) | 44.7bn | 34.0bn | 30.6bn | 111.1% |
| EPS (pre-share-split basis) | 461.95yen | 361.44yen | 315.76yen | 114.5% |
| ROE | 17.2% | 12.0% | 12.0% | – |
| FX rates | 1USD=JPY151.7 | 1USD=JPY149.6 | 1USD=JPY145 | – |
In the year-on-year operating profit analysis, presented with factors in units of 0.1 billions of yen, operating profit moved from 492 for 25/03 to 481 for 26/03. Positive factors were an increase/decrease in sales of 17 and an increase/decrease in marginal profit of 20. Negative factors were tariffs impact of -7, personnel costs of -9, other fixed costs of -6, temporary costs for a new plant (North America) of -7, restructuring at a plant (Thailand) of -3, unrealized profit in inventory of -10, and FX impact of -6. The company notes that material costs were on an upward trend but marginal profit increased mainly due to higher sales, lower outsourcing costs and improvement initiatives, while fixed costs rose mainly on higher personnel costs, utilities costs and advertising expenses.
Segment Results
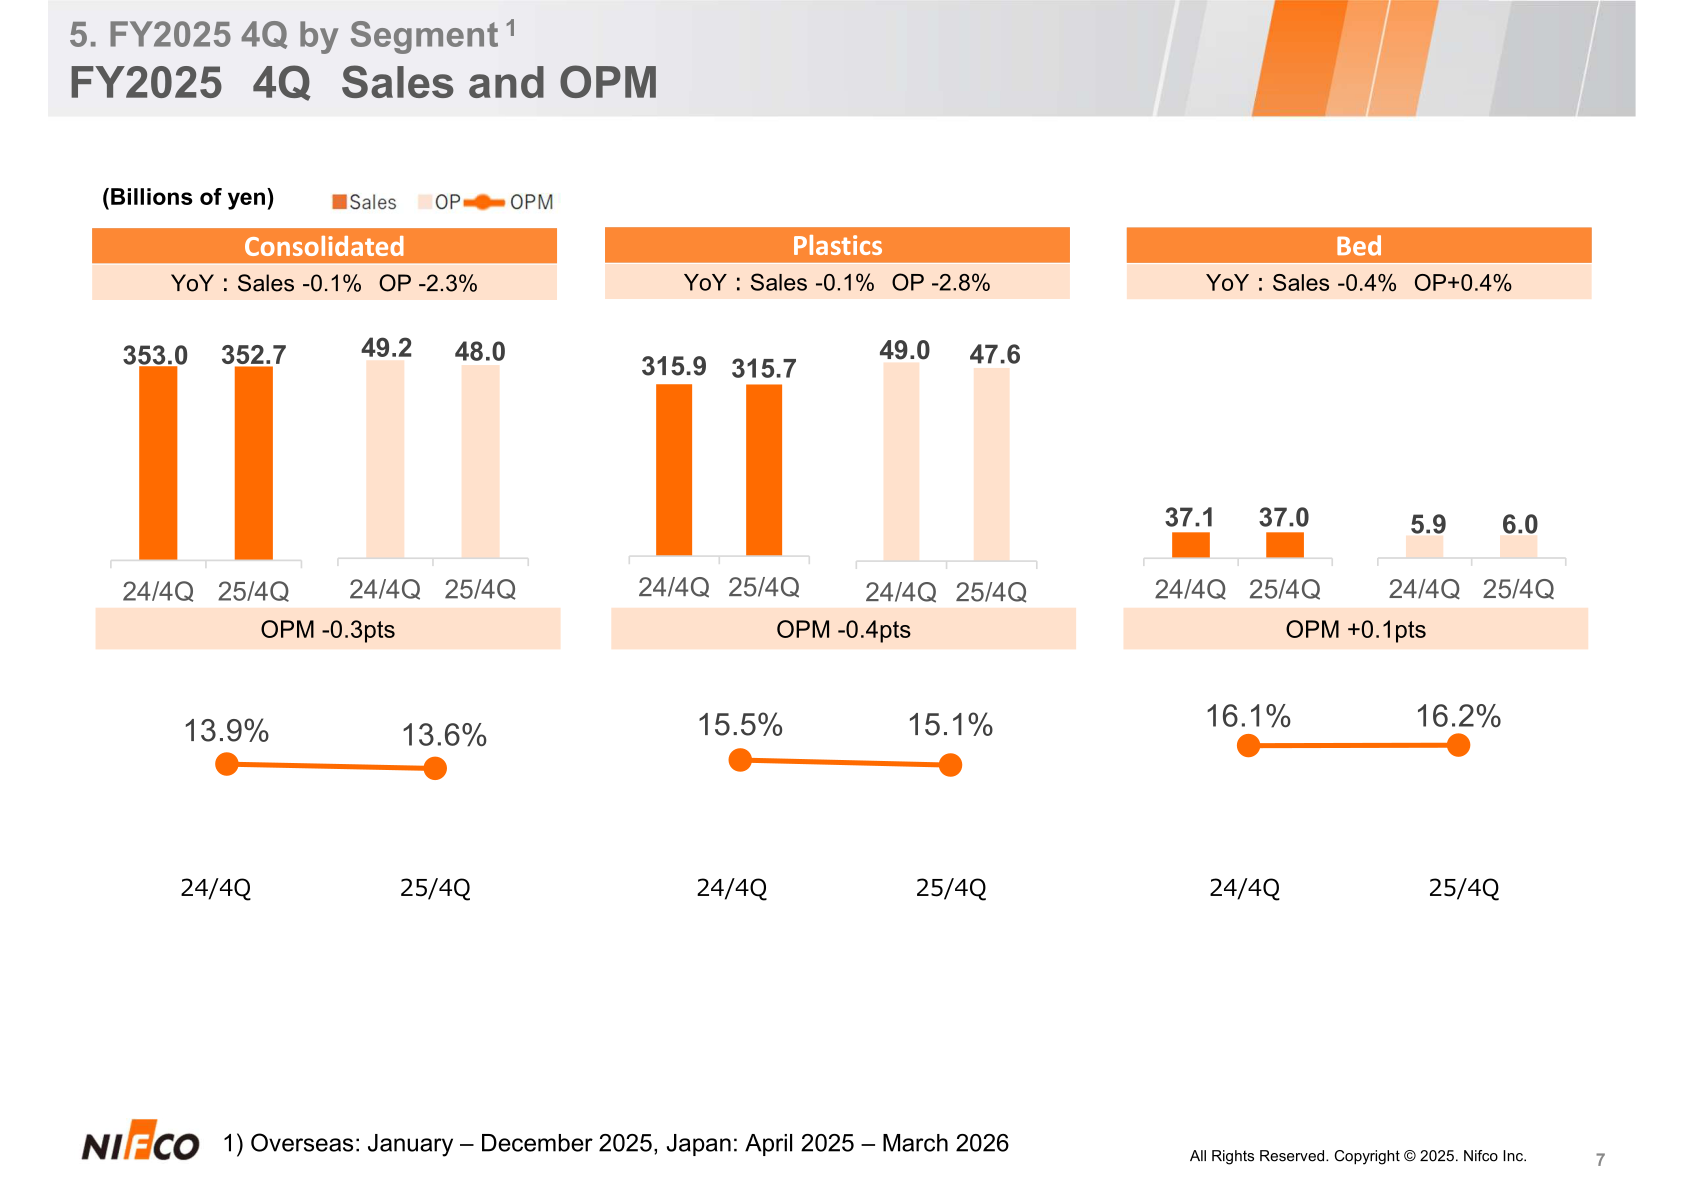
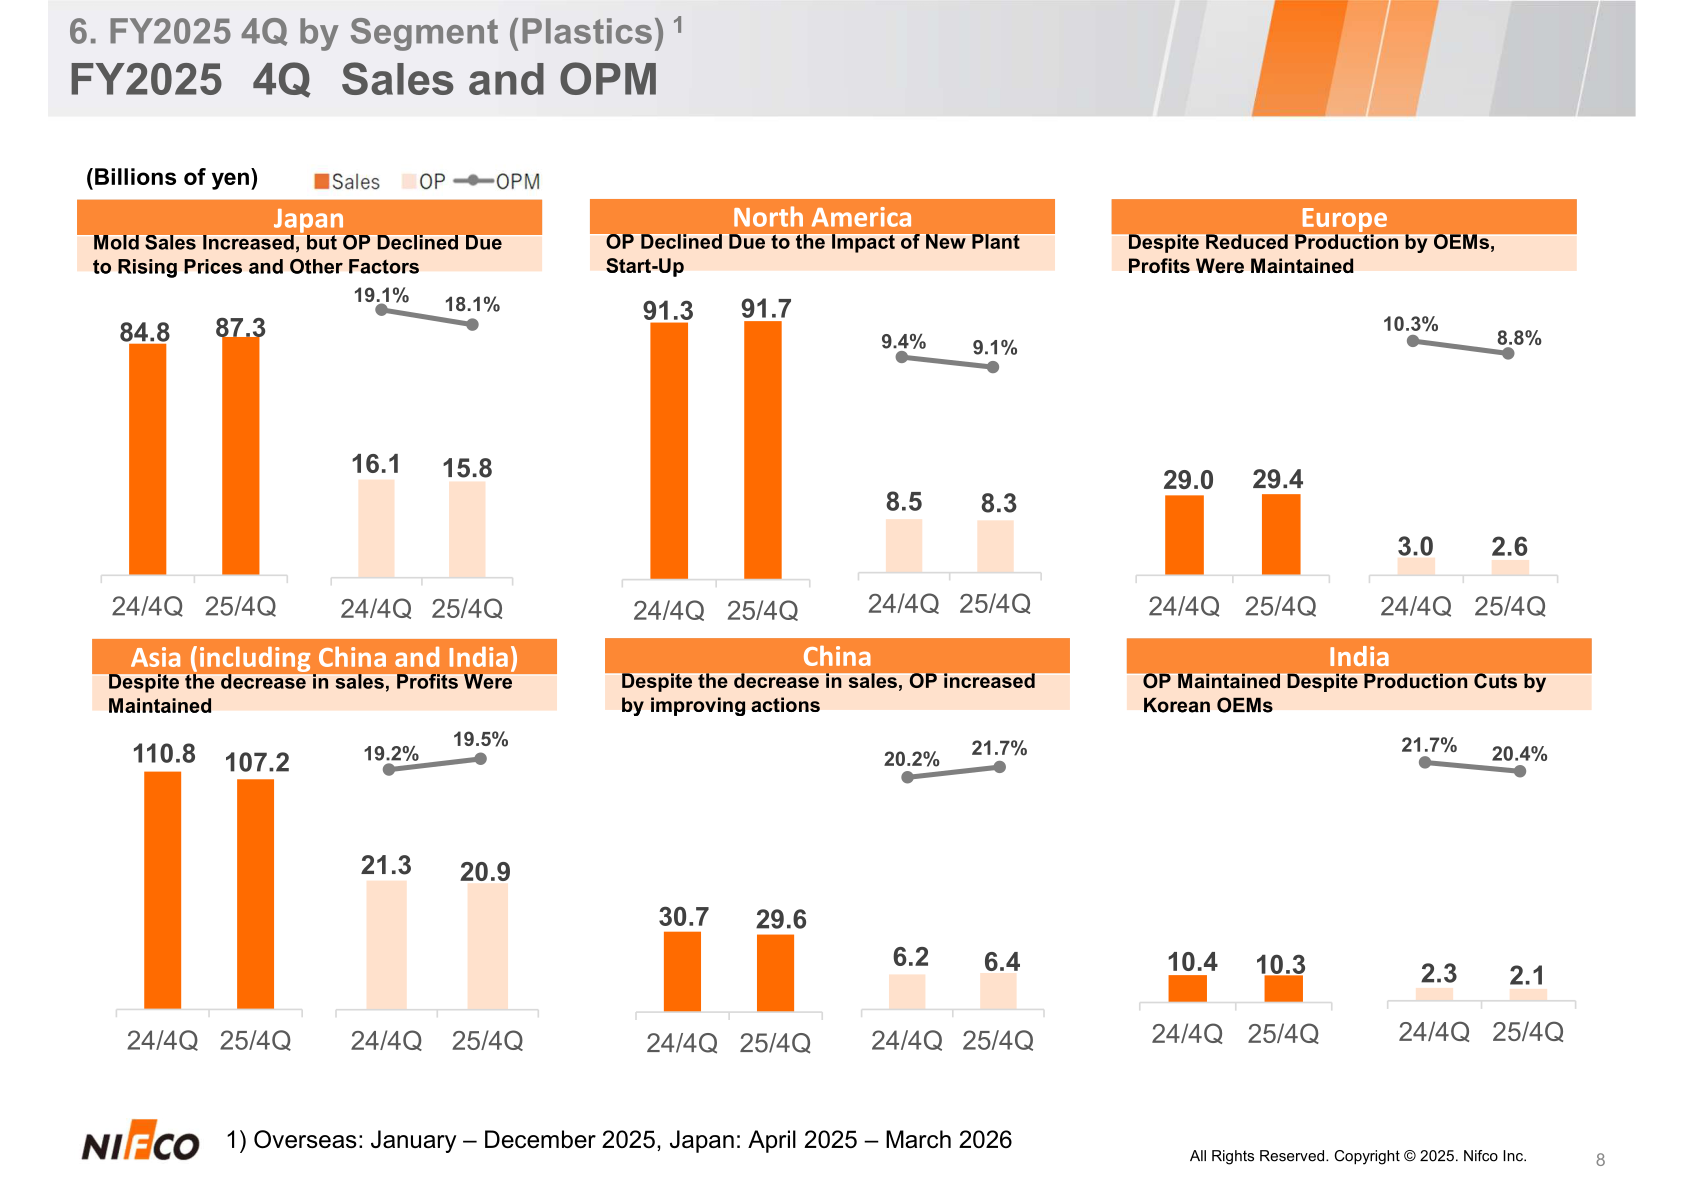
On a full-year (4Q cumulative) basis, consolidated sales were down 0.1% and operating profit down 2.3% year on year, with the operating margin down 0.3pts. The Plastics segment saw sales down 0.1% and operating profit down 2.8% (OPM -0.4pts), while the Bed segment posted sales down 0.4% and operating profit up 0.4% (OPM +0.1pts). Within Plastics, Japan recorded higher mold sales but lower operating profit due to rising prices and other factors; North America saw operating profit decline on the impact of a new plant start-up; Europe maintained profits despite reduced production by OEMs; Asia (including China and India) maintained profits despite lower sales; China increased operating profit through improving actions despite lower sales; and India maintained operating profit despite production cuts by Korean OEMs. In the Bed segment, Japan saw hotel and export businesses perform well while retail sales struggled, and Asia showed weakness in Hong Kong and strength in China.
| Segment (Billions of yen) | Sales 24/4Q | Sales 25/4Q | OP 24/4Q | OP 25/4Q | OPM 24/4Q | OPM 25/4Q |
|---|---|---|---|---|---|---|
| Consolidated | 353.0 | 352.7 | 49.2 | 48.0 | 13.9% | 13.6% |
| Plastics | 315.9 | 315.7 | 49.0 | 47.6 | 15.5% | 15.1% |
| Plastics: Japan | 84.8 | 87.3 | 16.1 | 15.8 | 19.1% | 18.1% |
| Plastics: North America | 91.3 | 91.7 | 8.5 | 8.3 | 9.4% | 9.1% |
| Plastics: Europe | 29.0 | 29.4 | 3.0 | 2.6 | 10.3% | 8.8% |
| Plastics: Asia (including China and India) | 110.8 | 107.2 | 21.3 | 20.9 | 19.2% | 19.5% |
| Plastics: China | 30.7 | 29.6 | 6.2 | 6.4 | 20.2% | 21.7% |
| Plastics: India | 10.4 | 10.3 | 2.3 | 2.1 | 21.7% | 20.4% |
| Bed | 37.1 | 37.0 | 5.9 | 6.0 | 16.1% | 16.2% |
| Bed: Japan | 20.1 | 19.8 | 2.8 | 2.8 | 14.2% | 14.1% |
| Bed: Asia | 17.0 | 17.2 | 3.1 | 3.2 | 18.4% | 18.5% |
Cash Flow and Capital Expenditure
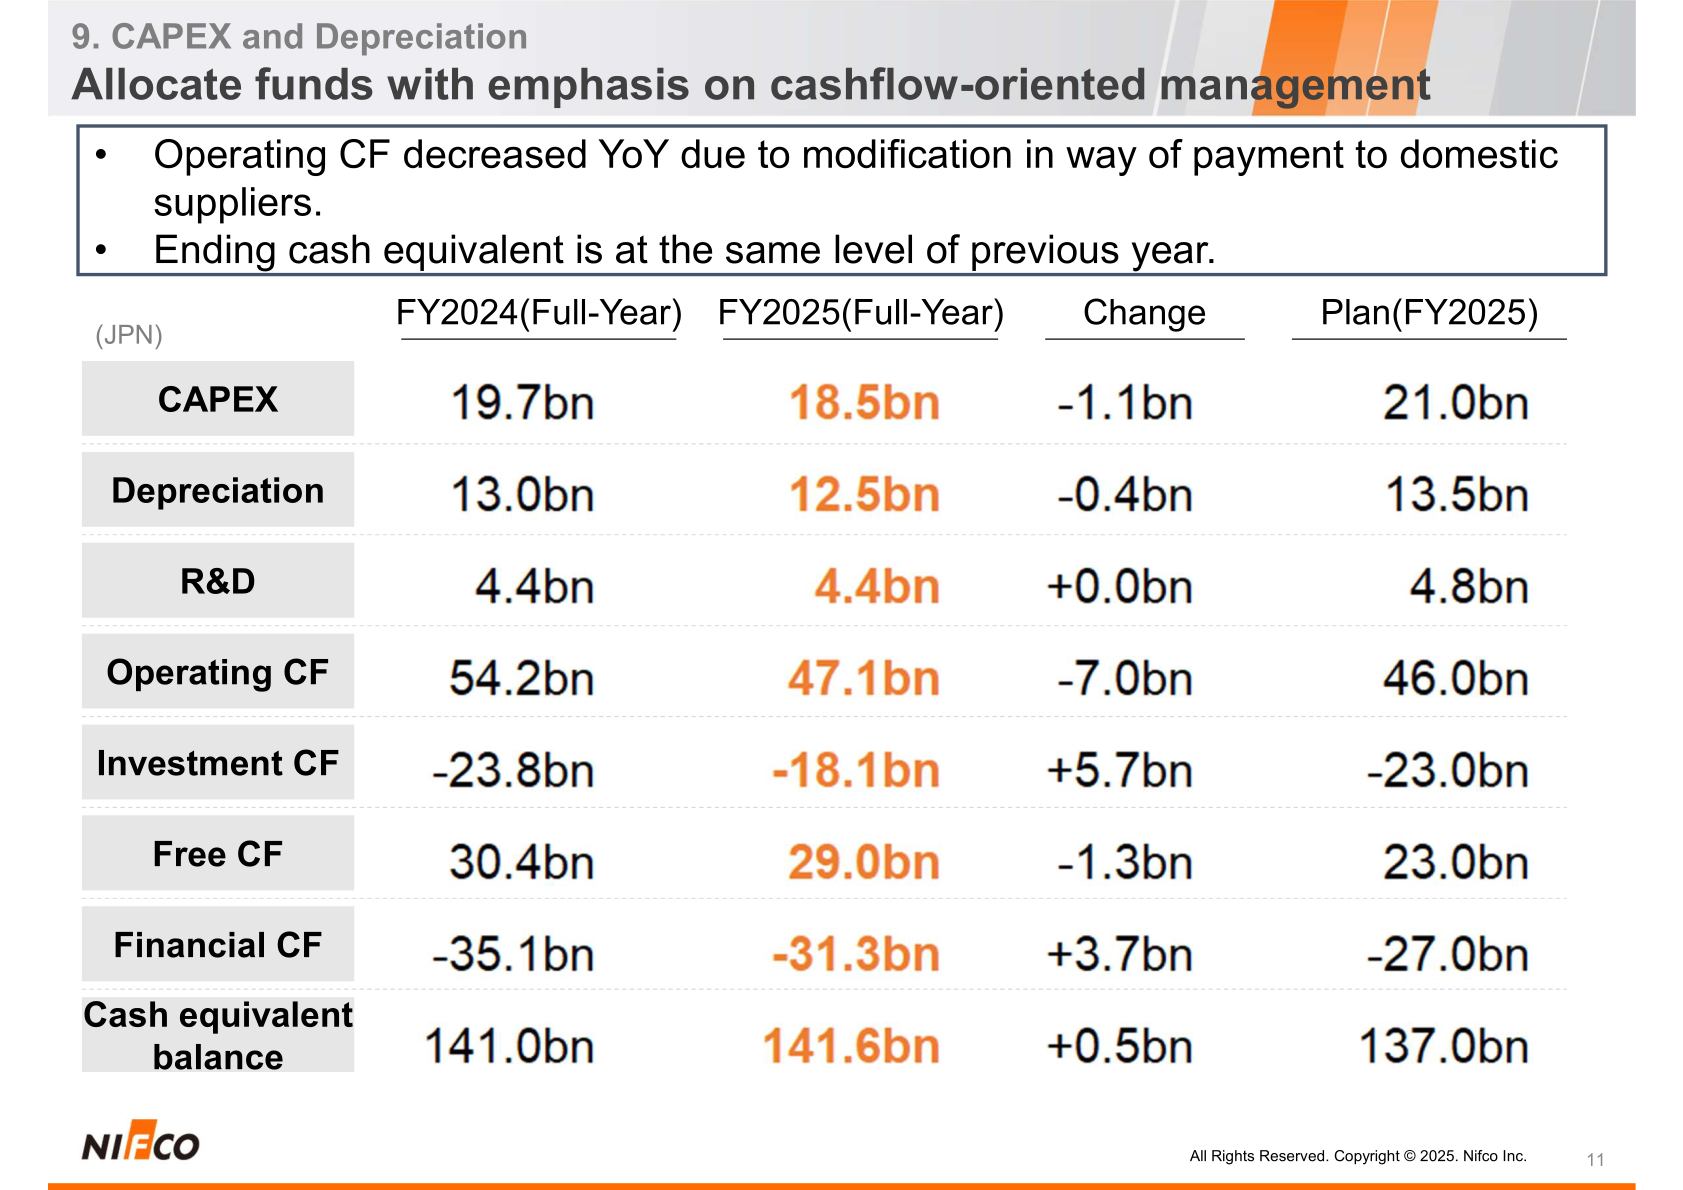
The company states that it allocates funds with an emphasis on cashflow-oriented management. Operating cash flow decreased year on year due to a modification in the way of payment to domestic suppliers, while the ending cash equivalent balance was at the same level as the previous year.
| Item (JPN) | FY2024 (Full-Year) | FY2025 (Full-Year) | Change | Plan (FY2025) |
|---|---|---|---|---|
| CAPEX | 19.7bn | 18.5bn | -1.1bn | 21.0bn |
| Depreciation | 13.0bn | 12.5bn | -0.4bn | 13.5bn |
| R&D | 4.4bn | 4.4bn | +0.0bn | 4.8bn |
| Operating CF | 54.2bn | 47.1bn | -7.0bn | 46.0bn |
| Investment CF | -23.8bn | -18.1bn | +5.7bn | -23.0bn |
| Free CF | 30.4bn | 29.0bn | -1.3bn | 23.0bn |
| Financial CF | -35.1bn | -31.3bn | +3.7bn | -27.0bn |
| Cash equivalent balance | 141.0bn | 141.6bn | +0.5bn | 137.0bn |
FY2026 Forecast
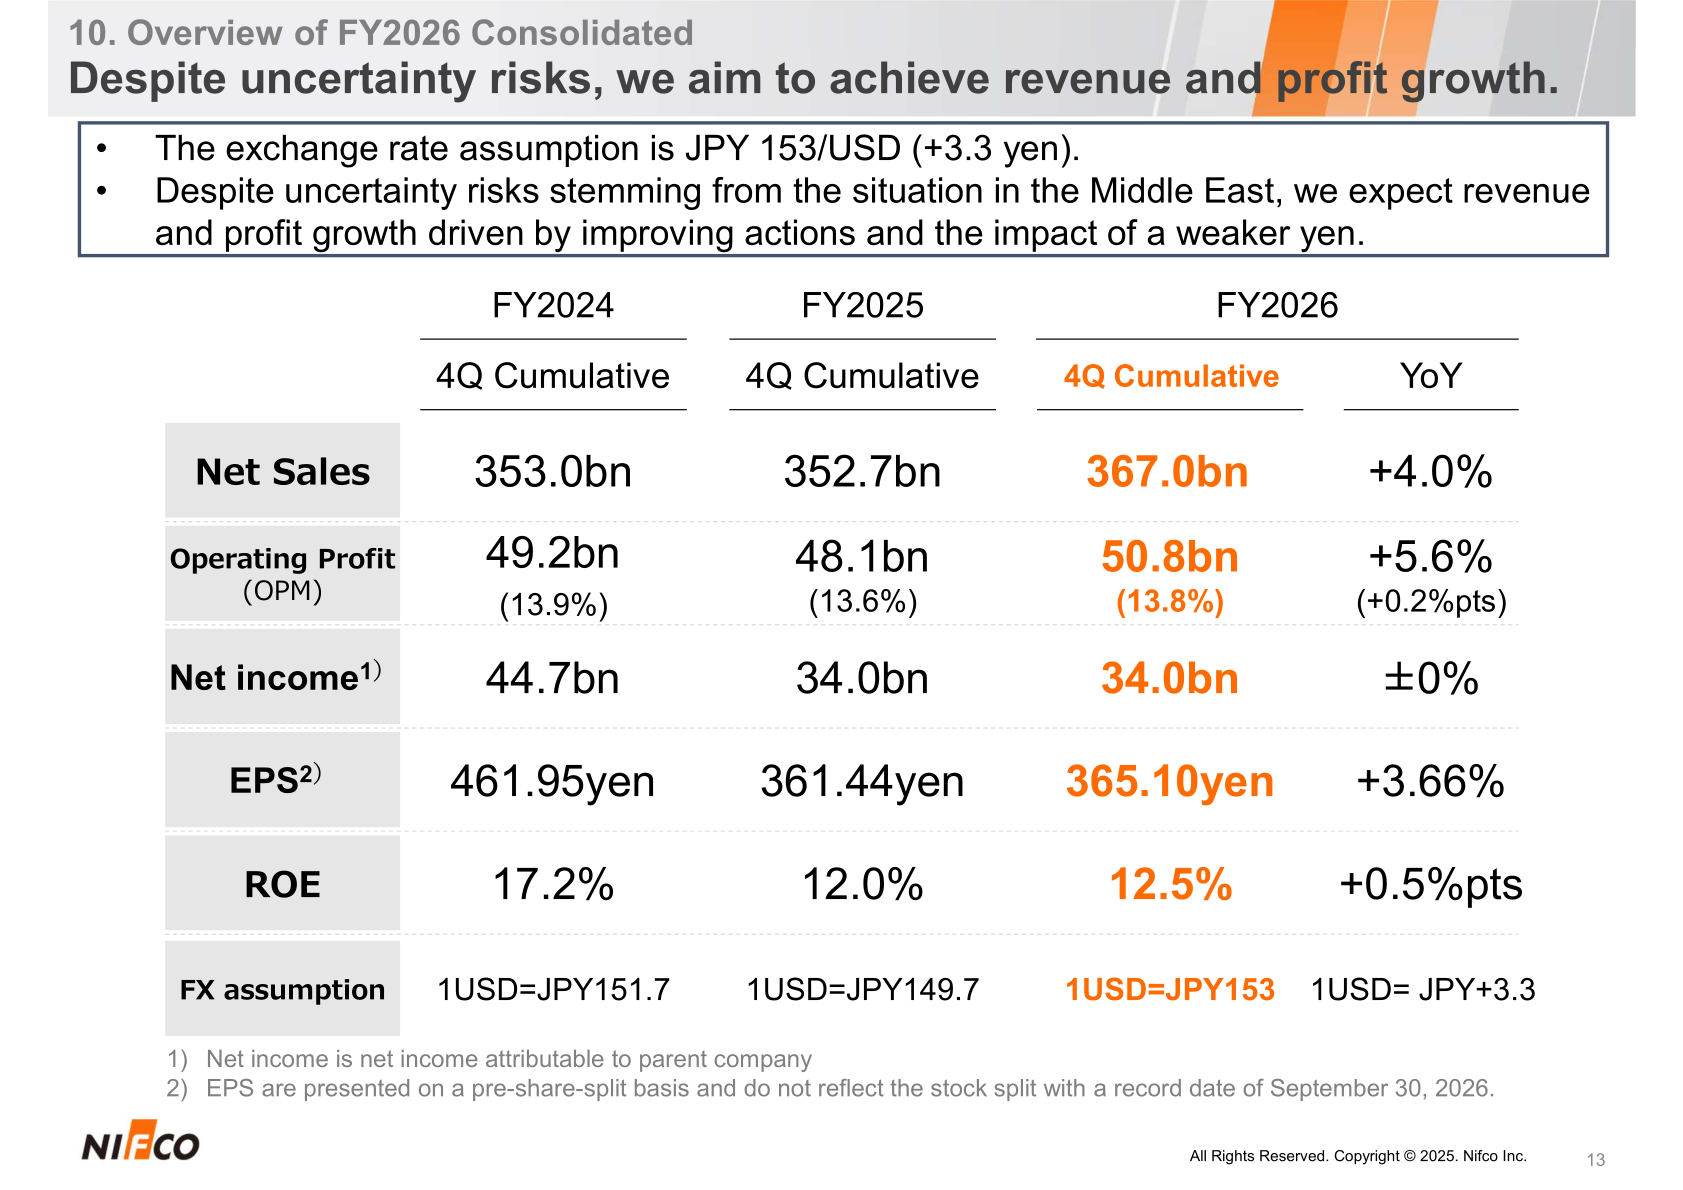
For FY2026, Nifco forecasts net sales of 367.0bn (+4.0%), operating profit of 50.8bn (+5.6%) with an operating margin of 13.8% (+0.2%pts), and net income of 34.0bn (±0%). EPS is forecast at 365.10yen (+3.66%, on a pre-share-split basis) and ROE at 12.5% (+0.5%pts). The exchange rate assumption is 1USD=JPY153, a change of JPY+3.3. The company says that despite uncertainty risks stemming from the situation in the Middle East, it expects revenue and profit growth driven by improving actions and the impact of a weaker yen.
| Item | FY2025 (4Q Cumulative) | FY2026 Forecast (4Q Cumulative) | YoY |
|---|---|---|---|
| Net Sales | 352.7bn | 367.0bn | +4.0% |
| Operating Profit (OPM) | 48.1bn (13.6%) | 50.8bn (13.8%) | +5.6% (+0.2%pts) |
| Net income (attributable to parent company) | 34.0bn | 34.0bn | ±0% |
| EPS (pre-share-split basis) | 361.44yen | 365.10yen | +3.66% |
| ROE | 12.0% | 12.5% | +0.5%pts |
| FX assumption | 1USD=JPY149.7 | 1USD=JPY153 | 1USD= JPY+3.3 |
Shareholder Returns
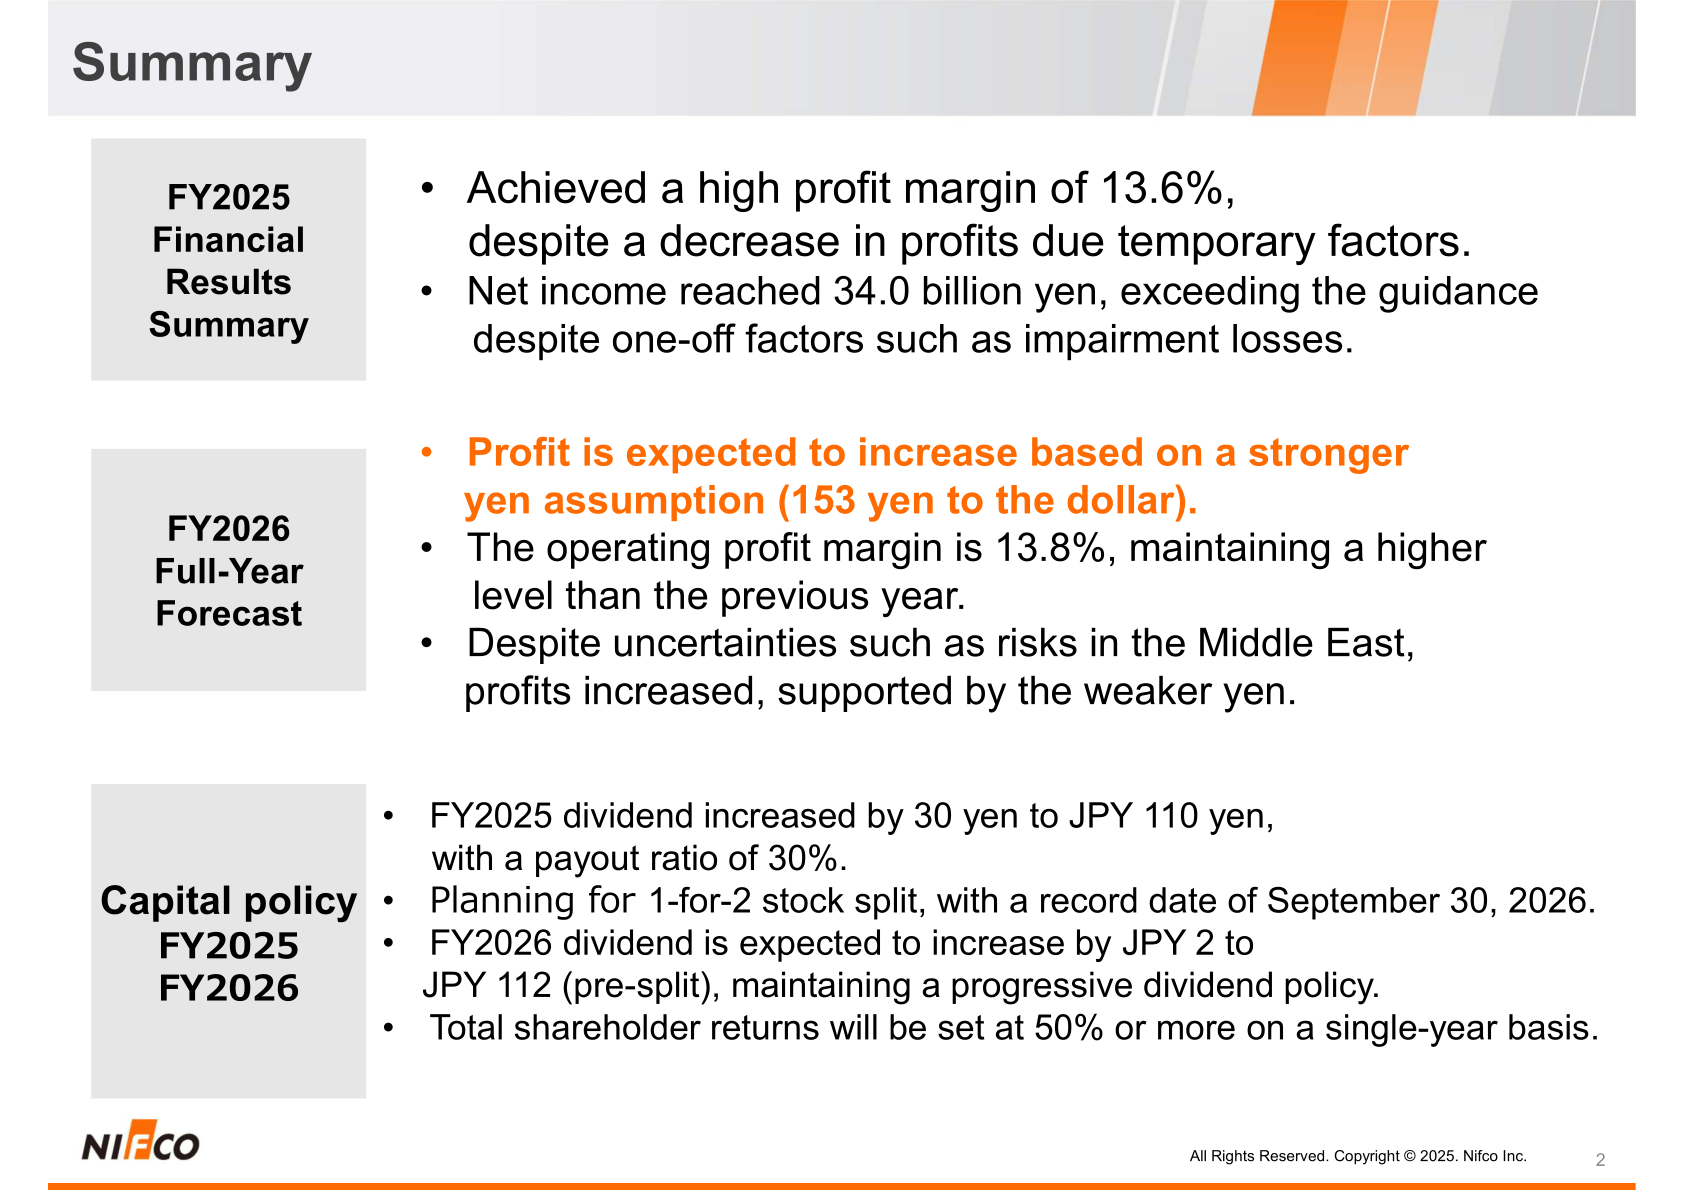
The FY2025 dividend was increased by 30 yen to JPY 110 yen, with a payout ratio of 30%. The company is planning a 1-for-2 stock split with a record date of September 30, 2026. The FY2026 dividend is expected to increase by JPY 2 to JPY 112 (pre-split), maintaining a progressive dividend policy. Total shareholder returns will be set at 50% or more on a single-year basis.
Topics: Installed Value per Vehicle
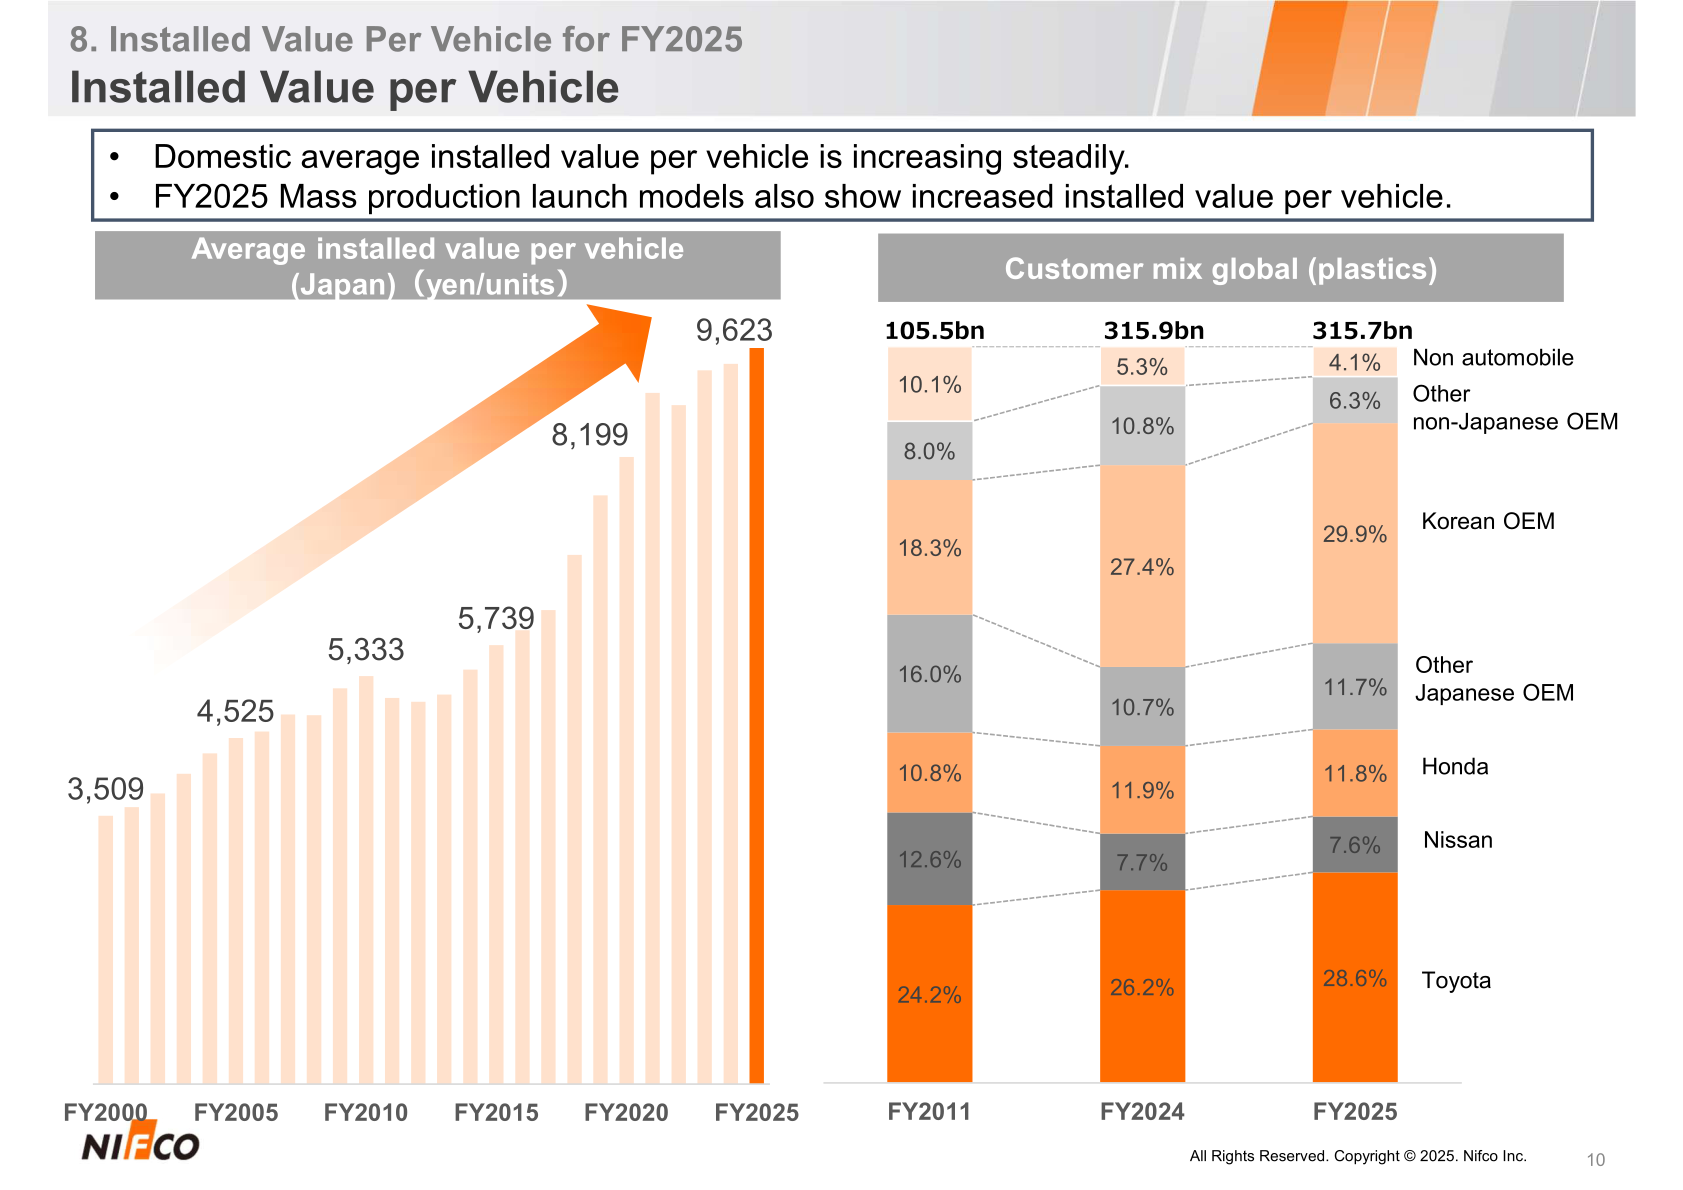
The company notes that the domestic average installed value per vehicle is increasing steadily, and that FY2025 mass production launch models also show an increased installed value per vehicle. The average installed value per vehicle in Japan was 3,509 yen/units in FY2000, 4,525 in FY2005, 5,333 in FY2010, 5,739 in FY2015, 8,199 in FY2020 and 9,623 in FY2025. In the global customer mix for plastics, on a base of 315.7bn in FY2025, Toyota accounted for 28.6%, Nissan 7.6%, Honda 11.8%, other Japanese OEM 11.7%, Korean OEM 29.9%, other non-Japanese OEM 6.3% and non-automobile 4.1%.
This article is an analysis based on publicly available information and is not a recommendation to buy or sell any specific securities. Investment decisions are your own responsibility.
![[Obayashi] Investors’ Guide 2026 — The Complete 24-Article Breakdown](https://japan-equity.com/wp-content/uploads/2026/07/hub_cover-1024x1024.png)
![[Obayashi] IR & SR Policy — Feeding Dialogue Back into Management](https://japan-equity.com/wp-content/uploads/2026/07/p32_sq-1024x1024.jpg)
![[Obayashi] Domestic Civil Engineering — Resilience Spending Supports 9.6% Margin](https://japan-equity.com/wp-content/uploads/2026/07/p11_sq-1024x1024.jpg)
![[Obayashi] Overseas Construction — Orders Reach ¥1.2tn](https://japan-equity.com/wp-content/uploads/2026/07/p15_sq-1024x1024.jpg)
![[Obayashi] Share Price & External Ratings — vs TOPIX, ESG Index Inclusion](https://japan-equity.com/wp-content/uploads/2026/07/p40_sq-1024x1024.jpg)
![[Construction] ¥75.5tn Investment, Shrinking Workforce — Big-5 Market Share](https://japan-equity.com/wp-content/uploads/2026/07/p12_sq-1024x1024.jpg)



![[Obayashi] Capital Policy & Shareholder Returns — ROE 10%+, DOE ~5%, ¥100bn Buyback](https://japan-equity.com/wp-content/uploads/2026/07/p27_sq-1024x1024.jpg)
![[Obayashi] Reducing Cross-Shareholdings — ¥285.2bn Sold in Five Years](https://japan-equity.com/wp-content/uploads/2026/07/p29_sq-1024x1024.jpg)
![[Obayashi] ¥750bn Investment Plan — ¥300bn to Development, ¥190bn to Tech/DX](https://japan-equity.com/wp-content/uploads/2026/07/p30_sq-1024x1024.jpg)
![[Obayashi] MTP2022 KPIs — Operating Profit ~2x Target, ROE 14.4%](https://japan-equity.com/wp-content/uploads/2026/07/p25_sq-1024x1024.jpg)
![[Obayashi] Cash Allocation — ¥420bn Investment CF Over Five Years](https://japan-equity.com/wp-content/uploads/2026/07/p26_sq-1024x1024.jpg)
![[Obayashi] Green Energy — 44 Plants, 344MW, and the Green Hydrogen Challenge](https://japan-equity.com/wp-content/uploads/2026/07/p21_sq-1024x1024.jpg)
![[Obayashi] Tackling the Labor Shortage — Robotics Construction®](https://japan-equity.com/wp-content/uploads/2026/07/p14_sq-1024x1024.jpg)
