
This article is based on publicly available IR materials and is not a recommendation to buy or sell any specific securities.
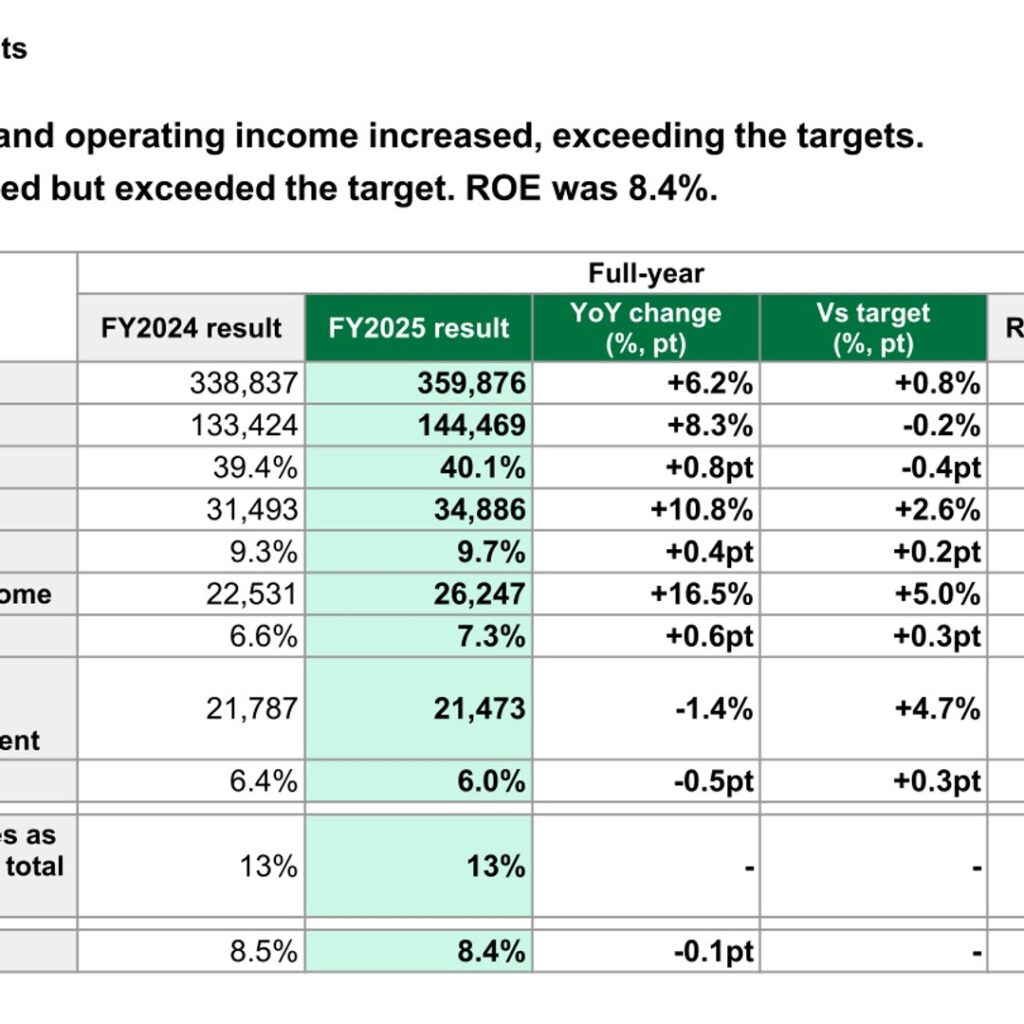
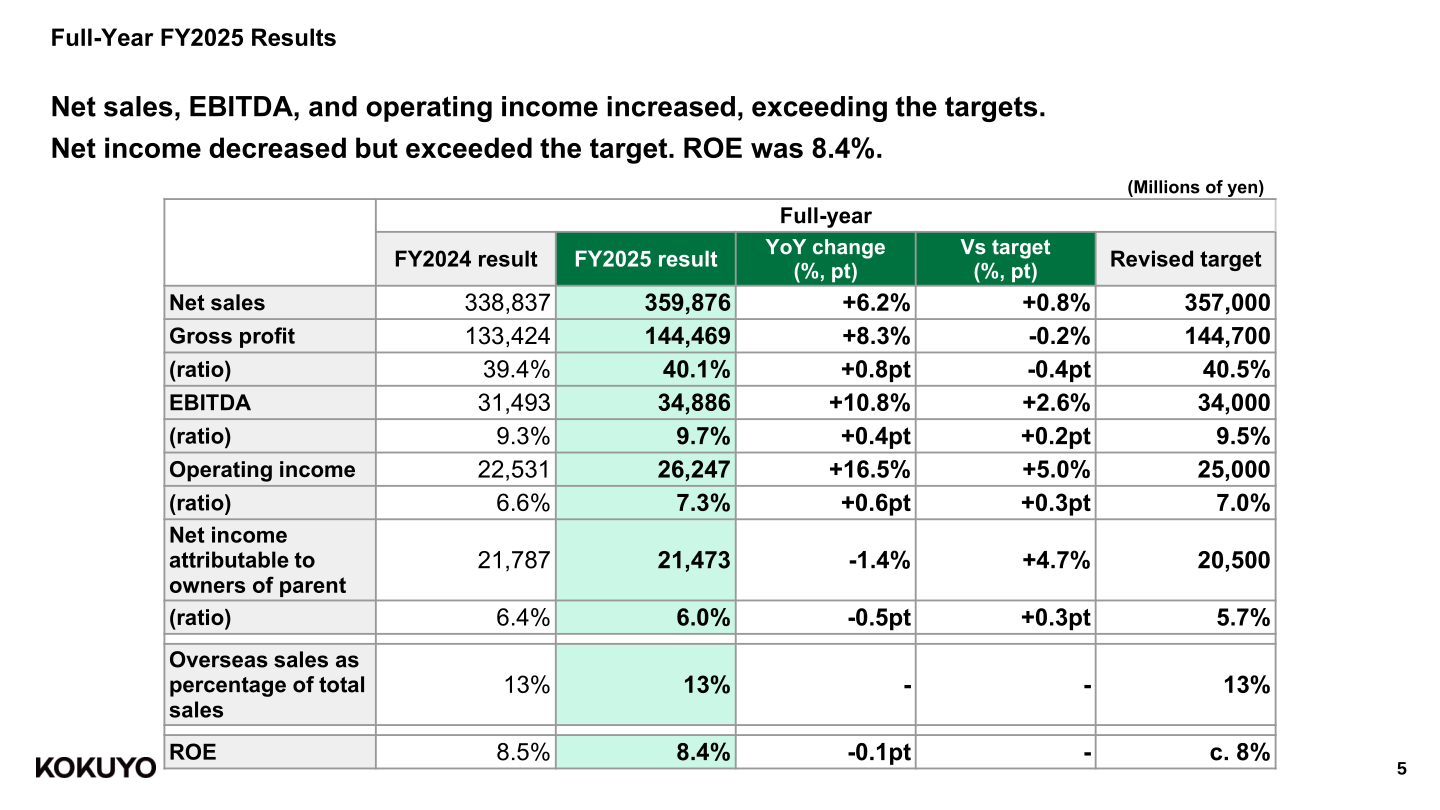
KOKUYO Co., Ltd. closed the fiscal year ended December 31, 2025 with net sales of 359,876 million yen (+6.2% year on year), EBITDA of 34,886 million yen (+10.8%) and operating income of 26,247 million yen (+16.5%), all above the company’s revised targets. Net income attributable to owners of parent was 21,473 million yen (-1.4%), which the company attributes to the spike in the previous year when a gain on sale of non-business assets was recorded; ROE was 8.4%. The year-end dividend was raised by ¥1.5 from the previous forecast, taking the full-year dividend to ¥24.5 and the consolidated payout ratio to 50%. For FY2026 the company targets net sales of 390,000 million yen and operating income of 27,000 million yen.
Consolidated Results (Full-Year Actual)
The materials state that net sales, EBITDA and operating income were significantly higher than in the previous year and exceeded the revised forecasts. The furniture business generally performed in line with expectations, while the business supply distribution and stationery businesses experienced sharp growth, with a key factor being a stoppage that occurred in a distribution and IT system within the mail-order office supplies industry. The gross profit ratio improved 0.8pt to 40.1%, and the operating income ratio rose 0.6pt to 7.3%. Overseas sales as a percentage of total sales were unchanged at 13%.
| Item (Millions of yen) | FY2024 result | FY2025 result | YoY change (%, pt) | Revised target | Vs target (%, pt) |
|---|---|---|---|---|---|
| Net sales | 338,837 | 359,876 | +6.2% | 357,000 | +0.8% |
| Gross profit | 133,424 | 144,469 | +8.3% | 144,700 | -0.2% |
| (ratio) | 39.4% | 40.1% | +0.8pt | 40.5% | -0.4pt |
| EBITDA | 31,493 | 34,886 | +10.8% | 34,000 | +2.6% |
| (ratio) | 9.3% | 9.7% | +0.4pt | 9.5% | +0.2pt |
| Operating income | 22,531 | 26,247 | +16.5% | 25,000 | +5.0% |
| (ratio) | 6.6% | 7.3% | +0.6pt | 7.0% | +0.3pt |
| Net income attributable to owners of parent | 21,787 | 21,473 | -1.4% | 20,500 | +4.7% |
| (ratio) | 6.4% | 6.0% | -0.5pt | 5.7% | +0.3pt |
| Overseas sales as percentage of total sales | 13% | 13% | – | 13% | – |
| ROE | 8.5% | 8.4% | -0.1pt | c. 8% | – |
On the reference-materials page the company also discloses ordinary income of 27,222 million yen for FY2025 against 24,410 million yen in FY2024, and SG&A expenses of 118,222 million yen (32.9% of sales) against 110,892 million yen (32.8%). Cash flows from operating activities were 14,369 million yen (-2,008 million yen year on year, with higher income taxes cited), cash flows from investing activities were -4,606 million yen (-16,860), and free cash flow was 9,763 million yen (-18,868). Cash flows from financing activities were -31,649 million yen, reflecting higher dividend payments and higher purchases of treasury shares. The end balance of cash and cash equivalents was 110,606 million yen versus 132,080 million yen a year earlier. Total assets stood at 355,048 million yen and the equity ratio was 70.9% (-0.9pt).
Segment Results
In the furniture business, net sales and operating income increased in Japan on the back of brisk office demand, although performance fell just shy of targets because some contracts were postponed; overseas, net sales increased with the inclusion of Indian acquisitions in consolidated results and growth in ASEAN, while operating income decreased with the China downturn. In business supply distribution, growth was led by Benri Net, a system that large companies use to manage purchases of indirect materials, and the company completed the acquisition of business operations from Fujitsu Coworco Limited. In the stationery business, net sales remained largely unchanged while operating income increased significantly on improved profitability, with the B2C channel capturing stationery demand that had shifted away from the office mail-order industry. In the interior retail business, net sales and operating income increased in each business, including the opening of a retail store in the NEWoMan Takanawa shopping complex.
| Segment (Millions of yen) | Metric | FY2024 result | FY2025 result | YoY change | % of target achieved | FY2026 target |
|---|---|---|---|---|---|---|
| Furniture business | Net sales | 162,415 | 172,196 | +6.0% | 97.8% | 191,000 |
| Furniture business | EBITDA | 27,243 | 28,952 | +6.3% | 94.9% | 34,600 |
| Furniture business | Operating income | 23,459 | 26,175 | +11.6% | 96.9% | 30,700 |
| Business supply distribution | Net sales | 98,935 | 108,369 | +9.5% | 104.2% | 118,300 |
| Business supply distribution | EBITDA | 6,236 | 7,029 | +12.7% | 115.2% | 6,600 |
| Business supply distribution | Operating income | 4,471 | 5,463 | +22.2% | 133.2% | 4,400 |
| Stationery business | Net sales | 83,575 | 83,572 | -0.0% | 101.9% | 84,900 |
| Stationery business | EBITDA | 8,061 | 9,061 | +12.4% | 101.8% | 9,300 |
| Stationery business | Operating income | 5,993 | 7,092 | +18.3% | 107.5% | 7,100 |
| Interior retail business | Net sales | 21,238 | 23,678 | +11.5% | 102.9% | 24,100 |
| Interior retail business | EBITDA | 871 | 1,028 | +18.0% | 102.8% | 1,300 |
| Interior retail business | Operating income | 521 | 718 | +37.7% | 89.8% | 1,050 |
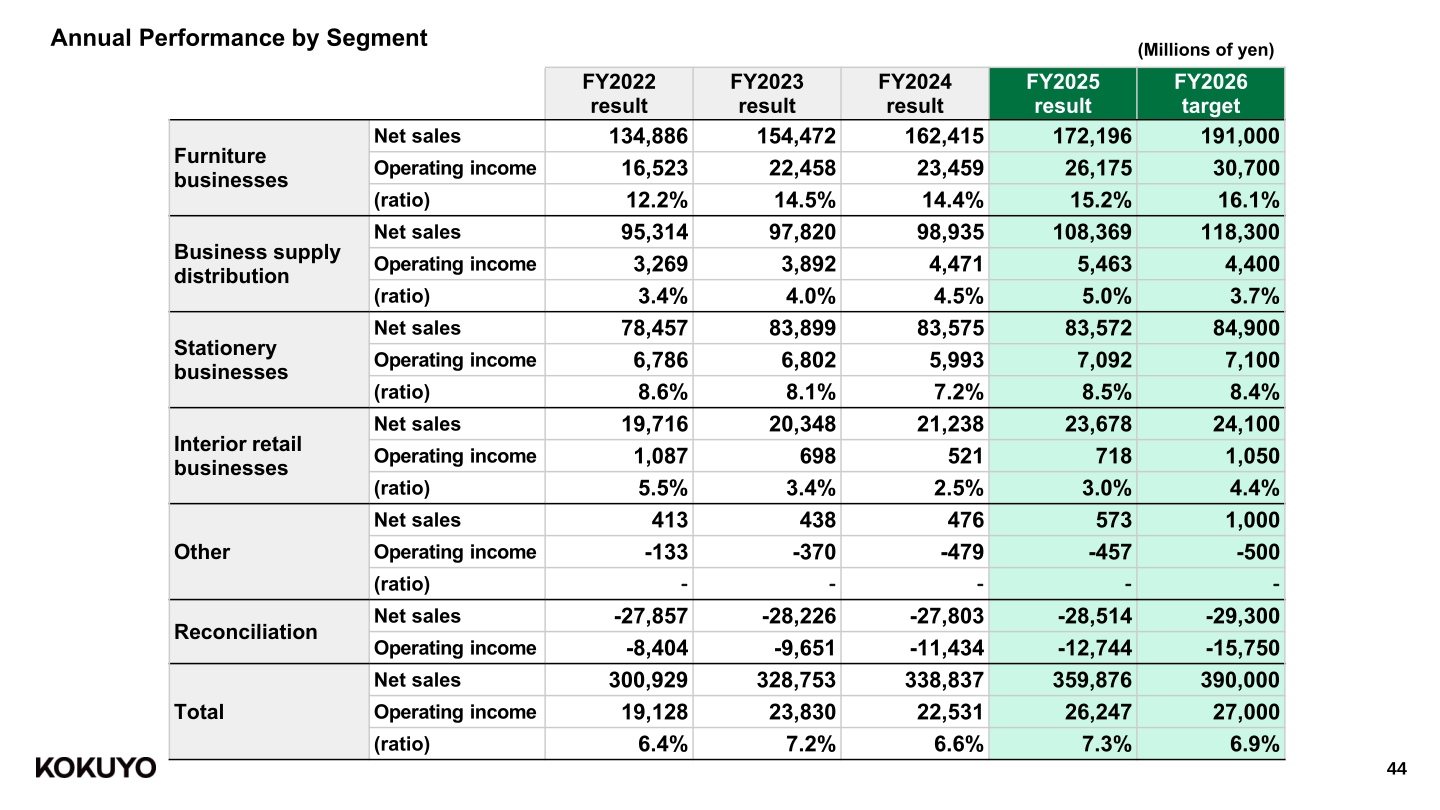
The annual performance-by-segment table also shows Other with net sales of 573 million yen (FY2024: 476 million yen) and an operating loss of 457 million yen (FY2024: loss of 479 million yen), and Reconciliation of -28,514 million yen in net sales and -12,744 million yen in operating income (FY2024: -27,803 million yen and -11,434 million yen).
FY2026 Targets
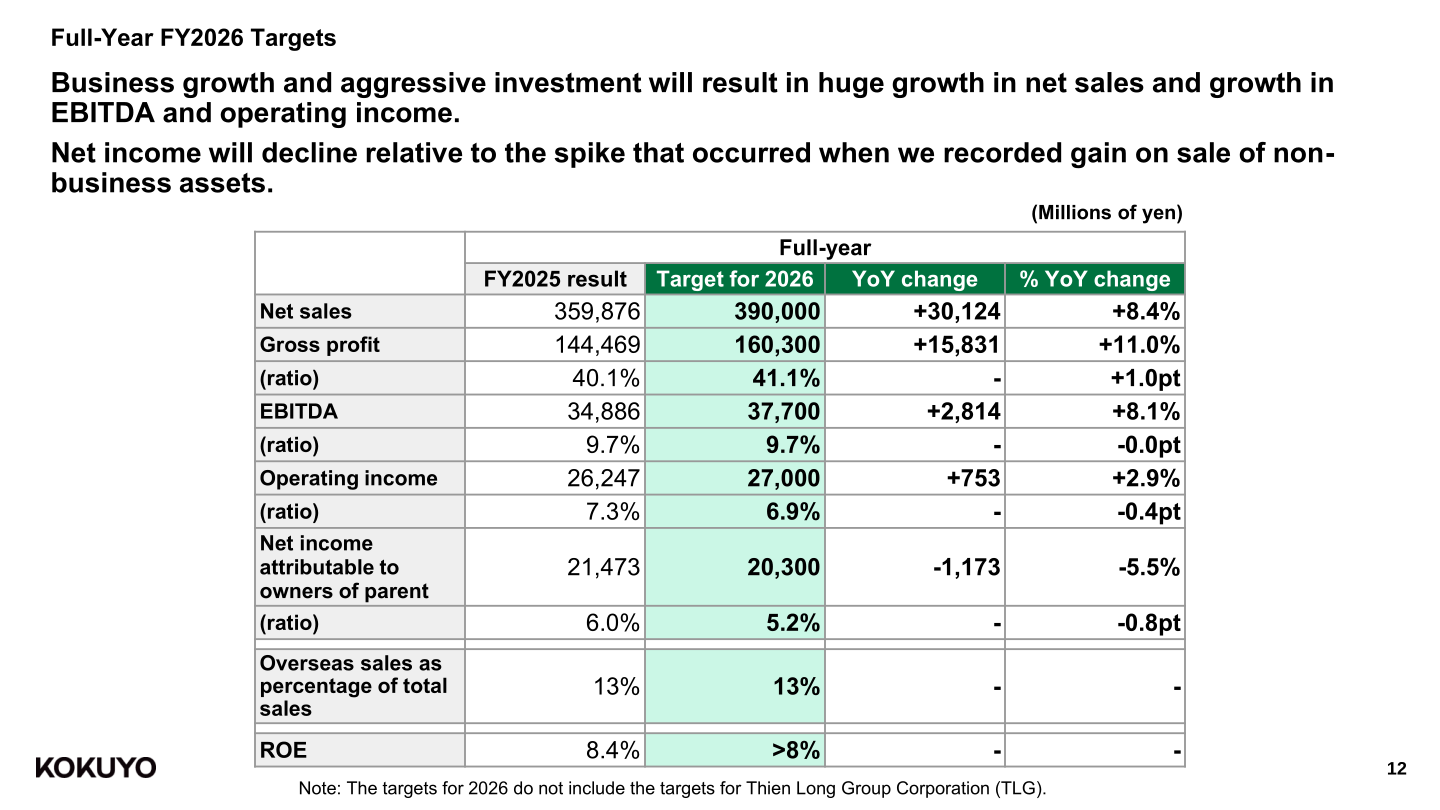
For the fiscal year ending December 31, 2026, KOKUYO targets net sales of 390,000 million yen (+8.4%), gross profit of 160,300 million yen (+11.0%), EBITDA of 37,700 million yen (+8.1%) and operating income of 27,000 million yen (+2.9%). Net income attributable to owners of parent is targeted at 20,300 million yen (-5.5%), which the company again links to the previous year’s gain on sale of non-business assets. ROE is targeted at more than 8% and overseas sales as a percentage of total sales at 13%. The materials note that the targets for 2026 do not include the targets for Thien Long Group Corporation (TLG). The company expects the SG&A ratio to sales to increase because of strategic expenditures for driving its medium- and long-term strategies, more than offset by a higher gross profit rate.
| Item (Millions of yen) | FY2025 result | Target for 2026 | YoY change | % YoY change |
|---|---|---|---|---|
| Net sales | 359,876 | 390,000 | +30,124 | +8.4% |
| Gross profit | 144,469 | 160,300 | +15,831 | +11.0% |
| (ratio) | 40.1% | 41.1% | – | +1.0pt |
| EBITDA | 34,886 | 37,700 | +2,814 | +8.1% |
| (ratio) | 9.7% | 9.7% | – | -0.0pt |
| Operating income | 26,247 | 27,000 | +753 | +2.9% |
| (ratio) | 7.3% | 6.9% | – | -0.4pt |
| Net income attributable to owners of parent | 21,473 | 20,300 | -1,173 | -5.5% |
| (ratio) | 6.0% | 5.2% | – | -0.8pt |
| Overseas sales as percentage of total sales | 13% | 13% | – | – |
| ROE | 8.4% | >8% | – | – |
Shareholder Returns
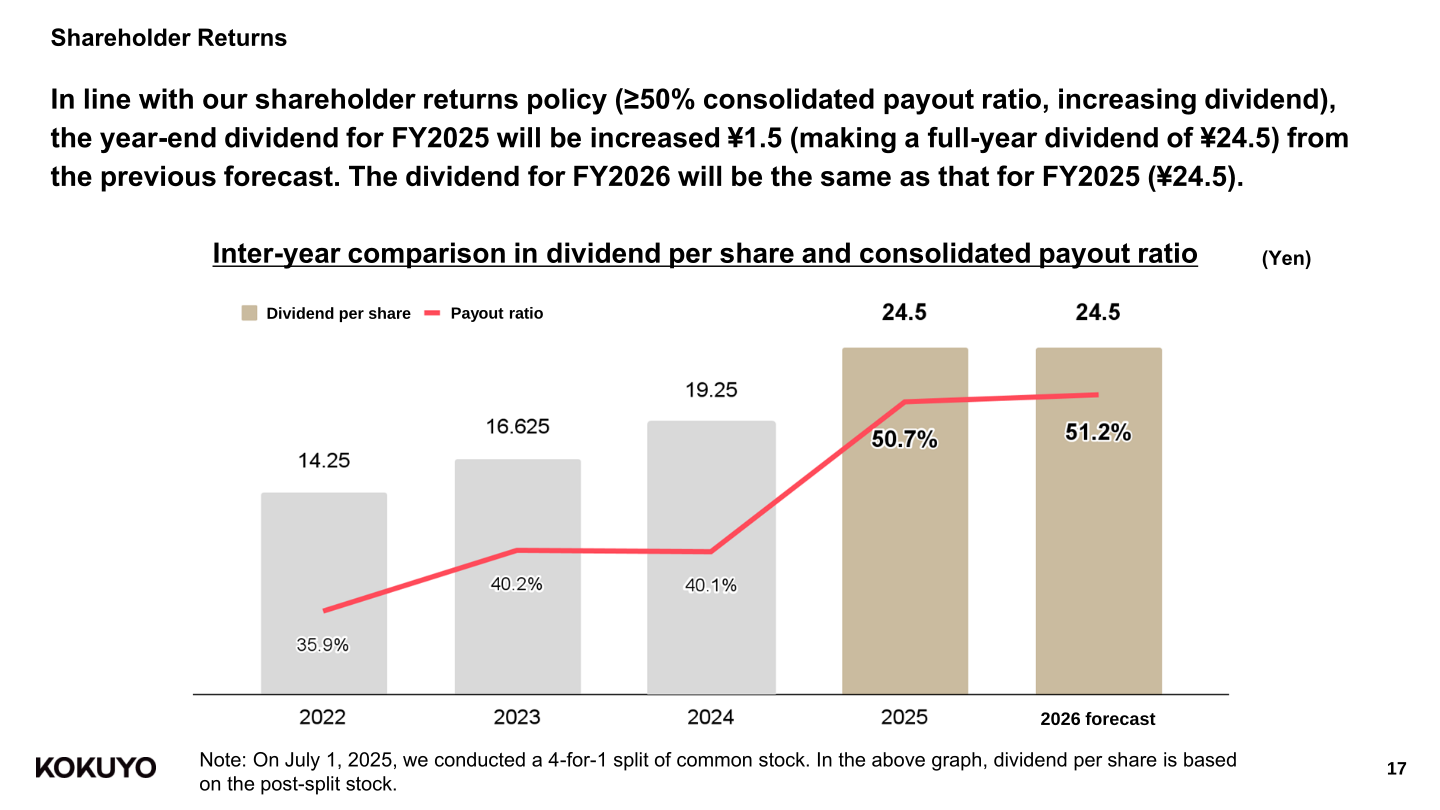
In line with its shareholder returns policy of a consolidated payout ratio of 50% or more and an increasing dividend, KOKUYO raised the year-end dividend for FY2025 by ¥1.5 from the previous forecast, making a full-year dividend of ¥24.5. The dividend for FY2026 will be the same as that for FY2025 at ¥24.5, which the company says aligns with its 50% benchmark for consolidated payout ratio and its increasing-dividend policy. The materials note that on July 1, 2025 the company conducted a 4-for-1 split of common stock, and that dividend per share in the presentation graph is based on the post-split stock. Under its capital allocation disclosure, the company reports purchases of treasury shares of ¥20.0 billion and dividends paid of ¥9.5 billion in the period, and states that in 2026 it will further reduce cash and cash equivalents by investing in excess of OCF and delivering shareholder returns.
| Item | FY2025 | FY2026 |
|---|---|---|
| Dividend per share (full year) | ¥24.5 | ¥24.5 |
| Consolidated payout ratio | 50% | 50% benchmark |
| Purchase of treasury shares (FY2025 outflow) | ¥20.0 billion | – |
| Dividends paid (FY2025 outflow) | ¥9.5 billion | – |
Progress in the Fourth Medium-Term Plan
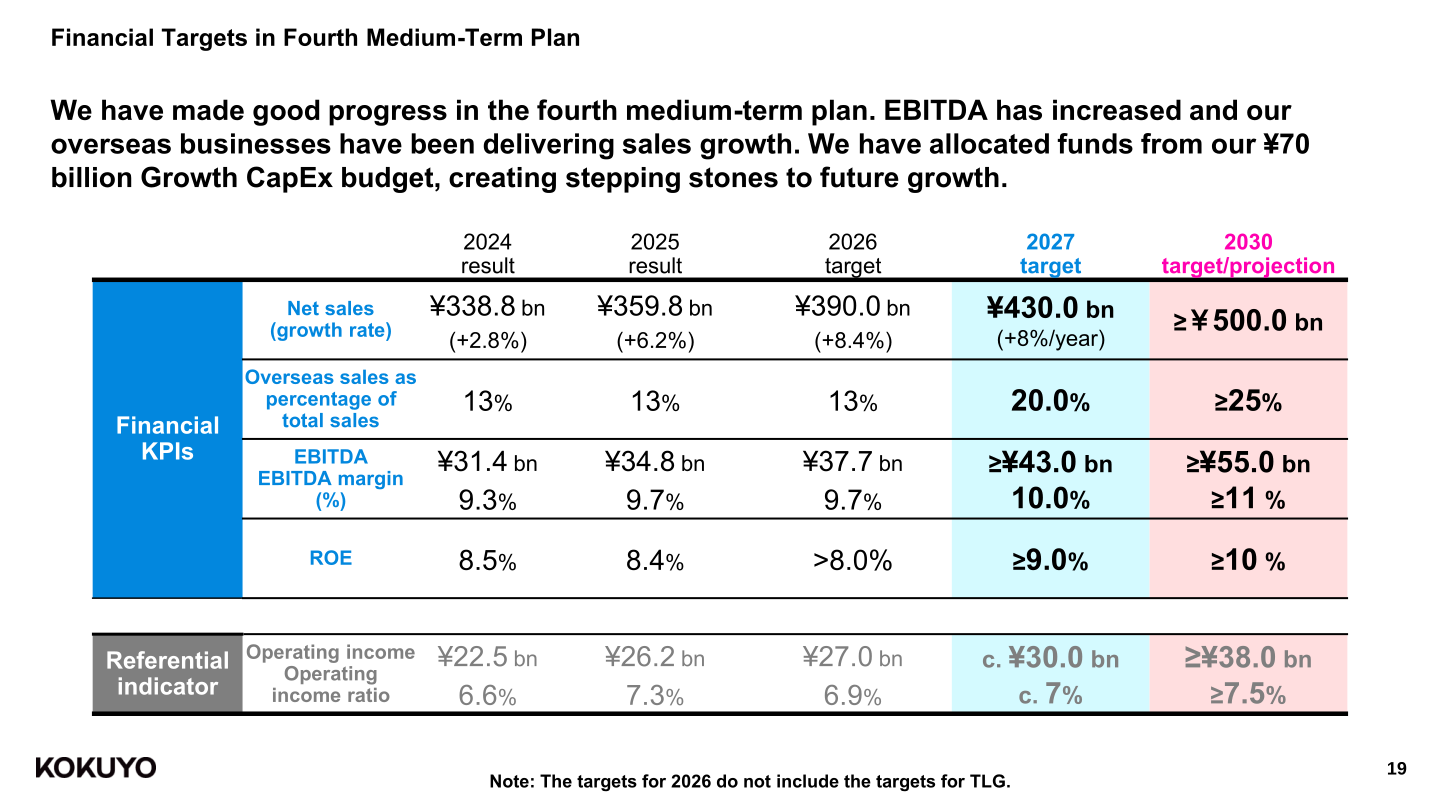
KOKUYO says it made good progress in the first year of its fourth medium-term plan, with EBITDA increasing and steady revenue growth in its overseas businesses. The plan’s financial KPIs call for net sales of ¥430.0 bn in 2027 (growth of about 8% per year) and ¥500.0 bn or more by 2030, an overseas sales ratio of 20.0% in 2027 and 25% or more by 2030, EBITDA of ¥43.0 bn or more with a 10.0% margin in 2027 and ¥55.0 bn or more with a margin of 11% or more by 2030, and ROE of 9.0% or more in 2027 and 10% or more by 2030. Operating income is shown as a referential indicator at approximately ¥30.0 bn in 2027 and ¥38.0 bn or more by 2030.
| Financial KPI | 2024 result | 2025 result | 2026 target | 2027 target | 2030 target/projection |
|---|---|---|---|---|---|
| Net sales (growth rate) | ¥338.8 bn (+2.8%) | ¥359.8 bn (+6.2%) | ¥390.0 bn (+8.4%) | ¥430.0 bn (+8%/year) | ≥¥500.0 bn |
| Overseas sales as percentage of total sales | 13% | 13% | 13% | 20.0% | ≥25% |
| EBITDA / EBITDA margin | ¥31.4 bn / 9.3% | ¥34.8 bn / 9.7% | ¥37.7 bn / 9.7% | ≥¥43.0 bn / 10.0% | ≥¥55.0 bn / ≥11% |
| ROE | 8.5% | 8.4% | >8.0% | ≥9.0% | ≥10% |
| Operating income / ratio (referential) | ¥22.5 bn / 6.6% | ¥26.2 bn / 7.3% | ¥27.0 bn / 6.9% | c. ¥30.0 bn / c. 7% | ≥¥38.0 bn / ≥7.5% |
The 2025–2027 Growth CapEx budget is ¥70.0 bn, allocated to PP&E investments in Japan (¥35.0 bn), system investments in Japan (¥10.0 bn), investments in existing overseas businesses (¥5.0 bn) and M&A (¥20.0 bn), with the company noting that the M&A budget may be exceeded depending on prospective deals. Disclosed M&A actions include the acquisition of Thien Long Group Corporation at a total purchase price expected to be approximately ¥27.6 billion, with the transaction expected to be completed in November 2026; the acquisition and integration of six Japanese sales companies at a total purchase price expected to be approximately ¥4.0 billion, with the integration scheduled for January 2027 under KOKUYO Marketing Japan; and the acquisition of Kokuyo Workplace India, for which the price is not disclosed. On financial and capital strategies, the company states that cross-held shares now account for less than 5% of consolidated net assets, and that its estimated cost of equity has risen to 7–8% from 6–7% in the previous year.
This article is an analysis based on publicly available information and is not a recommendation to buy or sell any specific securities. Investment decisions are your own responsibility.
![[Obayashi] Investors’ Guide 2026 — The Complete 24-Article Breakdown](https://japan-equity.com/wp-content/uploads/2026/07/hub_cover-1024x1024.png)
![[Obayashi] IR & SR Policy — Feeding Dialogue Back into Management](https://japan-equity.com/wp-content/uploads/2026/07/p32_sq-1024x1024.jpg)
![[Obayashi] Real Estate Development — 18.7% Margin, ¥287.7bn Unrealized Gains](https://japan-equity.com/wp-content/uploads/2026/07/p20_sq-1024x1024.jpg)
![[Obayashi] Domestic Civil Engineering — Resilience Spending Supports 9.6% Margin](https://japan-equity.com/wp-content/uploads/2026/07/p11_sq-1024x1024.jpg)
![[Obayashi] Share Price & External Ratings — vs TOPIX, ESG Index Inclusion](https://japan-equity.com/wp-content/uploads/2026/07/p40_sq-1024x1024.jpg)
![[Construction] ¥75.5tn Investment, Shrinking Workforce — Big-5 Market Share](https://japan-equity.com/wp-content/uploads/2026/07/p12_sq-1024x1024.jpg)



![[Obayashi] Capital Policy & Shareholder Returns — ROE 10%+, DOE ~5%, ¥100bn Buyback](https://japan-equity.com/wp-content/uploads/2026/07/p27_sq-1024x1024.jpg)
![[Obayashi] Reducing Cross-Shareholdings — ¥285.2bn Sold in Five Years](https://japan-equity.com/wp-content/uploads/2026/07/p29_sq-1024x1024.jpg)
![[Obayashi] ¥750bn Investment Plan — ¥300bn to Development, ¥190bn to Tech/DX](https://japan-equity.com/wp-content/uploads/2026/07/p30_sq-1024x1024.jpg)
![[Obayashi] MTP2022 KPIs — Operating Profit ~2x Target, ROE 14.4%](https://japan-equity.com/wp-content/uploads/2026/07/p25_sq-1024x1024.jpg)
![[Obayashi] Cash Allocation — ¥420bn Investment CF Over Five Years](https://japan-equity.com/wp-content/uploads/2026/07/p26_sq-1024x1024.jpg)
![[Obayashi] Green Energy — 44 Plants, 344MW, and the Green Hydrogen Challenge](https://japan-equity.com/wp-content/uploads/2026/07/p21_sq-1024x1024.jpg)
![[Obayashi] Tackling the Labor Shortage — Robotics Construction®](https://japan-equity.com/wp-content/uploads/2026/07/p14_sq-1024x1024.jpg)
