
This article is based on publicly available IR materials and is not a recommendation to buy or sell any specific securities.
Zojirushi Corporation reported consolidated net sales of 91,151 million yen (up 3,929 million yen, +4.5% year on year) and operating profit of 7,436 million yen (up 1,481 million yen, +24.9% year on year) for the fiscal year ended November 20, 2025. Note: Zojirushi’s fiscal year ends November 20; figures below are labeled ‘FY 11/2025’ as in the company’s own materials, corresponding to the site’s FY2025 convention.
Consolidated Results (Full-Year Actual)
Domestic net sales were strong, while overseas net sales performed well in Taiwan but decreased significantly in China compared with the previous year. Efforts to pass on higher import costs due to the depreciation of the yen resulted in higher profits. Domestic net sales rose 5,640 million yen year on year, while overseas net sales fell 1,711 million yen year on year. Profit attributable to owners of parent decreased in a reactionary decline from the gain on sale of non-current assets recorded in the previous fiscal year.
| Item | FY ended Nov 20, 2025 | FY ended Nov 20, 2024 | YoY Change (Amount / Rate) |
|---|---|---|---|
| Net sales | 91,151 | 87,221 | +3,929 / +4.5% |
| Gross profit | 30,407 (33.4%) | 28,301 (32.4%) | +2,105 / +7.4% |
| Selling, general and administrative expenses | 22,971 (25.2%) | 22,346 (25.6%) | +624 / +2.8% |
| Operating profit | 7,436 (8.2%) | 5,955 (6.8%) | +1,481 / +24.9% |
| Ordinary profit | 8,300 (9.1%) | 7,405 (8.5%) | +894 / +12.1% |
| Profit attributable to owners of parent | 5,980 (6.6%) | 6,462 (7.4%) | (482) / (7.5)% |
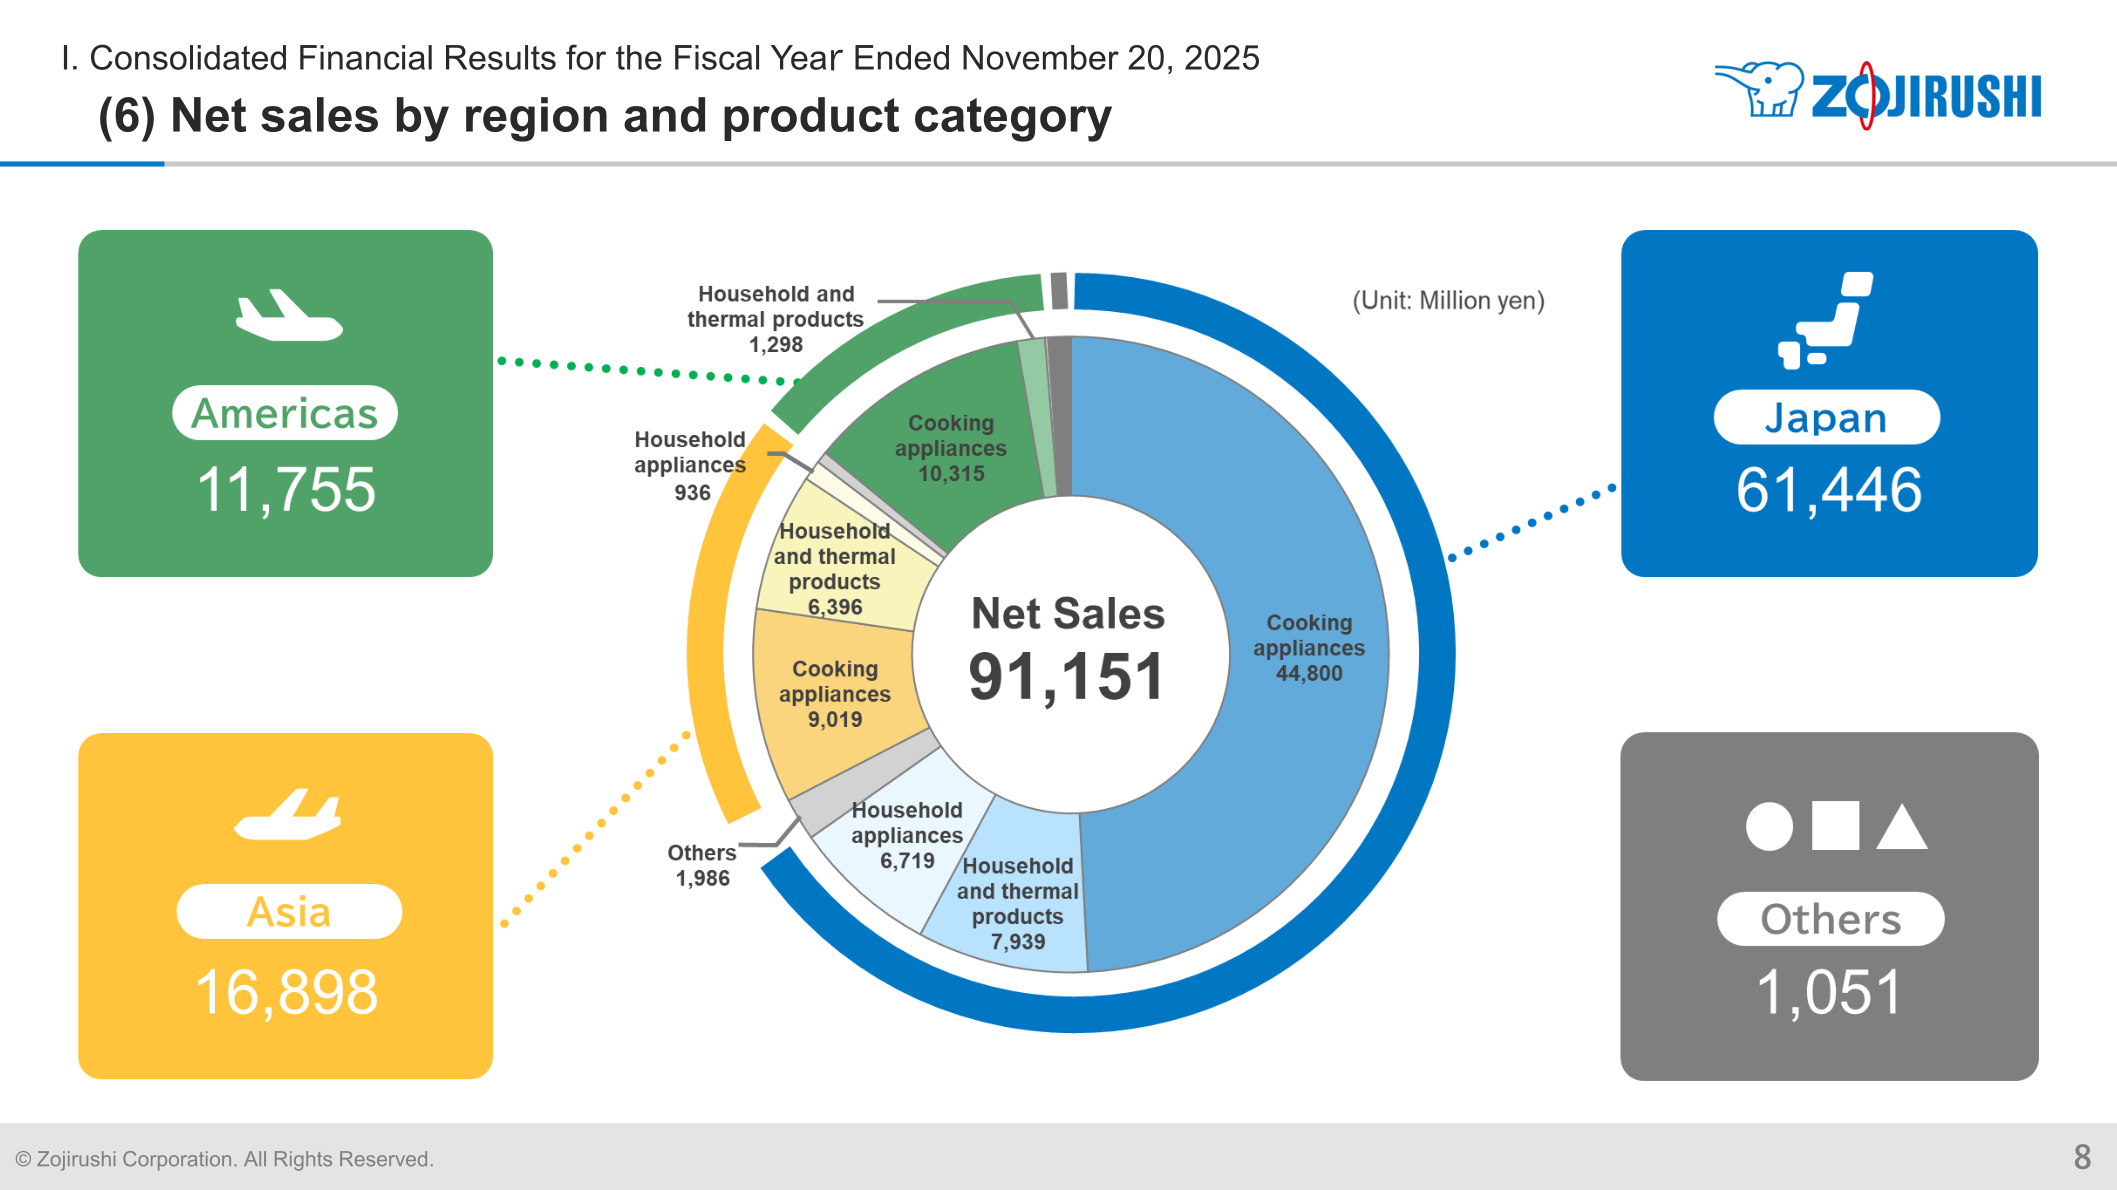
Unit: Million yen; figures in parentheses next to profit lines are composition ratios. By region and product category for FY ended November 20, 2025 (unit: million yen): Japan net sales 61,446 (composition 67.4%, YoY +10.1%) with operating profit 4,079 (profit ratio 6.6%); Asia net sales 16,898 (of which China 5,426; YoY (10.2)%) with operating profit 1,739; Americas net sales 11,755 (YoY +0.5%) with operating profit 1,513; Others net sales 1,051 (YoY +18.4%) with operating profit 104. Overseas subtotal net sales were 29,704 (composition 32.6%, YoY (5.4)%) with operating profit 3,357 (composition 45.1%, YoY (14.3)%).
| Region | Net Sales (FY11/2025) | YoY Change Rate | Operating Profit (FY11/2025) | YoY Change Rate |
|---|---|---|---|---|
| Japan | 61,446 | 10.1% | 4,079 | 100.1% |
| Asia (of which, China: 5,426) | 16,898 | (10.2)% | 1,739 | (14.4)% |
| Americas | 11,755 | 0.5% | 1,513 | (16.9)% |
| Others | 1,051 | 18.4% | 104 | 65.5% |
| Overseas Subtotal | 29,704 | (5.4)% | 3,357 | (14.3)% |
| Total | 91,151 | 4.5% | 7,436 | 24.9% |
Net Sales by Product Category
By product category for FY ended November 20, 2025 (unit: million yen, % of total, YoY change): Total of cooking appliances 64,384 (70.6% of net sales, +5.2%), of which rice cooking 42,687 (46.8%, +4.0%), water boiling 7,673 (8.4%, (2.3)%), electric cooking 10,552 (11.6%, +4.8%), and microwave cooking 3,470 (3.8%, +55.1%). Total of household and thermal products was 16,430 (18.0%, (9.4)%), of which stainless-steel vacuum bottles were 14,666 (16.1%, (10.6)%). Total of household appliances was 7,656 (8.4%, +36.7%), of which air-conditioning, cooling, and heating (humidifiers/air cleaners) was 6,537 (7.2%, +38.3%). Others were 2,680 (2.9%, +16.6%).
| Product Category | FY11/2025 (Million yen) | Composition | YoY Change Rate |
|---|---|---|---|
| Total of cooking appliances | 64,384 | 70.6% | 5.2% |
| Rice cooking | 42,687 | 46.8% | 4.0% |
| Water boiling | 7,673 | 8.4% | (2.3)% |
| Electric cooking | 10,552 | 11.6% | 4.8% |
| Microwave cooking | 3,470 | 3.8% | 55.1% |
| Total of household and thermal products | 16,430 | 18.0% | (9.4)% |
| Stainless-steel vacuum bottles | 14,666 | 16.1% | (10.6)% |
| Total of household appliances | 7,656 | 8.4% | 36.7% |
| Air-conditioning, cooling, and heating | 6,537 | 7.2% | 38.3% |
| Others | 2,680 | 2.9% | 16.6% |
Balance Sheet and Cash Flow
Total assets stood at 118,332 million yen as of November 20, 2025, up 3,562 million yen from November 20, 2024, with current assets of 85,366 million yen and non-current assets of 32,965 million yen. Total liabilities were 28,742 million yen and total net assets were 89,589 million yen. Cash flows from operating activities were 9,930 million yen (up 4,420 million yen year on year), cash flows from investing activities were (2,140) million yen, and cash flows from financing activities were (9,089) million yen, which included dividends paid of 3,474 million yen and acquisition of treasury shares of 3,400 million yen.
| Item (as of Nov 20) | 2025 | 2024 | Change |
|---|---|---|---|
| Current assets | 85,366 | 84,644 | 722 |
| Non-current assets | 32,965 | 30,125 | 2,840 |
| Total assets | 118,332 | 114,769 | 3,562 |
| Total liabilities | 28,742 | 27,464 | 1,277 |
| Total net assets | 89,589 | 87,305 | 2,284 |
FY2026 Forecast
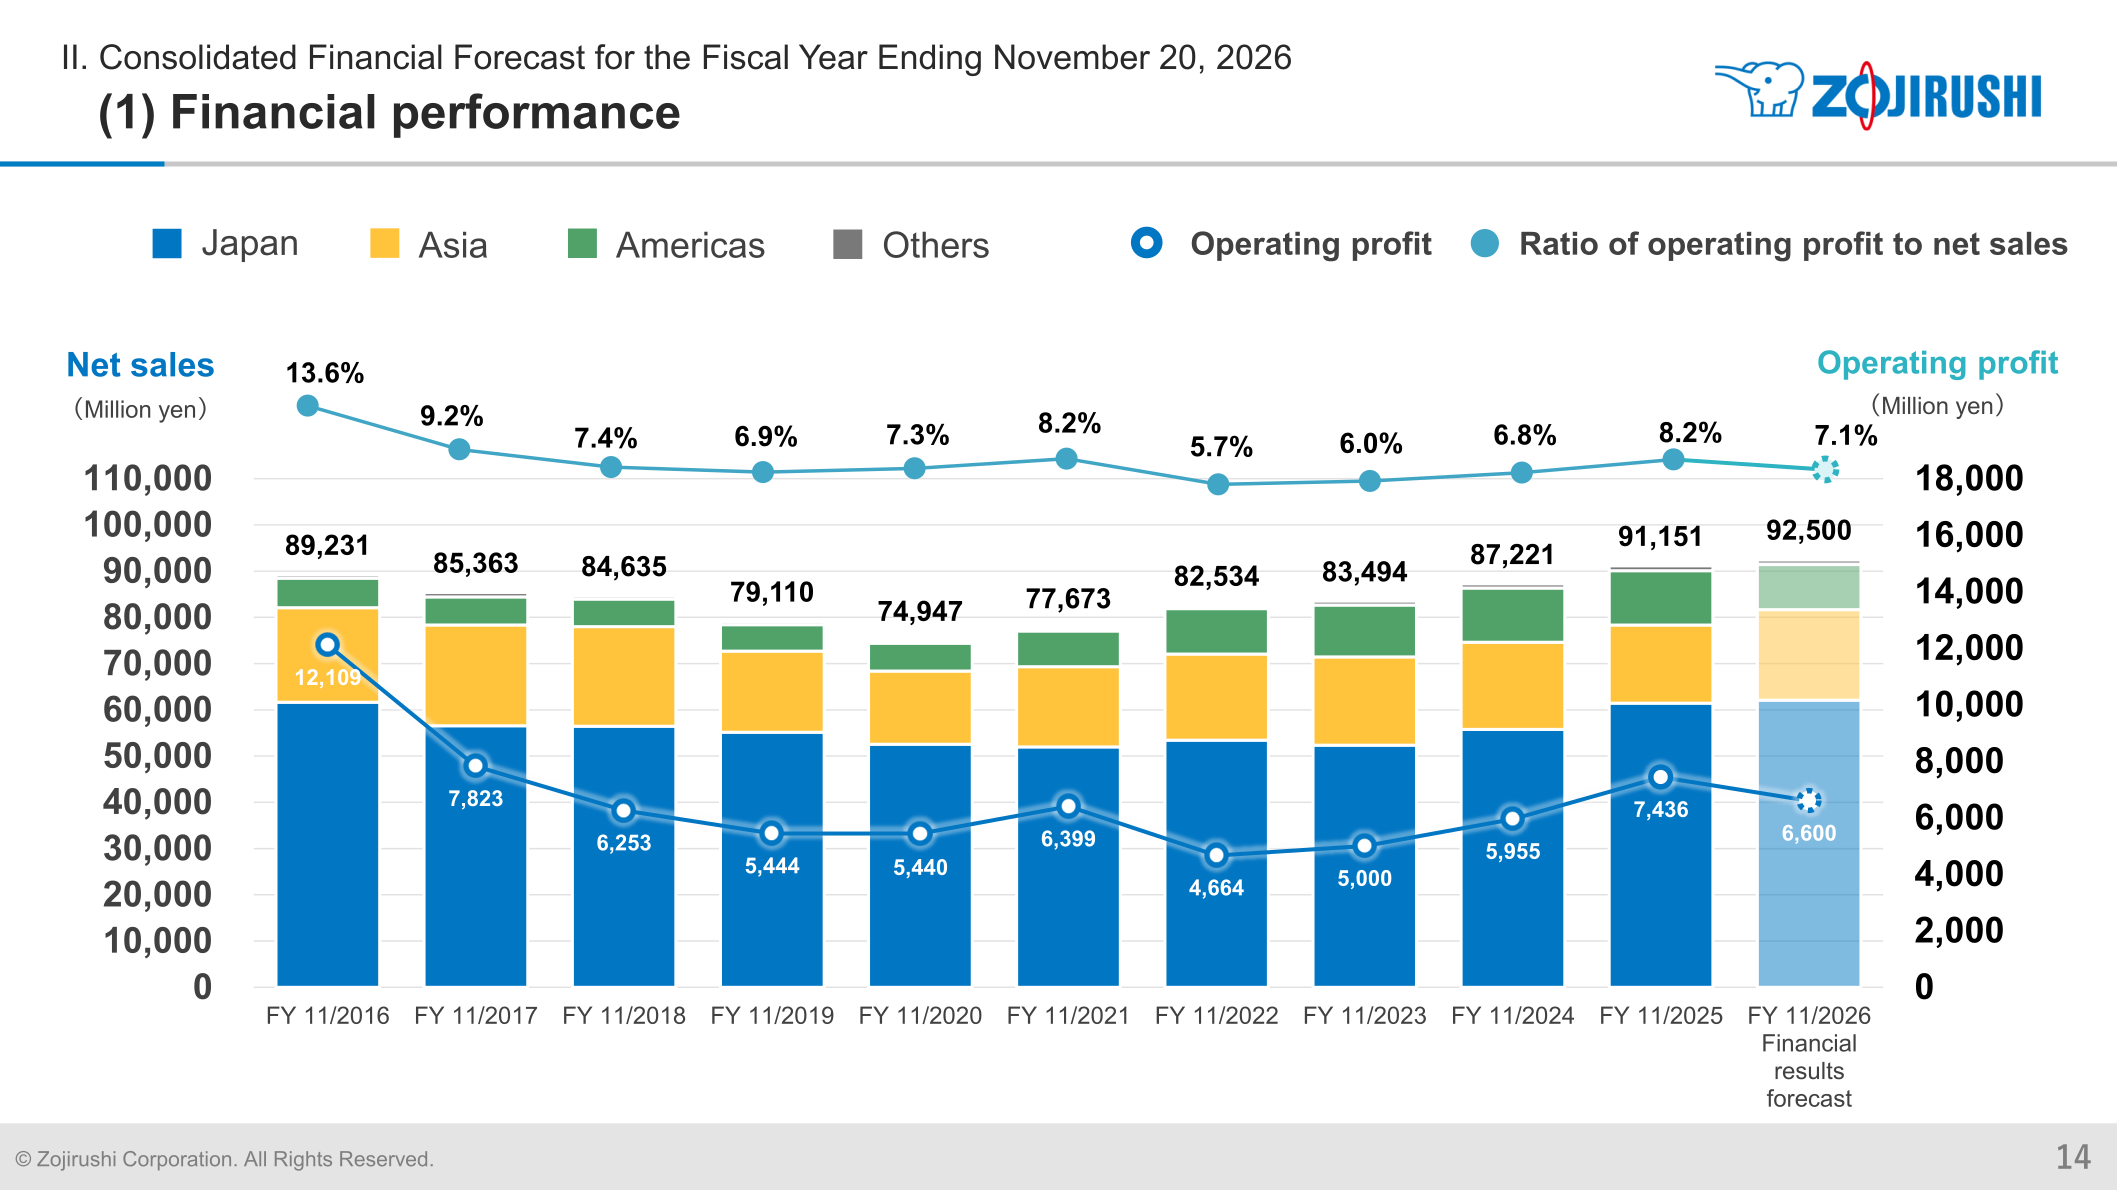
For the fiscal year ending November 20, 2026, Zojirushi forecasts net sales of 92,500 million yen (up 1,348 million yen, +1.5% year on year) and operating profit of 6,600 million yen (down 836 million yen, (11.2)% year on year), with ordinary profit of 7,100 million yen ((14.5)%) and profit attributable to owners of parent of 4,800 million yen ((19.7)%). The forecast assumes an exchange rate of 1 USD = 145 yen, versus 149 yen in FY11/2025. Planned capital investment is 7,332 million yen, up sharply (+283.9%) from 1,910 million yen in FY11/2025.
| Item | FY2026 Forecast | FY11/2025 (Actual) | YoY Change (Amount / Rate) |
|---|---|---|---|
| Net sales | 92,500 (100.0%) | 91,151 (100.0%) | +1,348 / +1.5% |
| Gross profit | 30,900 (33.4%) | 30,407 (33.4%) | +492 / +1.6% |
| Selling, general and administrative expenses | 24,300 (26.3%) | 22,971 (25.2%) | +1,328 / +5.8% |
| Operating profit | 6,600 (7.1%) | 7,436 (8.2%) | (836) / (11.2)% |
| Ordinary profit | 7,100 (7.7%) | 8,300 (9.1%) | (1,200) / (14.5)% |
| Profit attributable to owners of parent | 4,800 (5.2%) | 5,980 (6.6%) | (1,180) / (19.7)% |
| Capital investment | 7,332 | 1,910 | +5,422 / +283.9% |
| Exchange rate (1 USD) | ¥145 | ¥149 | (¥4) |
Shareholder Returns
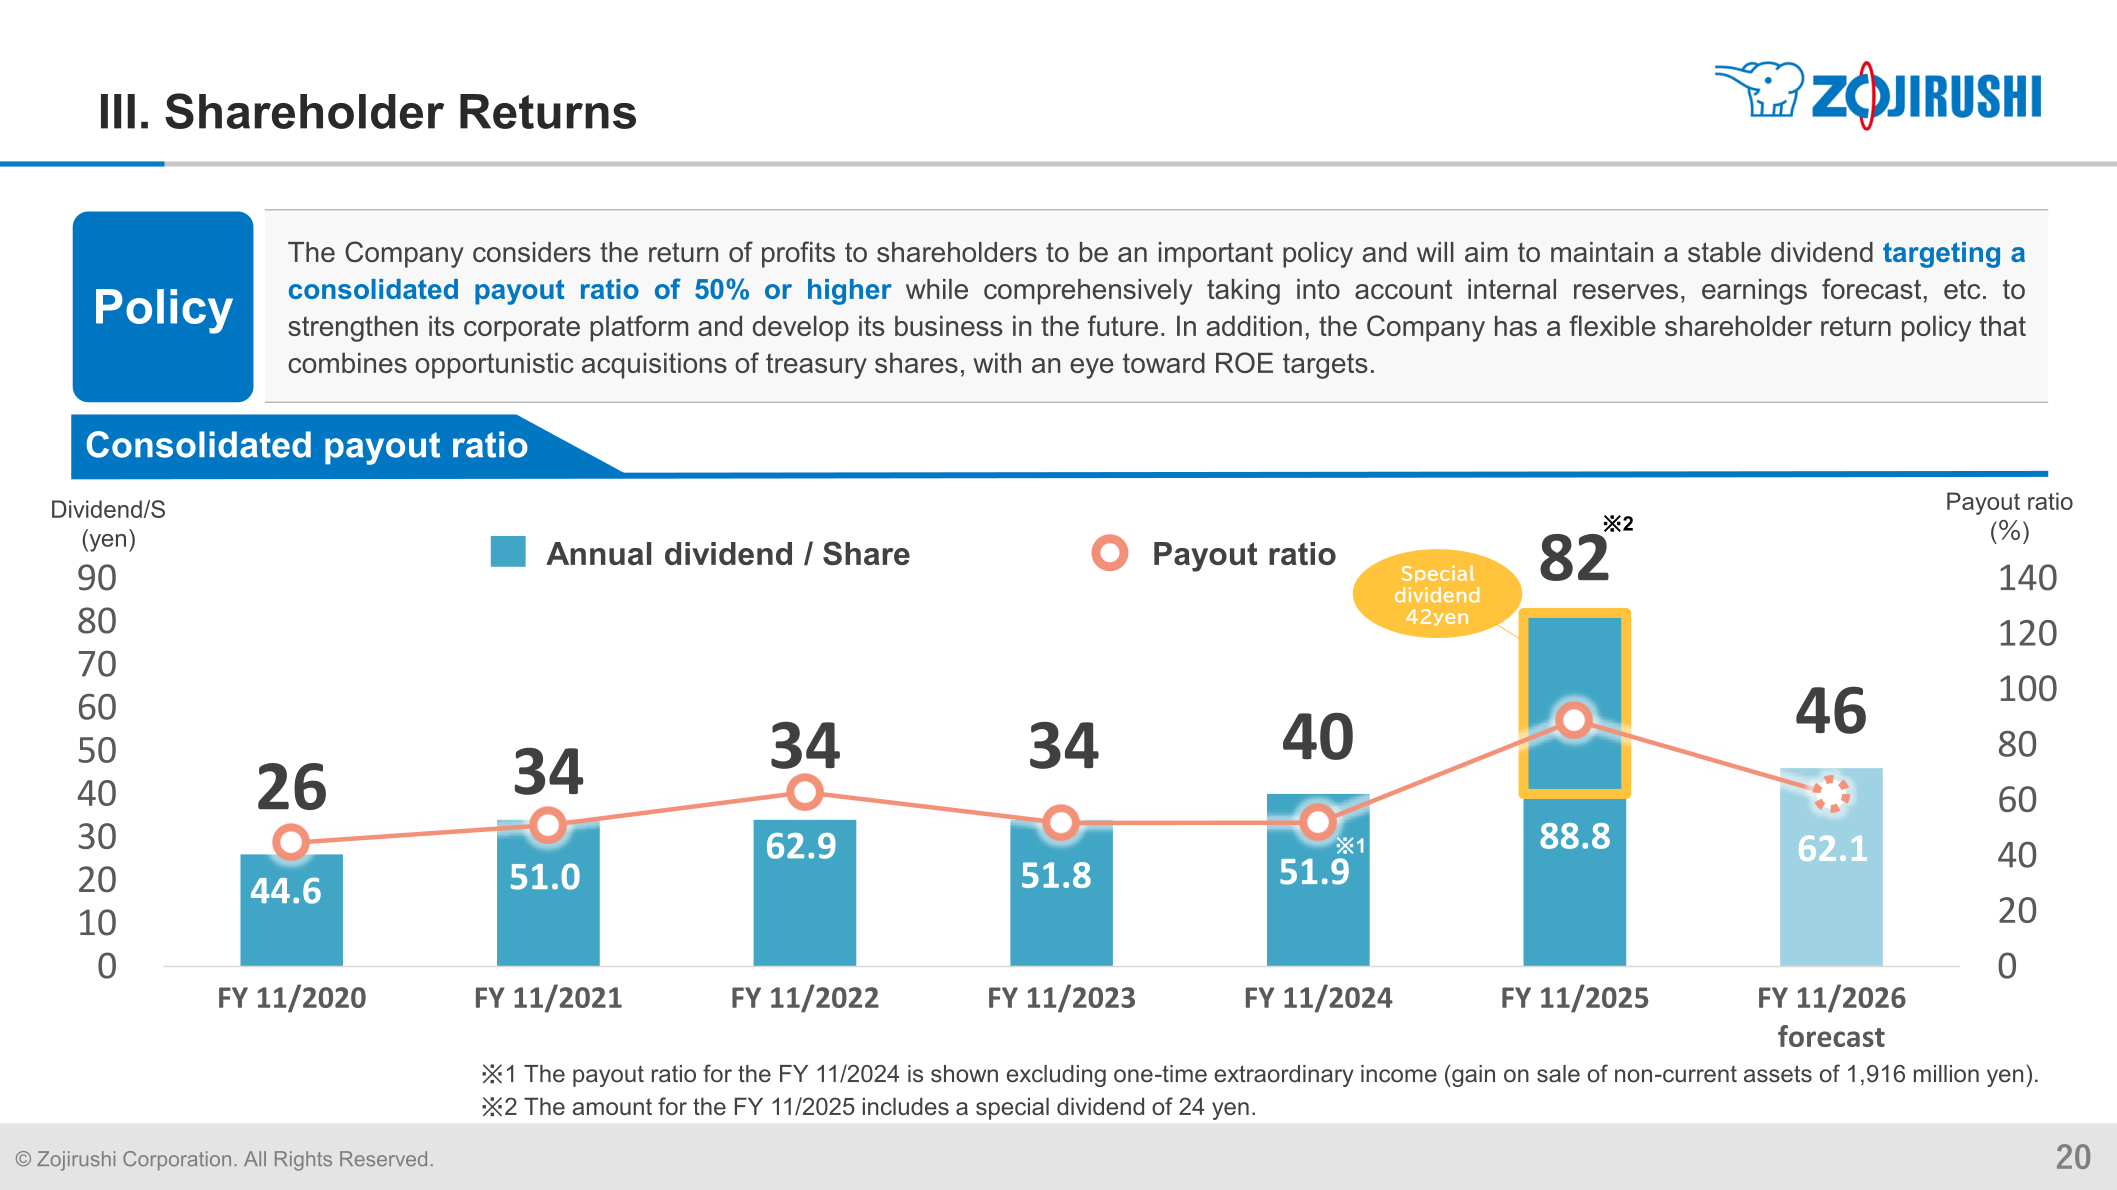
The Company considers the return of profits to shareholders to be an important policy and aims to maintain a stable dividend targeting a consolidated payout ratio of 50% or higher, while comprehensively taking into account internal reserves, earnings forecast, etc., to strengthen its corporate platform and develop its business in the future. It also maintains a flexible shareholder return policy combining opportunistic acquisitions of treasury shares with an eye toward ROE targets. The annual dividend per share for FY 11/2025 was 82 yen, up from 40 yen in FY 11/2024, and the consolidated payout ratio rose to 88.8% from 51.9% (the FY 11/2024 payout ratio is shown excluding one-time extraordinary income of 1,916 million yen from the gain on sale of non-current assets). The FY 11/2025 dividend included a one-time special dividend; the source material gives two different figures for the special-dividend amount on the same page (a chart callout states 42 yen while a footnote states 24 yen), so the specific special-dividend amount is not stated here. For FY 11/2026, the Company forecasts an annual dividend of 46 yen per share and a payout ratio of 62.1%.
| Fiscal Year | Annual Dividend / Share | Payout Ratio (Consolidated) |
|---|---|---|
| FY 11/2020 | 26 yen | 44.6% |
| FY 11/2021 | 34 yen | 51.0% |
| FY 11/2022 | 34 yen | 62.9% |
| FY 11/2023 | 34 yen | 51.8% |
| FY 11/2024 | 40 yen | 51.9% |
| FY 11/2025 | 82 yen | 88.8% |
| FY 11/2026 (Forecast) | 46 yen | 62.1% |
This article is an analysis based on publicly available information and is not a recommendation to buy or sell any specific securities. Investment decisions are your own responsibility.
















