
This article is based on publicly available IR materials and is not a recommendation to buy or sell any specific securities.
Note: Roland’s fiscal year ends December 31. The source presentation labels the year under review “FY12/2025”; this article follows japan-equity.com’s site-wide convention of referring to the most recently completed fiscal year as “FY2025” in the title and slug, while retaining the source’s own “FY12/2025” / “FY12/2026” labels in the body, tables and captions.
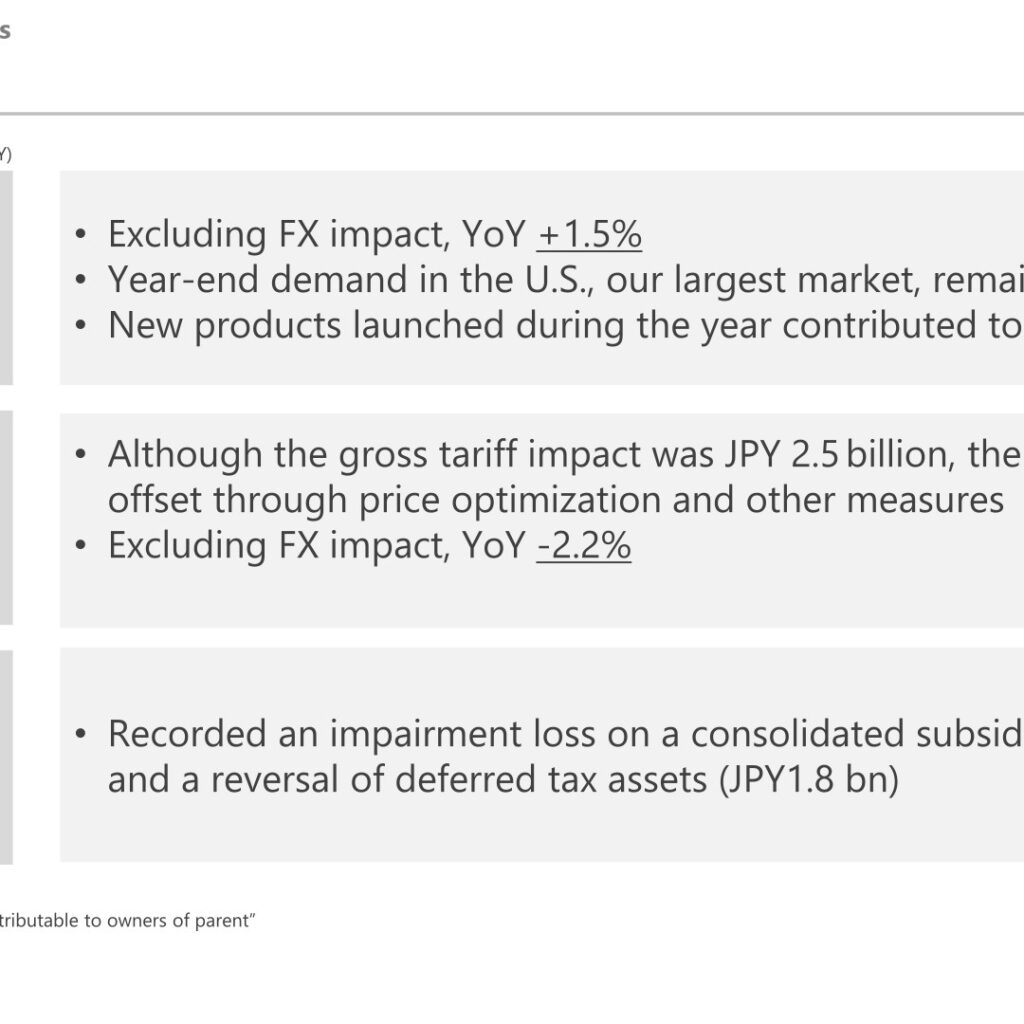
Roland Corporation reported FY12/2025 consolidated sales of JPY100.9 billion, up 1.5% year on year, as strong U.S. year-end demand and contributions from new products offset a gross tariff impact of JPY2.5 billion through price optimization. Operating profit fell 5.4% to JPY9.4 billion, and net profit attributable to owners of parent fell 63.7% to JPY2.1 billion after Roland recorded an impairment loss and a full reversal of deferred tax assets at its U.S. acoustic drum subsidiary, Drum Workshop, Inc. (DW). For FY12/2026, the company forecasts growth in both sales and operating profit and plans to keep its annual dividend unchanged at JPY170 per share.
Consolidated Results (FY12/2025 Actual)
Sales reached the upper end of Roland’s forecast range, while operating profit landed around the midpoint. Excluding the effect of foreign exchange, sales were also up 1.5% year on year. On a bridge basis, the year-on-year change in operating profit (from JPY9.9bn to JPY9.4bn, or -5.4%; -2.2% excluding FX) comprised a roughly flat contribution from sales volume, a JPY2.9bn positive effect from the selling price/cost ratio (price optimization and product mix improvement), a JPY0.6bn negative effect from SG&A (higher personnel, A&P and travel expenses, though JPY1.0 billion below the initial plan), a JPY0.3bn negative FX impact, and a JPY2.5bn negative effect from tariff-related cost increases. Net profit attributable to owners of parent fell 63.7% to JPY2.1 billion, reflecting an impairment loss on a consolidated subsidiary of JPY3.8 billion and a reversal of deferred tax assets of JPY1.8 billion.
| Item | FY12/2024 (Actual, % of Sales) | FY12/2025 (Actual, % of Sales) | YoY |
|---|---|---|---|
| Sales | 99,433 (100.0%) | 100,952 (100.0%) | +1.5% |
| Gross Profit | 42,571 (42.8%) | 42,644 (42.2%) | +0.2% |
| SG&A | 32,619 (32.8%) | 33,231 (32.9%) | +1.9% |
| Operating Profit | 9,951 (10.0%) | 9,412 (9.3%) | -5.4% |
| Net Profit (attributable to owners of parent) | 5,976 (6.0%) | 2,168 (2.1%) | -63.7% |
| EBITDA | 12,844 (12.9%) | 12,388 (12.3%) | -3.5% |
Segment Results
By product category, sales grew year on year in most lines, led by Creation-related Products & Services (+3.4%, +3.6% ex-FX) and Percussion & Wind Instruments (+2.7%, +3.0% ex-FX), supported by market stabilization and new product contributions; keyboard sales returned to growth for the first time in two years, driven by strong portable models and a recovery in the Chinese market. Video & Pro Audio (-4.4%) and Other (-2.0%) declined. By region, sales increased in all other regions despite the impact of bankruptcies among certain dealers in Europe. In North America, sell-through remained steady even after tariff-related price adjustments; in China, sales returned to growth for the first time in two years as the market moved toward recovery; and other regions continued to record solid growth (emerging markets +6%, developed markets +4%).
| Category | FY12/2024 (Actual) | FY12/2025 (Actual) | YoY (ex-FX) |
|---|---|---|---|
| Keyboards | 26,869 | 27,223 | +1.3% (+0.8%) |
| Percussion & Wind Instruments | 28,588 | 29,364 | +2.7% (+3.0%) |
| Guitar-related Products | 24,988 | 25,149 | +0.6% (+0.7%) |
| Creation-related Products & Services | 12,627 | 13,060 | +3.4% (+3.6%) |
| Video & Pro Audio | 3,199 | 3,057 | -4.4% (-4.0%) |
| Other | 3,160 | 3,097 | -2.0% (-2.4%) |
| Total | 99,433 | 100,952 | +1.5% (+1.5%) |
| Region | FY12/2024 (Actual) | FY12/2025 (Actual) | YoY (ex-FX) |
|---|---|---|---|
| Japan | 9,054 | 9,262 | +2.3% (+2.3%) |
| North America | 38,382 | 38,764 | +1.0% (+2.2%) |
| Europe | 28,755 | 28,968 | +0.7% (-2.6%) |
| China | 7,411 | 7,561 | +2.0% (+3.3%) |
| Other | 15,830 | 16,394 | +3.6% (+5.7%) |
| Total | 99,433 | 100,952 | +1.5% (+1.5%) |
Topics: Impairment at Drum Workshop, Inc. (DW)
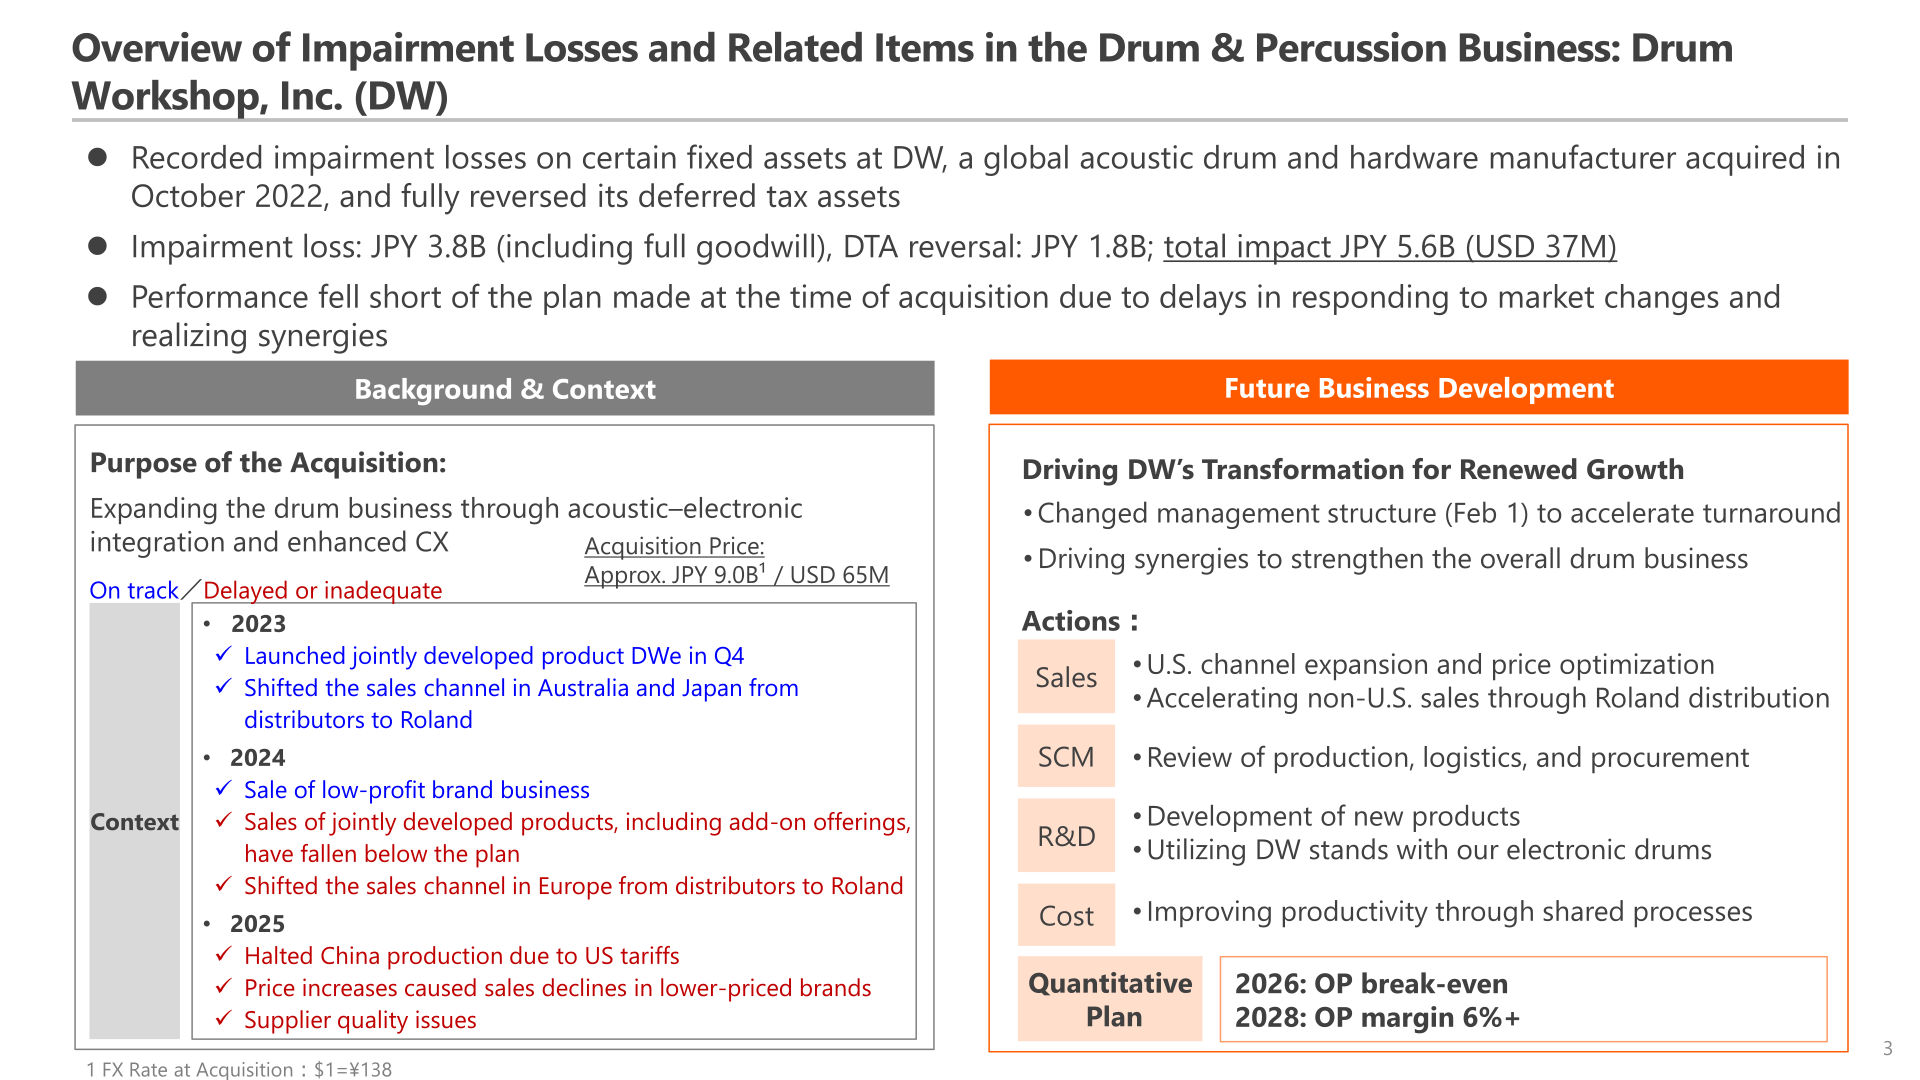
Roland recorded impairment losses on certain fixed assets at DW, a global acoustic drum and hardware manufacturer acquired in October 2022 for approximately JPY9.0 billion (USD65M; FX rate at acquisition $1=¥138), and fully reversed DW’s deferred tax assets. The impairment loss was JPY3.8 billion (including full goodwill) and the deferred tax asset reversal was JPY1.8 billion, for a total impact of JPY5.6 billion (USD37M). Performance fell short of the plan made at the time of acquisition due to delays in responding to market changes and in realizing synergies; contributing factors cited include halted China production due to U.S. tariffs, price increases that caused sales declines in lower-priced brands, and supplier quality issues. Roland changed DW’s management structure on February 1 to accelerate a turnaround and is driving sales, supply-chain, R&D and cost initiatives across the drum business, targeting operating-profit break-even in 2026 and an operating profit margin of 6% or more by 2028.
FY12/2026 Forecast
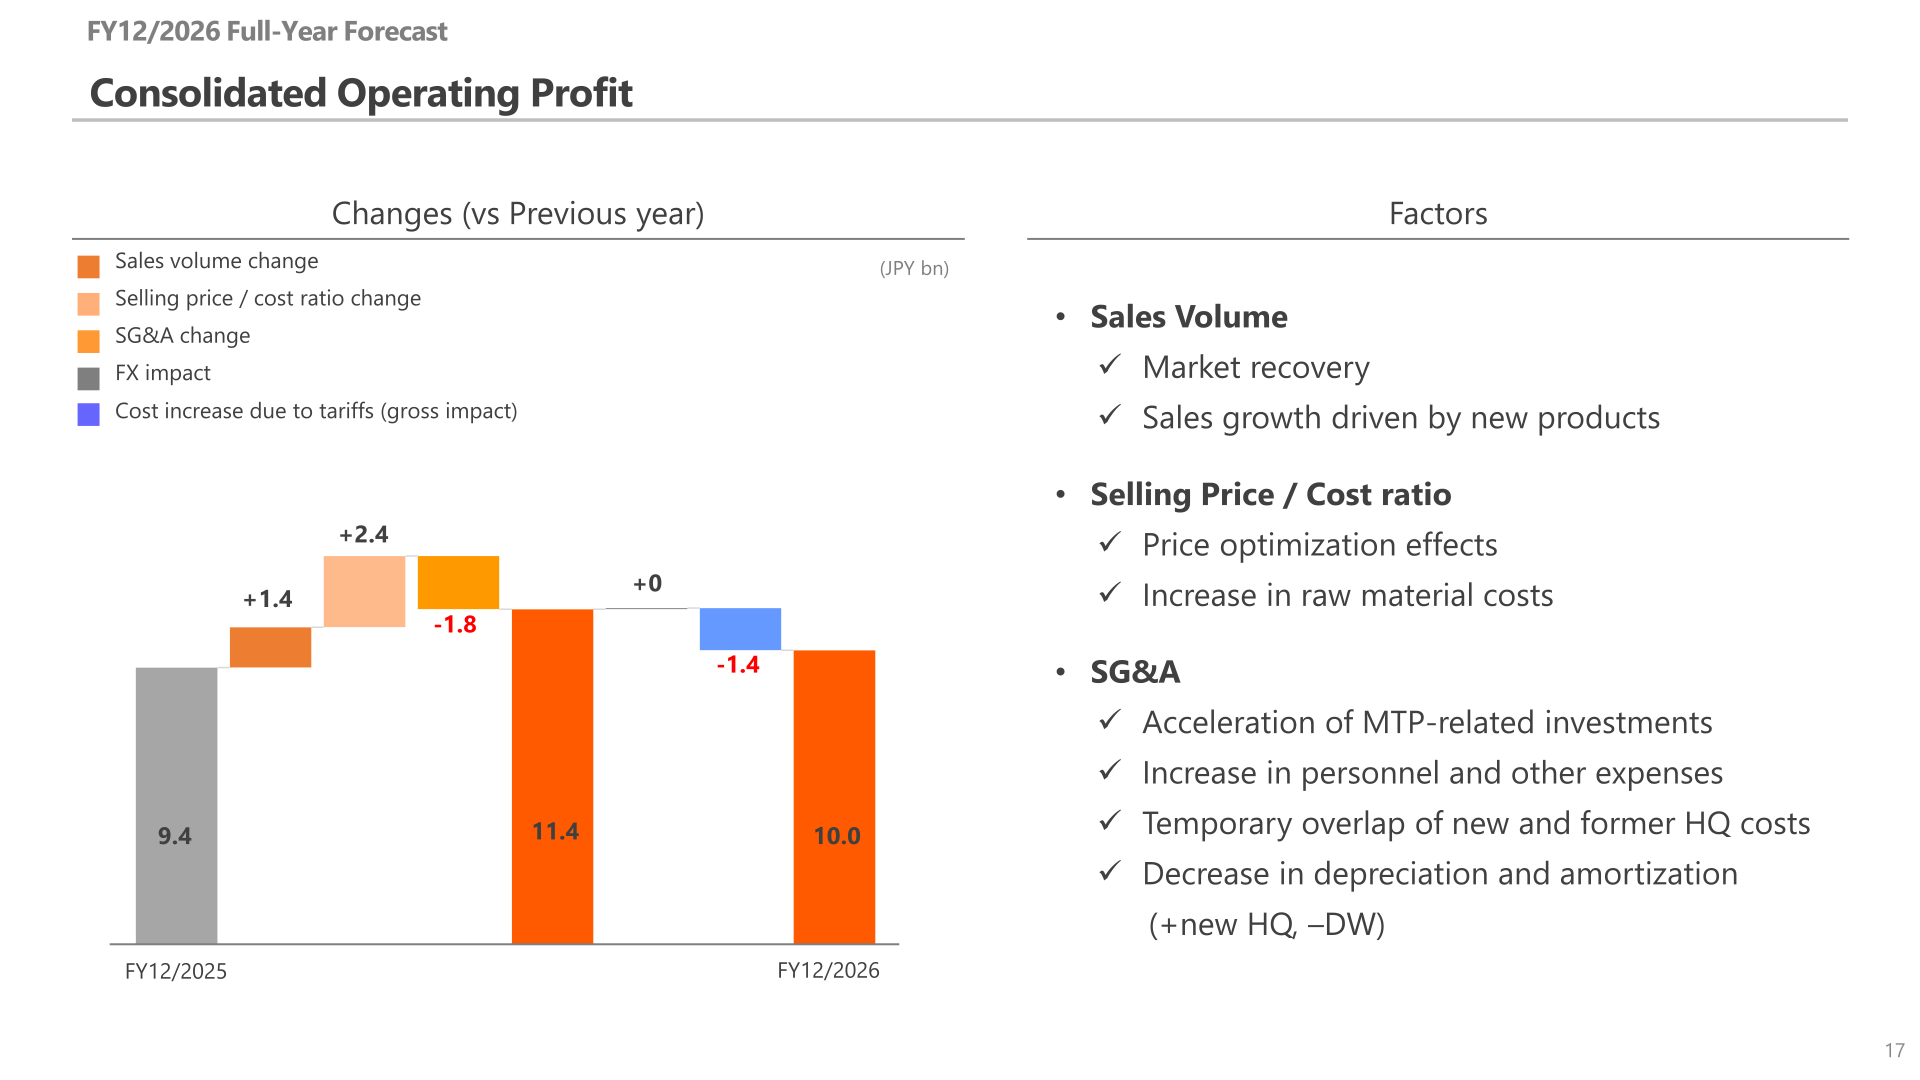
Roland forecasts FY12/2026 sales of JPY106.4 billion (+5.4% YoY) and operating profit of JPY10.0 billion (+6.2% YoY), citing an entry into a market recovery phase, additional contributions from new product launches, and continued benefits from price optimization, partly offset by a gross tariff impact of approximately JPY1.4 billion. Net profit attributable to owners of parent is forecast to rise 232.1% to JPY7.2 billion, rebounding from the prior year’s impairment loss and deferred tax asset reversal at DW. On a bridge basis, the forecast increase in operating profit (from JPY9.4bn to JPY10.0bn) reflects a JPY1.4bn benefit from sales volume, a JPY2.4bn benefit from the selling price/cost ratio (partly offset by higher raw material costs), a JPY1.8bn negative effect from SG&A (acceleration of Mid-term Management Plan investments, higher personnel and other expenses, and a temporary overlap of new and former head-office costs), a negligible FX impact, and a JPY1.4bn negative effect from tariffs. By half, Roland expects sales of JPY49.5bn and operating profit of JPY6.1bn in the first half, and sales of JPY56.9bn and operating profit of JPY3.9bn in the second half, with growth in both sales and operating profit expected in both halves.
| Item | FY12/2025 (Actual, % of Sales) | FY12/2026 (Forecast, % of Sales) | YoY |
|---|---|---|---|
| Sales | 100,952 (100.0%) | 106,400 (100.0%) | +5.4% |
| Gross Profit | 42,644 (42.2%) | 45,000 (42.3%) | +5.5% |
| SG&A | 33,231 (32.9%) | 35,000 (32.9%) | +5.3% |
| Operating Profit | 9,412 (9.3%) | 10,000 (9.4%) | +6.2% |
| Net Profit (attributable to owners of parent) | 2,168 (2.1%) | 7,200 (6.8%) | +232.1% |
| EBITDA | 12,388 (12.3%) | 13,115 (12.3%) | +5.9% |
Shareholder Returns
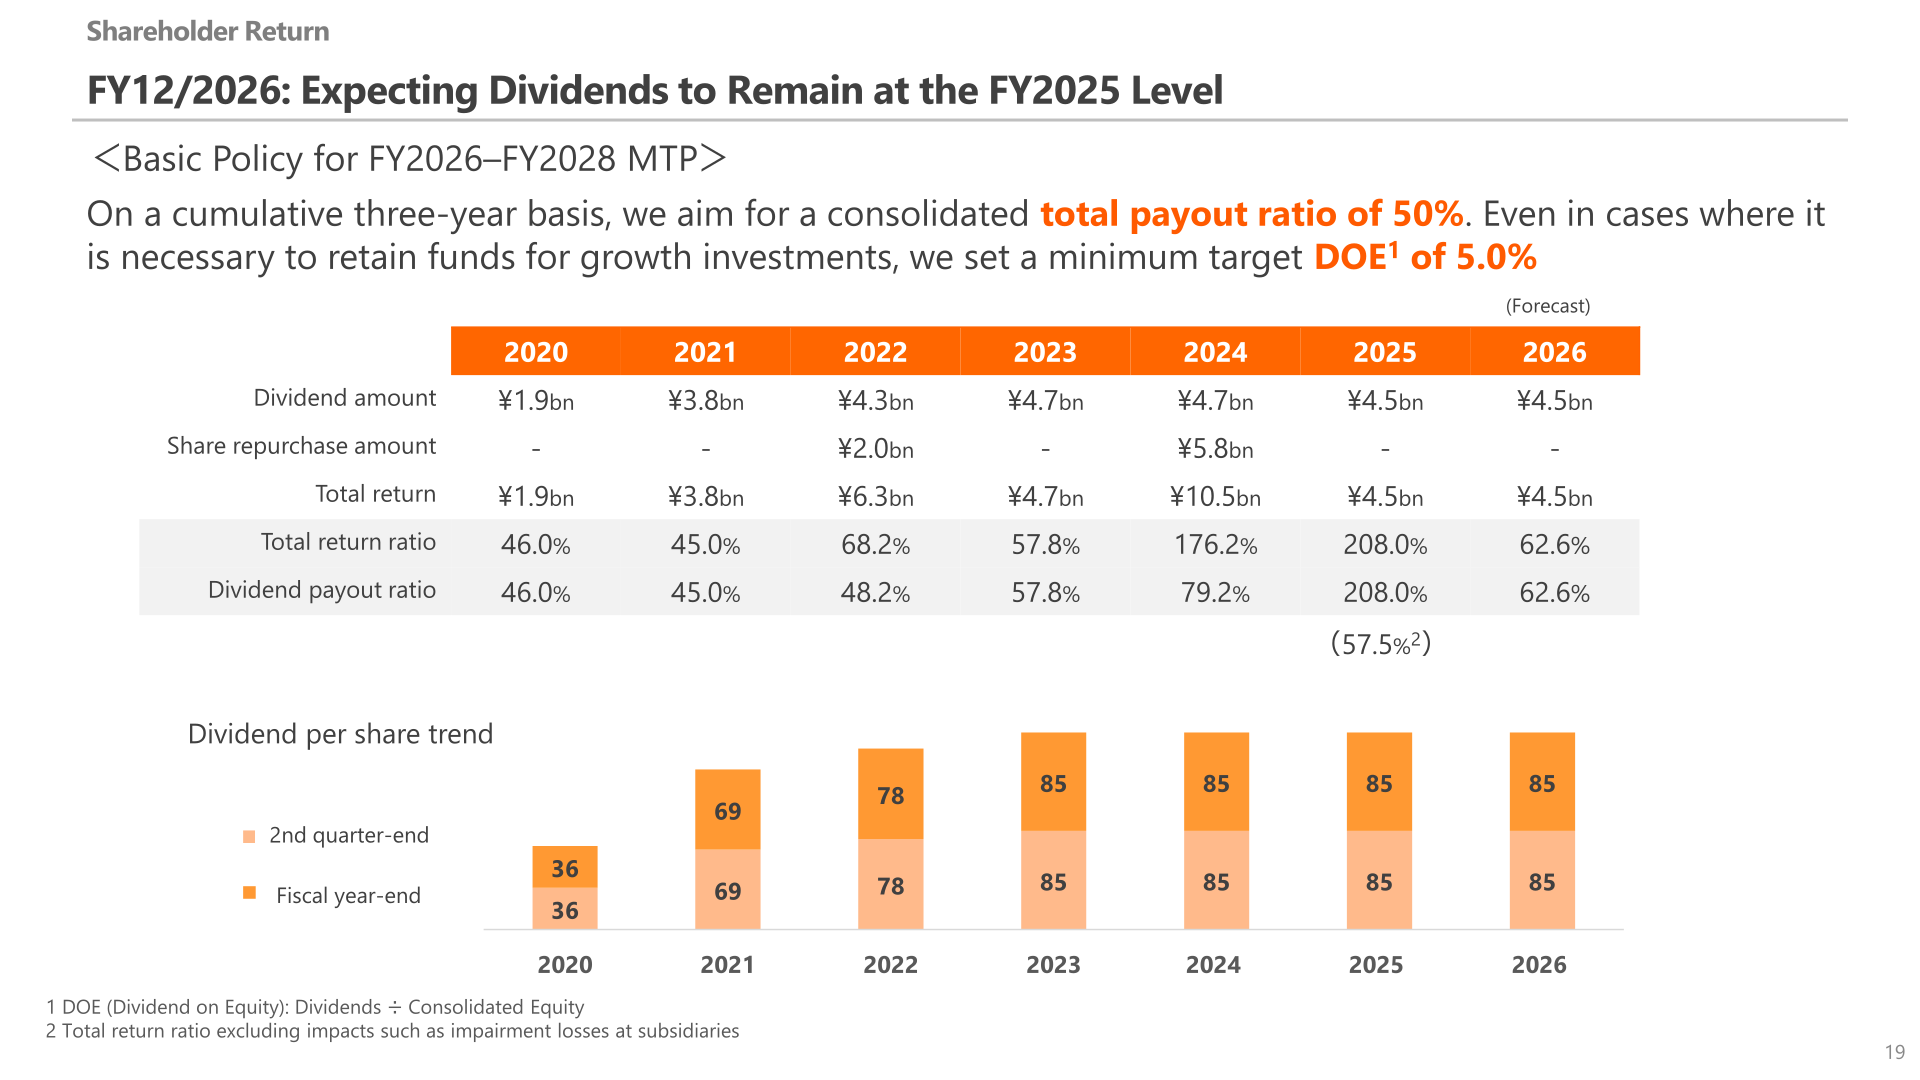
Roland’s FY12/2025 year-end dividend is planned at JPY85 per share, in line with initial guidance, for an annual dividend of JPY170 per share (JPY85 at the second-quarter end and JPY85 at fiscal year-end). For FY12/2026, dividends are expected to remain unchanged at an annual total of JPY170 per share (JPY85 at 2Q-end and JPY85 at year-end). Under the basic policy for the FY2026-FY2028 Mid-term Management Plan, Roland aims for a consolidated total payout ratio of 50% on a cumulative three-year basis, and sets a minimum target DOE (Dividend on Equity: dividends divided by consolidated equity) of 5.0% even in cases where it is necessary to retain funds for growth investments. The FY12/2025 total return ratio and dividend payout ratio were both 208.0% (each 57.5% when excluding impacts such as impairment losses at subsidiaries); no share repurchases were conducted in FY12/2024, FY12/2025 or the FY12/2026 forecast, following a JPY5.8 billion repurchase in FY12/2023 (calendar-year figures as presented).
| Item | 2022 | 2023 | 2024 | 2025 | 2026 (Forecast) |
|---|---|---|---|---|---|
| Dividend amount | ¥4.3bn | ¥4.7bn | ¥4.7bn | ¥4.5bn | ¥4.5bn |
| Share repurchase amount | ¥2.0bn | – | ¥5.8bn | – | – |
| Total return | ¥6.3bn | ¥4.7bn | ¥10.5bn | ¥4.5bn | ¥4.5bn |
| Total return ratio | 68.2% | 57.8% | 176.2% | 208.0% (57.5%*) | 62.6% |
| Dividend payout ratio | 48.2% | 57.8% | 79.2% | 208.0% (57.5%*) | 62.6% |
| Dividend per share – 2nd quarter-end | 78 | 85 | 85 | 85 | 85 |
| Dividend per share – Fiscal year-end | 78 | 85 | 85 | 85 | 85 |
This article is an analysis based on publicly available information and is not a recommendation to buy or sell any specific securities. Investment decisions are your own responsibility.
















