
This article is based on publicly available IR materials and is not a recommendation to buy or sell any specific securities.
ASICS Corporation, which closes its books in December, reported results for the fiscal year ended December 31, 2025 (FY25) on February 13, 2026. Net sales rose 19.5% year on year to 810.9 billion yen, surpassing the 800 billion yen mark for the first time, while operating profit increased 42.4% to 142.5 billion yen and the operating margin improved 2.8ppt to 17.6%. Profit attributable to owners of parent rose 54.7% to 98.7 billion yen. The company described FY25 as its fifth consecutive year of higher sales and profits, with net sales and operating profit reaching record highs for the fourth consecutive year. For FY26 — the final year of its Mid-Term Plan — ASICS forecasts net sales of 950.0 billion yen and operating profit of 171.0 billion yen, both new records, alongside an annual dividend of 38.0 yen per share.
Consolidated Results (Full-Year Actual)
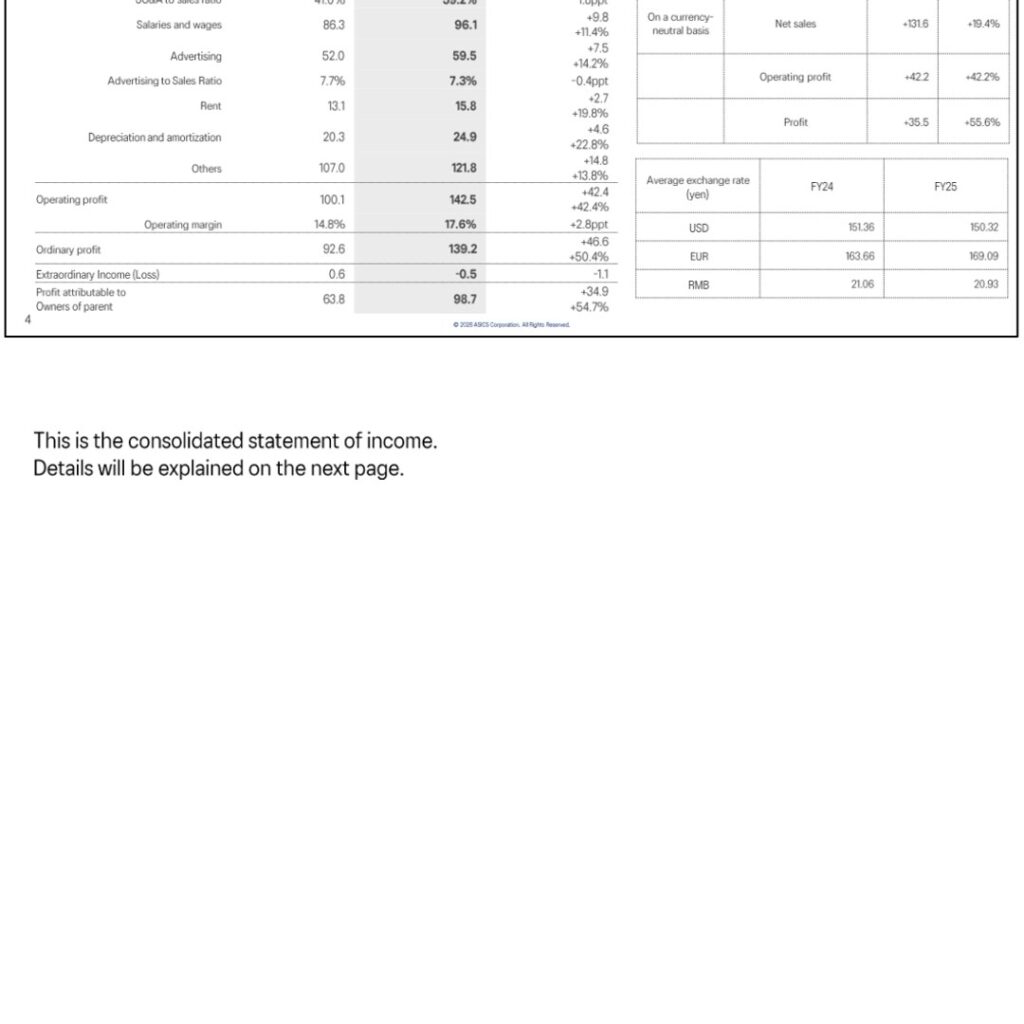
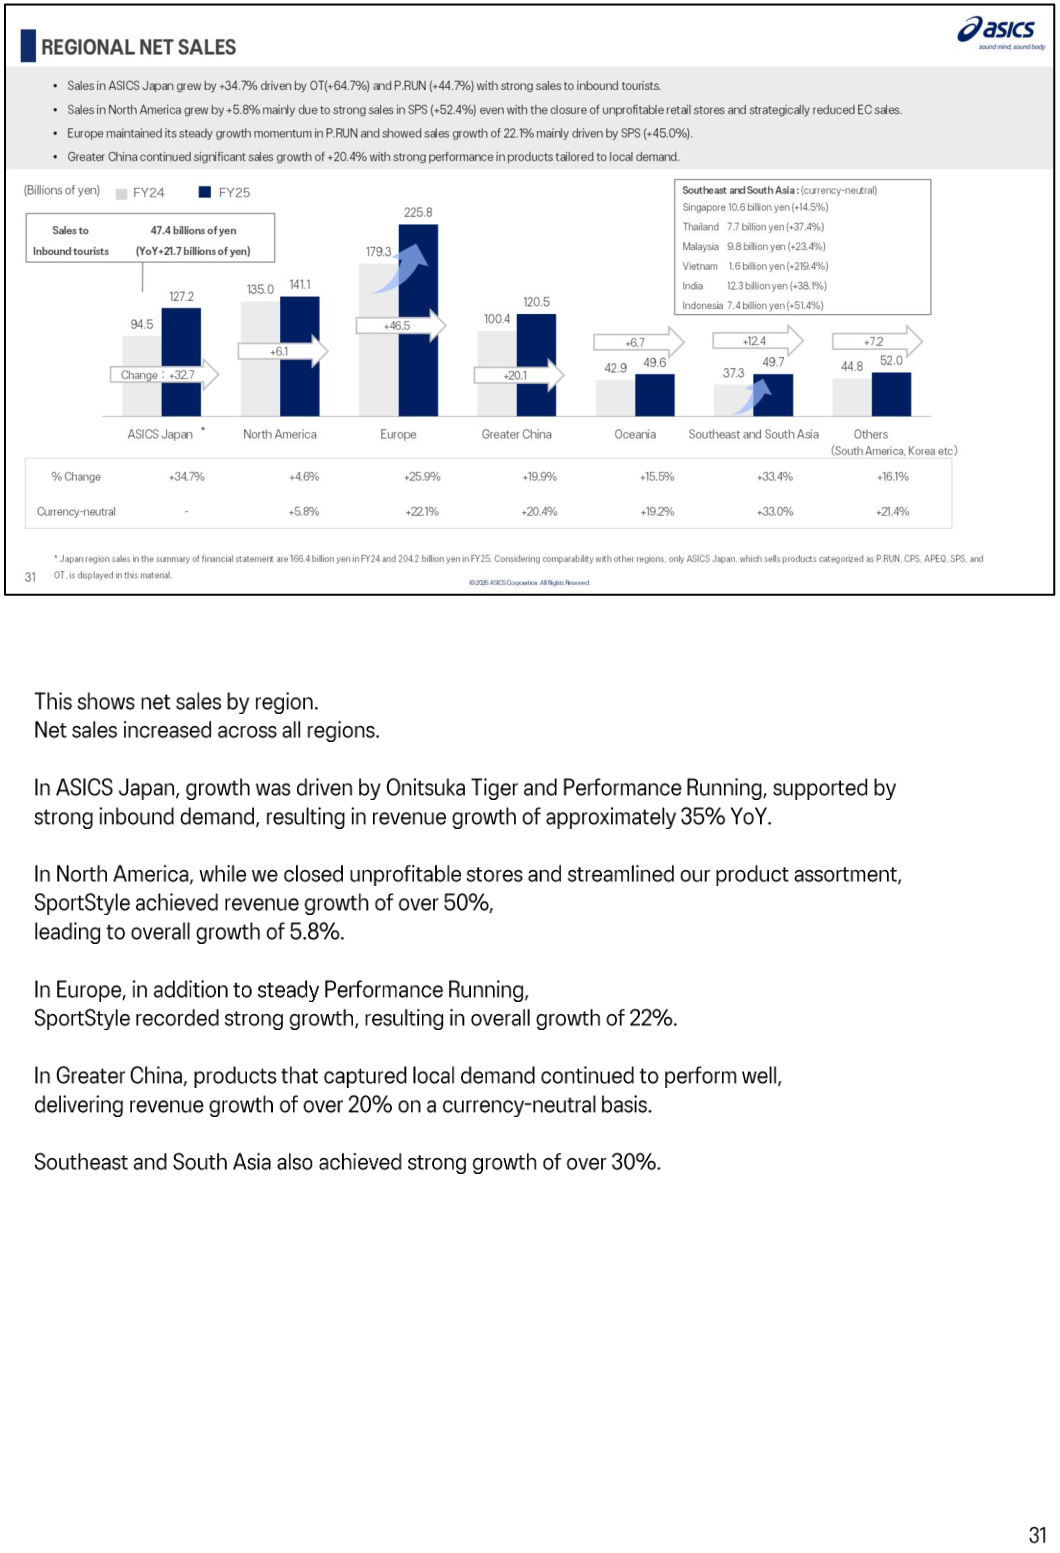
Net sales increased 132.4 billion yen year on year to 810.9 billion yen (+19.5%, or +19.4% on a currency-neutral basis), with growth across all categories and all regions. The gross margin improved 1.0ppt to 56.8%, which the company attributed to a focus on high-end products despite unfavorable purchase exchange rates and the impact of U.S. tariffs. SG&A expenses rose 14.1% to 318.1 billion yen — below the rate of sales growth — so the SG&A to sales ratio improved 1.8ppt to 39.2%; within SG&A, salaries and wages rose 11.4% to 96.1 billion yen and advertising rose 14.2% to 59.5 billion yen. Operating profit therefore rose 42.4 billion yen to 142.5 billion yen (+42.4%, or +42.2% currency-neutral), ordinary profit rose 50.4% to 139.2 billion yen, and profit attributable to owners of parent rose 54.7% to 98.7 billion yen (+55.6% currency-neutral). Sales in foreign markets reached 652.4 billion yen, or 80.5% of the total. Average exchange rates for FY25 were 150.32 yen to the USD, 169.09 yen to the EUR and 20.93 yen to the RMB. In the October–December fourth quarter alone, net sales rose 21.4% to 185.9 billion yen and operating profit rose 73.7% to 14.9 billion yen, with profit attributable to owners of parent of 12.4 billion yen against a loss of 1.1 billion yen a year earlier.
| Item (billions of yen) | FY25 | FY24 | Change |
|---|---|---|---|
| Net sales | 810.9 | 678.5 | +132.4 / +19.5% |
| Gross profit | 460.6 | 378.8 | +81.8 / +21.6% |
| Gross margin | 56.8% | 55.8% | +1.0ppt |
| SG&A expenses | 318.1 | 278.7 | +39.4 / +14.1% |
| SG&A to sales ratio | 39.2% | 41.0% | -1.8ppt |
| Operating profit | 142.5 | 100.1 | +42.4 / +42.4% |
| Operating margin | 17.6% | 14.8% | +2.8ppt |
| Ordinary profit | 139.2 | 92.6 | +46.6 / +50.4% |
| Profit attributable to owners of parent | 98.7 | 63.8 | +34.9 / +54.7% |
| Sales in foreign market | 652.4 | 545.0 | +107.4 / +19.7% |
Results by Category
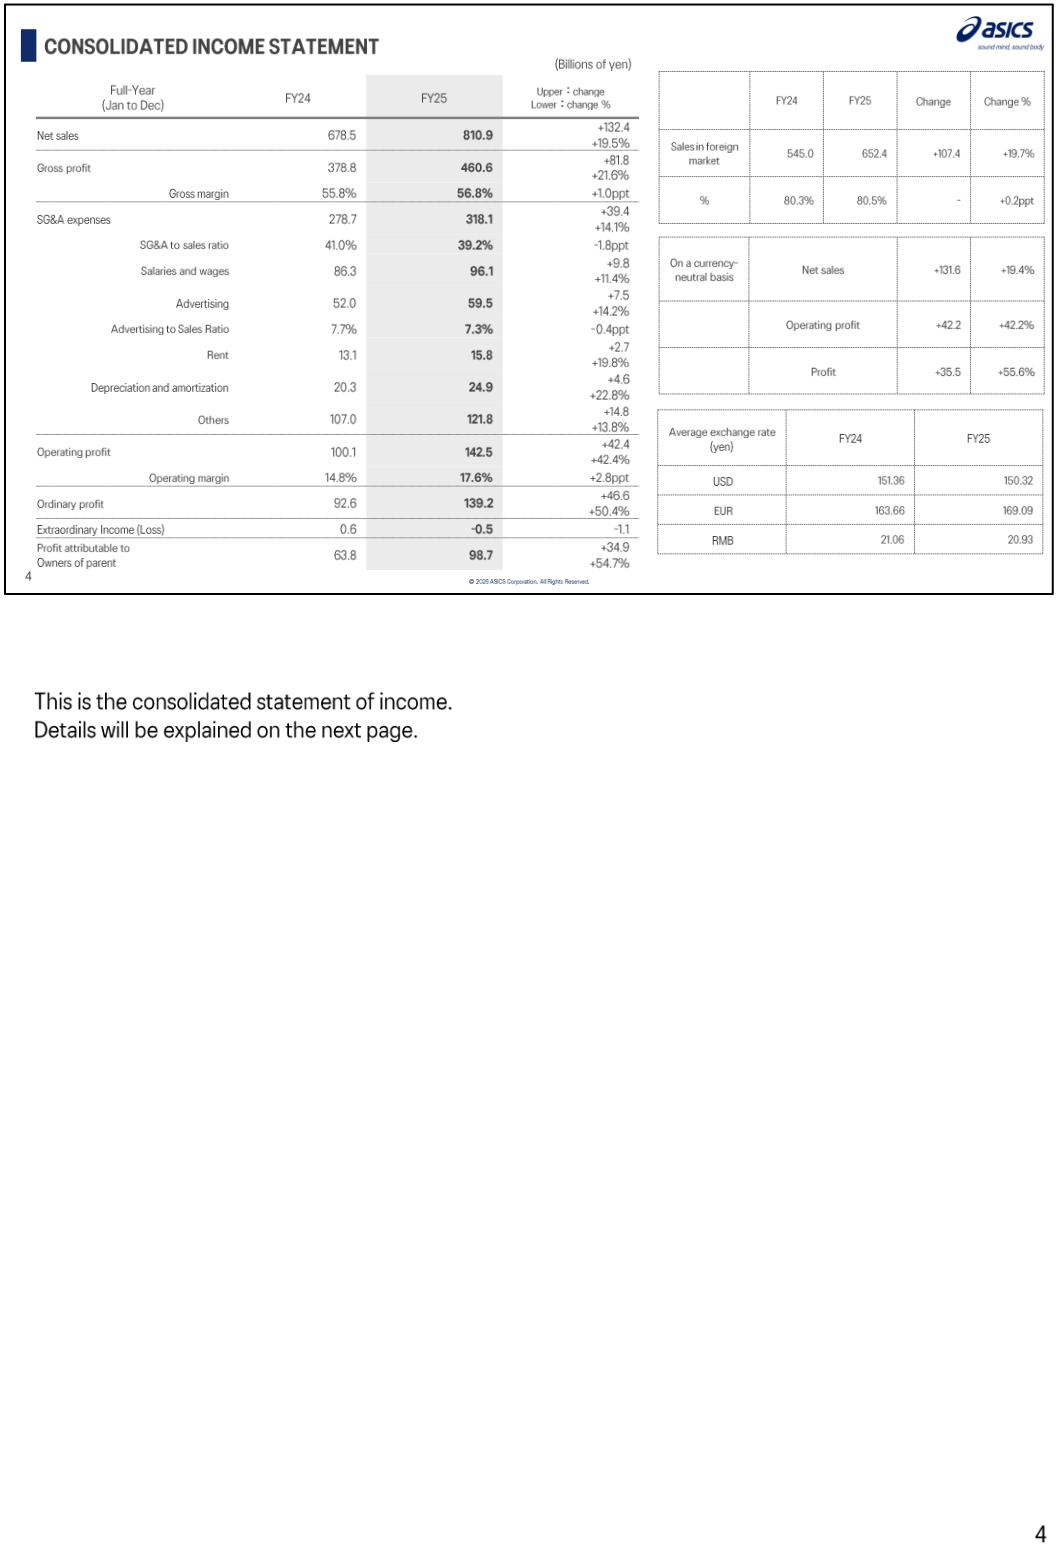
All five categories grew sales and profit, and every category profit margin improved. Performance Running (P.RUN) net sales rose 11.2% to 363.5 billion yen (+11.2% currency-neutral) as the company concentrated on high-end products despite strategic streamlining; category profit rose 21.6% to 86.0 billion yen and the category profit margin improved 2.1ppt to 23.7%, helped by a gross margin of 53.6% (+0.6ppt). Core Performance Sports (CPS) net sales rose 9.4% to 86.0 billion yen, led by tennis, volleyball and indoor sports, with category profit up 18.9% to 16.7 billion yen (margin 19.5%, +1.6ppt) and a gross margin of 47.5% (+1.0ppt). Apparel & Equipment (APEQ) net sales rose 10.5% to 42.0 billion yen on strong running apparel in Europe, with category profit up 36.9% to 5.9 billion yen (margin 14.1%, +2.7ppt) and a gross margin of 54.2% (+1.9ppt). SportStyle (SPS) grew net sales 43.6% to 141.3 billion yen with category profit up 53.8% to 41.3 billion yen (margin 29.3%, +2.0ppt), even as the gross margin slipped 0.8ppt to 50.7% on a higher wholesale mix. Onitsuka Tiger (OT) grew net sales 43.0% to 136.5 billion yen and category profit 58.7% to 51.4 billion yen, the highest margin of any category at 37.7% (+3.7ppt), on a gross margin of 74.6% (+1.8ppt). Corporate expenses not linked to any category were 52.0 billion yen, up 5.7% year on year and contained well within the rate of sales growth.
| Category (billions of yen) | Net sales FY25 | Net sales FY24 | Category profit FY25 | Category profit FY24 | Category profit margin FY25 |
|---|---|---|---|---|---|
| Performance Running (P.RUN) | 363.5 | 326.9 | 86.0 | 70.7 | 23.7% |
| Core Performance Sports (CPS) | 86.0 | 78.6 | 16.7 | 14.1 | 19.5% |
| Apparel & Equipment (APEQ) | 42.0 | 38.0 | 5.9 | 4.3 | 14.1% |
| SportStyle (SPS) | 141.3 | 98.4 | 41.3 | 26.8 | 29.3% |
| Onitsuka Tiger (OT) | 136.5 | 95.4 | 51.4 | 32.4 | 37.7% |
| Others | 41.6 | – | – | – | – |
| Consolidated (operating profit) | 810.9 | 678.5 | 142.5 | 100.1 | 17.6% |
Results by Region
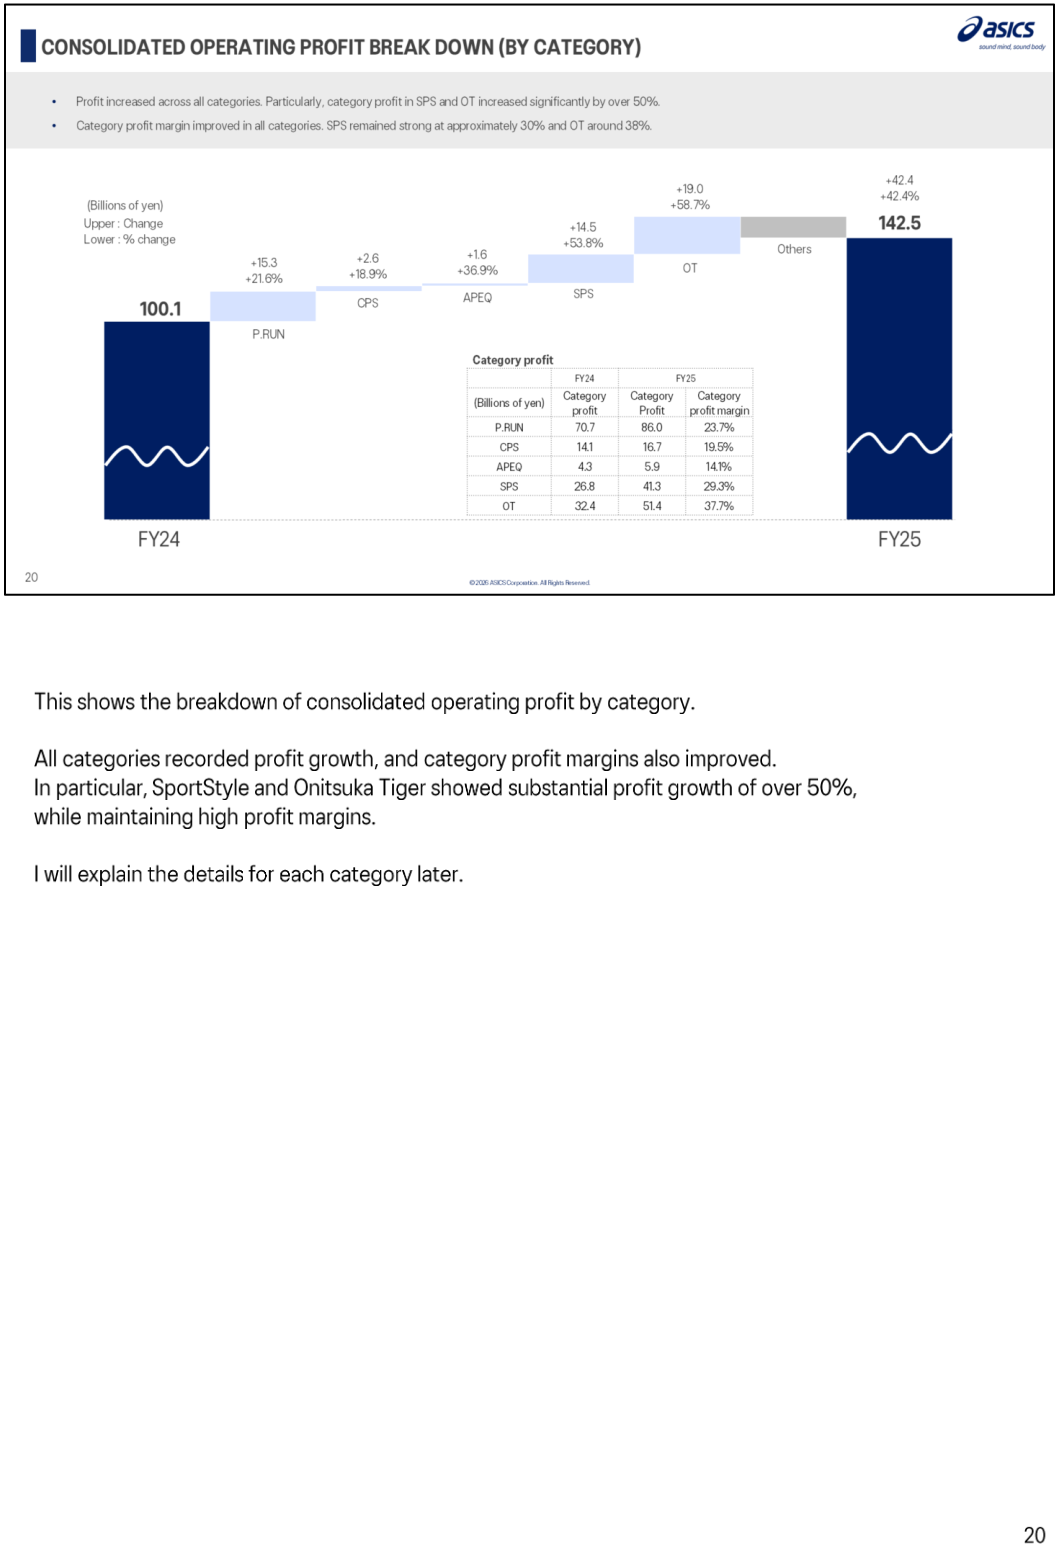
Net sales and operating profit increased in every region. ASICS Japan net sales rose 34.7% to 127.2 billion yen, driven by Onitsuka Tiger (+64.7%) and Performance Running (+44.7%) on strong inbound demand, and its operating margin reached 30.0% (+6.5ppt). Sales to inbound tourists in Japan reached 47.4 billion yen, up 21.7 billion yen (+84%) from 25.7 billion yen a year earlier, of which Onitsuka Tiger accounted for 41.5 billion yen (+89%) and ASICS 5.9 billion yen (+56%); by nationality, China contributed 11.6 billion yen and the United States 7.6 billion yen (+180%). Europe grew net sales 25.9% to 225.8 billion yen (+22.1% currency-neutral), led by SportStyle (+45.0%), lifting the operating margin 2.2ppt to 16.3%. North America grew 4.6% to 141.1 billion yen (+5.8% currency-neutral) despite closing unprofitable retail stores and strategically reducing EC sales, and its operating margin improved 3.0ppt to 11.3% — the first double-digit margin since 2019, when disclosure under the current North America segment began. Greater China net sales rose 19.9% to 120.5 billion yen (+20.4% currency-neutral) with an operating margin of 20.8% (+1.6ppt), Southeast and South Asia rose 33.4% to 49.7 billion yen with an operating margin of 22.0%, and Oceania rose 15.5% to 49.6 billion yen.
| Region (billions of yen) | Net sales FY25 | Net sales FY24 | % change | Operating profit FY25 | Operating profit FY24 | Operating margin FY25 |
|---|---|---|---|---|---|---|
| Japan (region total) | 204.2 | 166.4 | +22.7% | 44.7 | 27.6 | 21.9% |
| ASICS Japan | 127.2 | 94.5 | +34.7% | 38.1 | 22.1 | 30.0% |
| North America | 141.1 | 135.0 | +4.6% | 16.0 | 11.2 | 11.3% |
| Europe | 225.8 | 179.3 | +25.9% | 36.7 | 25.2 | 16.3% |
| Greater China | 120.5 | 100.4 | +19.9% | 25.0 | 19.3 | 20.8% |
| Oceania | 49.6 | 42.9 | +15.5% | 7.9 | 7.6 | 16.0% |
| Southeast and South Asia | 49.7 | 37.3 | +33.4% | 10.9 | 7.4 | 22.0% |
| Others (South America, Korea etc.) | 52.0 | 44.8 | +16.1% | 8.1 | 6.5 | 15.6% |
Financial Position and Cash Flow
Total assets stood at 586.4 billion yen, up 67.4 billion yen from the end of FY24, with current assets of 409.9 billion yen (+40.8) and fixed assets of 176.5 billion yen (+26.6). Liabilities were 313.1 billion yen (+29.0) and net assets 273.3 billion yen (+38.4), lifting the equity ratio 1.4ppt to 46.3% from 44.9%. Inventories rose 41.4 billion yen to 178.9 billion yen — an increase of 31.9 billion yen (+23.2%) on a currency-neutral basis — reflecting a buildup for the Spring/Summer 2026 season on strong orders; even so, consolidated days inventory outstanding was contained to 152 days, up only one day, while days sales outstanding improved four days to 45 days and the cash conversion cycle improved four days to 132 days. Operating cash flow exceeded the 100 billion yen mark for the second consecutive year. The cash balance was 112.2 billion yen, down 14.8 billion yen year on year, after two treasury share repurchases totaling 50.0 billion yen and dividend payments of 15.7 billion yen. ROA rose 4.9ppt to 17.9% from 13.0%.
FY2026 Forecast
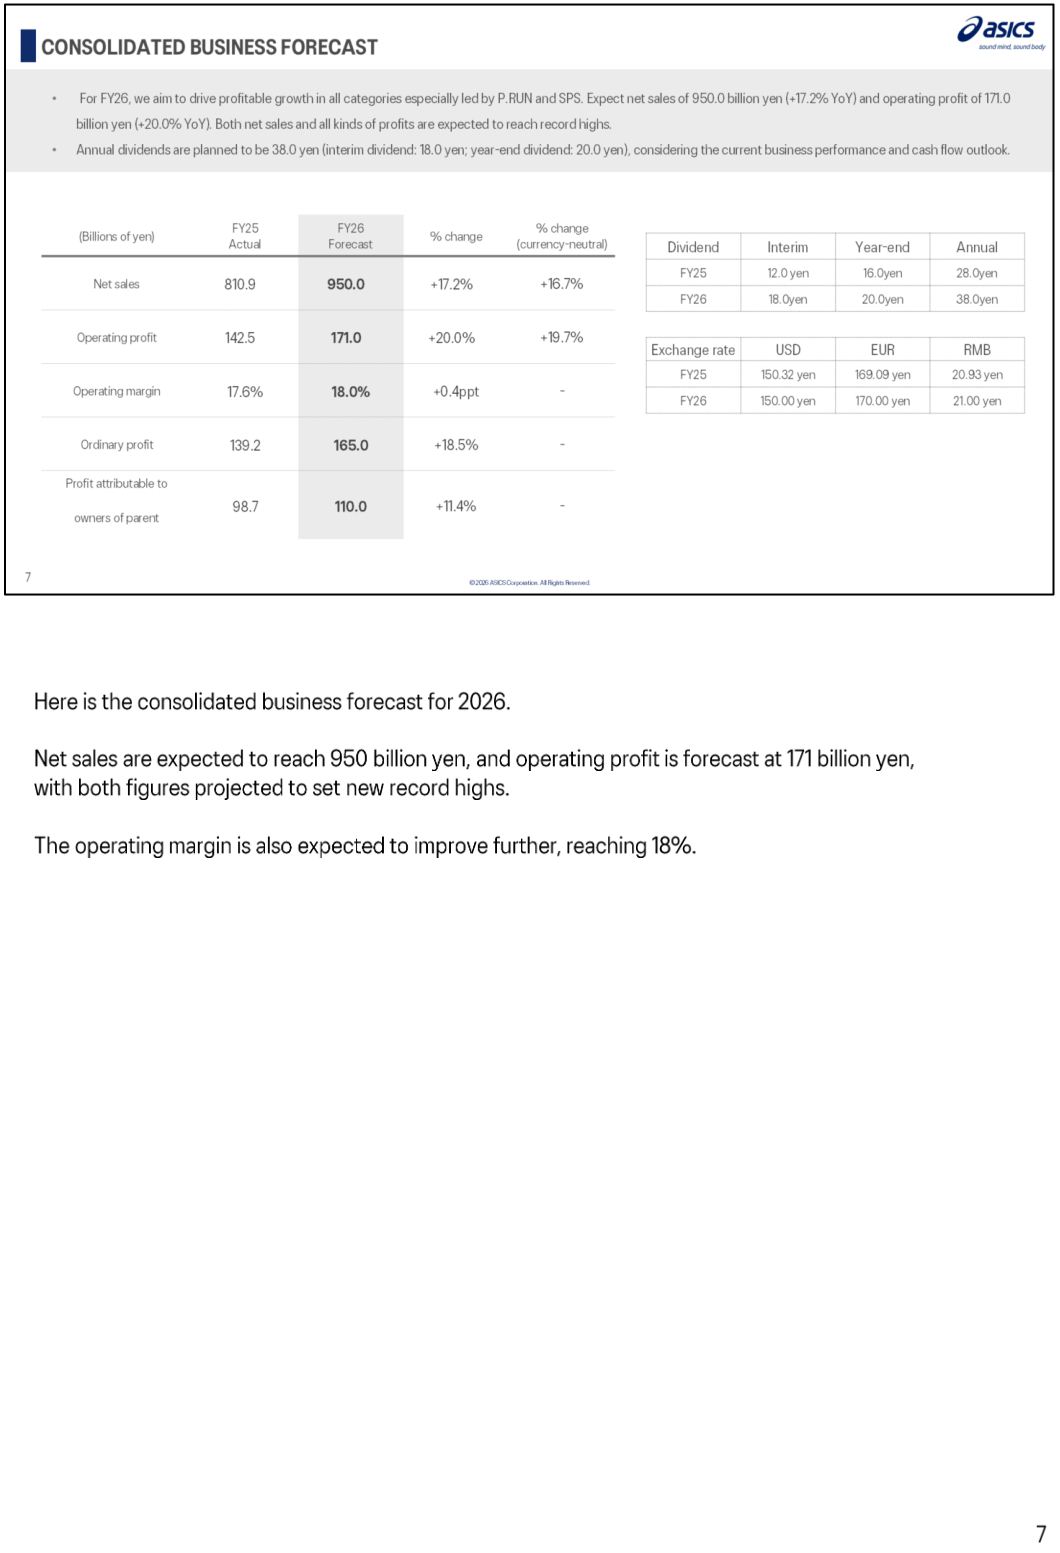
For FY26, ASICS aims to drive profitable growth in all categories, led especially by P.RUN and SPS. It forecasts net sales of 950.0 billion yen (+17.2%, or +16.7% currency-neutral) and operating profit of 171.0 billion yen (+20.0%, or +19.7% currency-neutral), with the operating margin improving 0.4ppt to 18.0%; ordinary profit is forecast at 165.0 billion yen (+18.5%) and profit attributable to owners of parent at 110.0 billion yen (+11.4%). All profit lines are expected to reach record highs. The gross margin is forecast to improve 0.3ppt to 57.1%, with selling price optimization adding 1.2ppt and additional tariffs subtracting 0.9ppt, while SG&A expenses are forecast at 371.0 billion yen, an increase of 52.9 billion yen, keeping the SG&A to sales ratio at 39.1% — below 40% for a second consecutive year. By category, FY26 net sales are forecast at 415.0 billion yen for P.RUN, 205.0 billion yen for SPS and 152.0 billion yen for OT; from FY2026 the “Apparel & Equipment (APEQ)” category is renamed “Apparel (AP)”. Assumed exchange rates are 150.00 yen to the USD, 170.00 yen to the EUR and 21.00 yen to the RMB. As an early indicator, preliminary January 2026 net sales came in at a record monthly high of 99.7 billion yen, up 25.5% year on year (+17.3% currency-neutral).
| Item (billions of yen) | FY26 Forecast | FY25 Actual | % change |
|---|---|---|---|
| Net sales | 950.0 | 810.9 | +17.2% |
| Operating profit | 171.0 | 142.5 | +20.0% |
| Operating margin | 18.0% | 17.6% | +0.4ppt |
| Ordinary profit | 165.0 | 139.2 | +18.5% |
| Profit attributable to owners of parent | 110.0 | 98.7 | +11.4% |
| Annual dividend per share | 38.0 yen | 28.0 yen | – |
| Assumed rate: USD | 150.00 yen | 150.32 yen | – |
| Assumed rate: EUR | 170.00 yen | 169.09 yen | – |
| Assumed rate: RMB | 21.00 yen | 20.93 yen | – |
Shareholder Returns
The FY2025 year-end dividend is 16.0 yen per share, in line with the previously disclosed forecast, bringing the FY2025 annual dividend to 28.0 yen per share (interim 12.0 yen). For FY2026, ASICS plans an annual dividend of 38.0 yen per share, made up of an interim dividend of 18.0 yen and a year-end dividend of 20.0 yen. The company describes this as a planned 10 yen increase and a record high after considering the stock split, decided in light of current business performance and the cash flow outlook. In addition, during FY2025 ASICS executed two treasury share repurchases totaling 50.0 billion yen; even so, steady accumulation of net income raised the equity ratio by 1.4ppt year on year.
Mid-Term Plan and Topics
FY2026 is the final year of ASICS’ Mid-Term Plan 2026, which management describes as a critically important year for translating its initiatives into tangible outcomes while preparing for the next stage of growth. Under the concept “Ahead of the Game,” management is currently formulating a vision looking ahead to 2035, and on that basis will finalize the next Mid-Term Plan, which it plans to announce in the fourth quarter of 2026. ASICS has positioned 2026 as the “Year of ASIA,” leveraging the Aichi–Nagoya 2026 events to be held in the autumn, and aims to achieve net sales exceeding USD 100 million in each Southeast and South Asian country at an early stage. In the digital domain, EC sales rose to 148.4 billion yen (+8.3%, or +26.3% excluding North America where strategic narrowing is underway) and OneASICS membership reached 23.13 million, from 17.64 million in 2024. On the supply chain, FY2025 work covered lifecycle-based inventory discipline, tighter production–sales alignment and automation at distribution centers in Germany and Australia; FY2026 priorities are a more resilient year-round supply platform and global standardization of core business processes. Looking back on FY2025, the company also cited the opening of Onitsuka Tiger flagship stores in Barcelona, London and Paris, the establishment of the ASICS Foundation, the “Year of JAPAN” initiative around the World Athletics Championships Tokyo 2025 and the 25th Summer Deaflympics Tokyo 2025, and external recognition including the IR Grand Prix at the IR Award 2025 and the Grand Prize Company award at Corporate Governance of the Year 2025.
This article is an analysis based on publicly available information and is not a recommendation to buy or sell any specific securities. Investment decisions are your own responsibility.
![[Obayashi] Investors’ Guide 2026 — The Complete 24-Article Breakdown](https://japan-equity.com/wp-content/uploads/2026/07/hub_cover-1024x1024.png)
![[Obayashi] IR & SR Policy — Feeding Dialogue Back into Management](https://japan-equity.com/wp-content/uploads/2026/07/p32_sq-1024x1024.jpg)
![[Obayashi] Real Estate Development — 18.7% Margin, ¥287.7bn Unrealized Gains](https://japan-equity.com/wp-content/uploads/2026/07/p20_sq-1024x1024.jpg)
![[Obayashi] Domestic Civil Engineering — Resilience Spending Supports 9.6% Margin](https://japan-equity.com/wp-content/uploads/2026/07/p11_sq-1024x1024.jpg)
![[Obayashi] Share Price & External Ratings — vs TOPIX, ESG Index Inclusion](https://japan-equity.com/wp-content/uploads/2026/07/p40_sq-1024x1024.jpg)
![[Construction] ¥75.5tn Investment, Shrinking Workforce — Big-5 Market Share](https://japan-equity.com/wp-content/uploads/2026/07/p12_sq-1024x1024.jpg)



![[Obayashi] Capital Policy & Shareholder Returns — ROE 10%+, DOE ~5%, ¥100bn Buyback](https://japan-equity.com/wp-content/uploads/2026/07/p27_sq-1024x1024.jpg)
![[Obayashi] Reducing Cross-Shareholdings — ¥285.2bn Sold in Five Years](https://japan-equity.com/wp-content/uploads/2026/07/p29_sq-1024x1024.jpg)
![[Obayashi] ¥750bn Investment Plan — ¥300bn to Development, ¥190bn to Tech/DX](https://japan-equity.com/wp-content/uploads/2026/07/p30_sq-1024x1024.jpg)
![[Obayashi] MTP2022 KPIs — Operating Profit ~2x Target, ROE 14.4%](https://japan-equity.com/wp-content/uploads/2026/07/p25_sq-1024x1024.jpg)
![[Obayashi] Cash Allocation — ¥420bn Investment CF Over Five Years](https://japan-equity.com/wp-content/uploads/2026/07/p26_sq-1024x1024.jpg)
![[Obayashi] Green Energy — 44 Plants, 344MW, and the Green Hydrogen Challenge](https://japan-equity.com/wp-content/uploads/2026/07/p21_sq-1024x1024.jpg)
![[Obayashi] Tackling the Labor Shortage — Robotics Construction®](https://japan-equity.com/wp-content/uploads/2026/07/p14_sq-1024x1024.jpg)
