
This article is based on publicly available IR materials and is not a recommendation to buy or sell any specific securities.
Note: The company’s own materials label the fiscal year ended March 31, 2026 as “FYE2026” and the forecast year ending March 31, 2027 as “FYE2027”; this article follows japan-equity.com’s convention of referring to the most recently completed full fiscal year as FY2025. Table and segment labels below retain the source material’s original FYE notation.
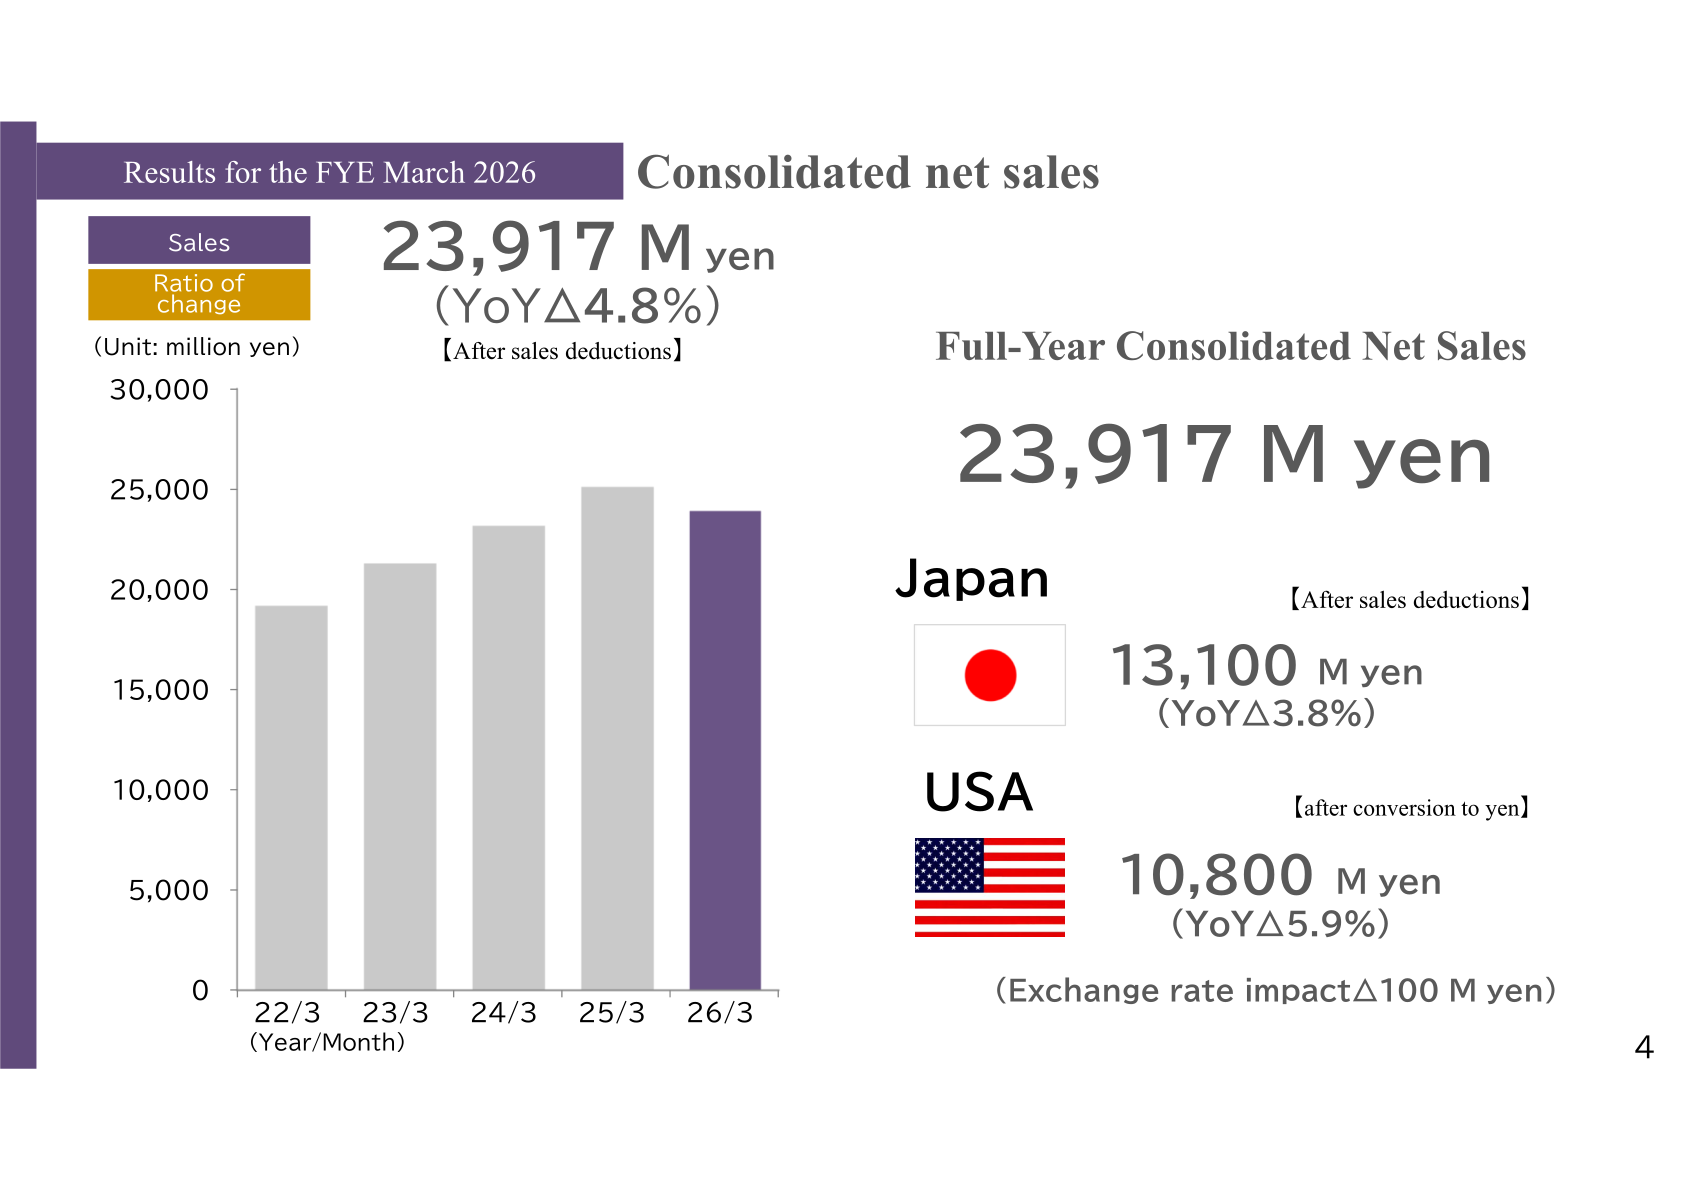
Japan Medical Dynamic Marketing, INC. (JMDM) reported consolidated net sales of ¥23,917 million for the fiscal year ended March 31, 2026, down 4.8% year on year. Operating profit fell 63.1% to ¥574 million and ordinary profit fell 64.1% to ¥534 million, while net profit attributable to owners of parent turned positive at ¥263 million versus a net loss of ¥461 million a year earlier. The company attributed the sales decline mainly to a drop in surgical case acquisition at certain Japanese hospitals following a series of media reports involving the company, combined with higher manufacturing and procurement costs, including U.S. tariff impacts. JMDM also disclosed that it currently falls short of the Tokyo Stock Exchange Prime Market’s tradable share market capitalization requirement and is preparing a contingency application to move to the Standard Market.
Consolidated Results (Full-Year Actual)
Net sales declined 4.8% to ¥23,917 million. The cost of sales ratio deteriorated 3.2 percentage points to 40.9% (from 37.7% a year earlier), while SG&A expenses fell 3.7% to ¥13,567 million (56.7% of sales) on cost-control initiatives. Operating profit fell 63.1% to ¥574 million and ordinary profit fell 64.1% to ¥534 million. Net profit attributable to owners of parent was ¥263 million, an improvement of ¥724 million from the prior year’s net loss of ¥461 million.
| Item | FYE2026 (Actual) | FYE2025 (Actual) | YoY Change |
|---|---|---|---|
| Net sales | ¥23,917 million | ¥25,114 million | -4.8% |
| Cost of sales | ¥9,775 million (40.9% of sales) | ¥9,467 million (37.7% of sales) | +3.3% |
| SG&A expenses | ¥13,567 million (56.7% of sales) | ¥14,090 million (56.1% of sales) | -3.7% |
| Operating profit | ¥574 million (2.4% of sales) | ¥1,555 million (6.2% of sales) | -63.1% |
| Ordinary profit | ¥534 million (2.2% of sales) | ¥1,488 million (5.9% of sales) | -64.1% |
| Net profit attributable to owners of parent | ¥263 million (1.1% of sales) | -¥461 million (-1.8% of sales) | +¥724 million |
Regional and Product Segment Results
In Japan, net sales fell 3.8% to ¥13,109 million. The company attributed this mainly to a decline in the number of surgical cases acquired at certain hospitals, particularly from the fourth quarter onward, following a series of media reports concerning the company, which reduced net sales by ¥524 million (-3.8%) year on year; a 2025 reimbursement price reduction further reduced net sales by ¥66 million (-0.5%) year on year. Within Japan, Joint product sales fell 6.4% to ¥4,904 million, reflecting fewer cases acquired for both artificial hip and knee joint procedures at certain hospitals. Trauma sales fell 4.5% to ¥4,444 million, as sales of Screws & Plates were affected by a shipment suspension caused by inventory shortages and a decline in surgical procedures amid extreme heat, while the PHS product grew. Spine sales fell 1.4% to ¥3,493 million, as continued double-digit growth in the KMC Balloon Kyphoplasty product was offset by a decline in Pedicle Screw and other products.
In the U.S., total sales fell 5.0% to $71.5 million (down 5.9% in yen terms to ¥10,807 million, reflecting yen appreciation to an average rate of ¥150.98/US$ from ¥152.50/US$ a year earlier). Knee joint sales fell 8.5% to $47.5 million: the flagship BKS TriMax product slightly decreased, and the BKS Revision Knee product declined by double digits amid delivery delays for certain outsourced components, with recovery expected from the second quarter of the fiscal year ending March 2027. Hip joint sales grew 2.0% to $23.2 million, driven by rapid growth of the newly launched Trivicta Hip Stem — which began its nationwide U.S. rollout in the third quarter of the fiscal year — partly offset by a decline in Entrada Hip Stem case acquisitions. (Knee and Hip Joint figures exclude sales of “KASM” for DePuy Synthes.)
| Region / Product | FYE2026 (Actual) | FYE2025 (Actual) | YoY Change |
|---|---|---|---|
| Japan (Total) | ¥13,109 million | ¥13,634 million | -3.8% |
| Joint | ¥4,904 million | ¥5,237 million | -6.4% |
| Trauma | ¥4,444 million | ¥4,653 million | -4.5% |
| Spine | ¥3,493 million | ¥3,543 million | -1.4% |
| Others | ¥432 million | ¥407 million | +6.0% |
| U.S. (Total, in yen) | ¥10,807 million | ¥11,479 million | -5.9% |
| U.S. Joint (yen) | ¥10,774 million | ¥11,449 million | -5.9% |
| U.S. Spine (yen) | ¥32 million | ¥30 million | +6.2% |
| U.S. Total (USD) | $71.5 million (US$71,579 thousand) | US$75,279 thousand | -4.9% |
| U.S. Knee Joint (USD) | $47.5 million | n/a | -8.5% |
| U.S. Hip Joint (USD) | $23.2 million | n/a | +2.0% |
| Consolidated Total | ¥23,917 million | ¥25,114 million | -4.8% |
Key Factors Behind the Profit Decline
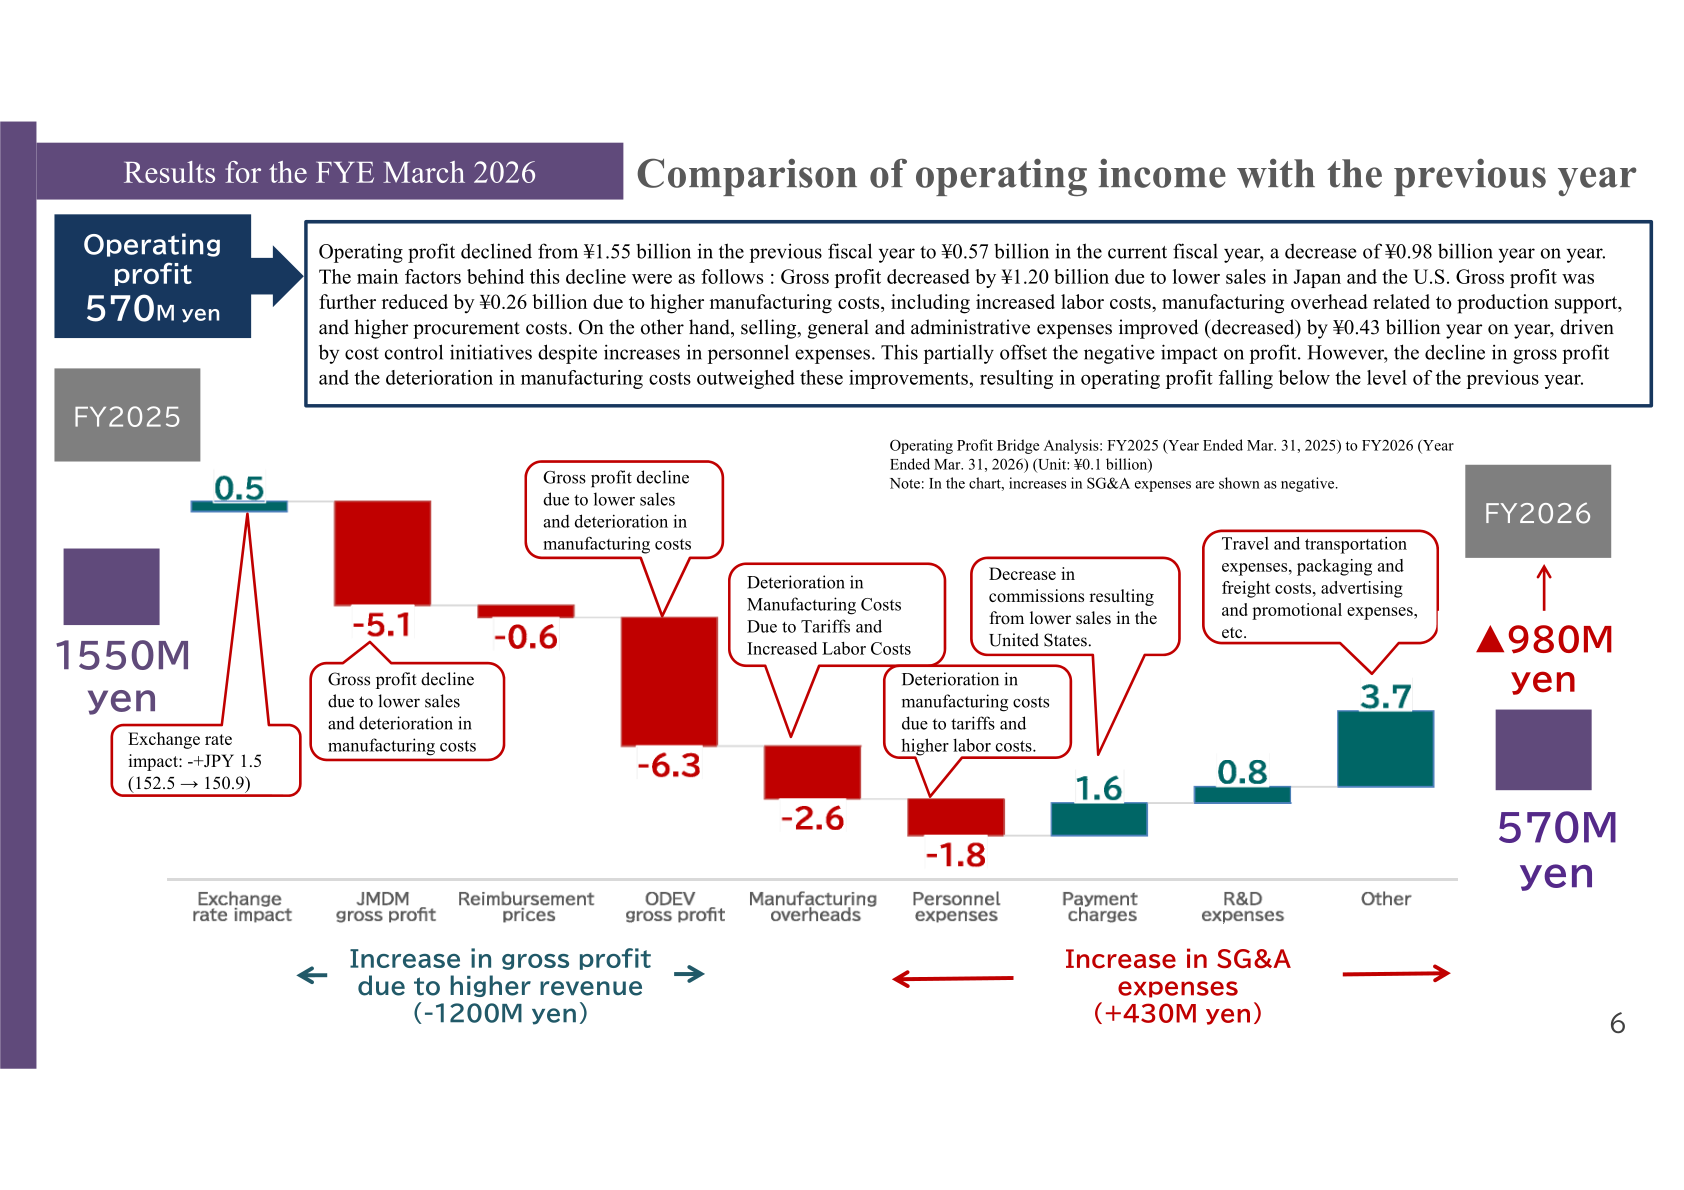
Operating profit fell ¥981 million (-63.1%) year on year to ¥574 million. According to the company, gross profit fell by approximately ¥1.20 billion due to lower sales in Japan and the U.S., and was further reduced by approximately ¥0.26 billion from higher manufacturing costs, including increased labor costs, manufacturing overhead related to production support, and higher procurement costs. These declines were partially offset by a ¥0.43 billion year-on-year improvement in SG&A expenses, driven by cost-control initiatives despite an increase in personnel expenses. The cost of sales ratio deteriorated 3.2 percentage points to 40.9%, which the company attributed to a lower share of in-house product sales in Japan (JMDM) and to higher manufacturing and manufacturing-overhead costs in the U.S. (ODEV). The impact of U.S. reciprocal tariffs on cost of sales in the year was approximately ¥69 million (US$463 thousand).
Compliance and Governance Response
Following a series of reported incidents, the company established a special committee to conduct a root cause analysis, which identified insufficient internal controls, checks and balances, and supervisory systems; a sales-division evaluation system overly focused on achieving sales targets; and an insufficiently developed corporate culture emphasizing compliance adherence. Preventive measures under implementation include expanding legal and compliance functions, strengthening compliance training and awareness programs, enhancing approval processes for interactions with healthcare professionals and related parties, revising the sales department’s performance evaluation system, and suspending dinners with healthcare professionals and scholarship donations. The company has also launched the “KIZUNA” project to establish new behavioral principles aimed at rebuilding an organization capable of ensuring strict compliance and making autonomous, appropriate decisions, positioning compliance as a top management priority focused on restoring trust.
FY2026 Forecast (FYE March 2027 per company materials)
For the fiscal year ending March 31, 2027, JMDM forecasts consolidated net sales of ¥25,370 million, up 6.1% year on year, but operating profit of ¥430 million, down 25.1%; ordinary profit of ¥140 million, down 73.8%; and net profit of ¥60 million, down 77.2%. The forecast assumes an average exchange rate of ¥155.0/US$ (versus an actual average of ¥150.98/US$ in the year just ended); the company estimates that a ¥1 change in the yen/dollar rate affects operating profit by approximately ¥30 million. The forecast also reflects an estimated ¥60 million year-on-year deterioration (0.5 percentage points) in the cost of sales ratio from U.S. reciprocal tariffs, estimated at US$1.5 million, partially offset by an estimated ¥50 million improvement (0.4 percentage points) from reduced amortized cost.
| Item | FYE2027 (Forecast) | FYE2026 (Actual) | YoY Change |
|---|---|---|---|
| Net sales | ¥25,370 million | ¥23,917 million | +6.1% |
| Cost of sales | ¥10,410 million (41.0% of sales) | ¥9,775 million (40.9% of sales) | +6.5% |
| SG&A expenses | ¥14,530 million (57.3% of sales) | ¥13,567 million (56.7% of sales) | +7.1% |
| Operating profit | ¥430 million (1.7% of sales) | ¥574 million (2.4% of sales) | -25.1% |
| Ordinary profit | ¥140 million (0.6% of sales) | ¥534 million (2.2% of sales) | -73.8% |
| Net profit | ¥60 million (0.2% of sales) | ¥263 million (1.1% of sales) | -77.2% |
Shareholder Returns
JMDM’s stated capital policy is a stable dividend with a payout ratio of 30% or higher. For the fiscal year ended March 31, 2026, the actual dividend payout ratio was 157.4%, reflecting the sharp decline in net profit relative to the dividend paid. This document does not disclose the specific per-share dividend amount.
Medium-Term Plan — Rolling Plan 2029 (“RT500”)
JMDM’s long-term vision, “RT500,” is being pursued through a “Rolling Plan 2029,” with the fiscal year ending March 2027 positioned as a turning point toward profitability improvement. The plan targets consolidated net sales of ¥27,500 million and operating profit of ¥1,000 million (3.6% margin) for the fiscal year ending March 2028, rising to net sales of ¥30,000 million and operating profit of ¥1,500 million (5.0% margin) for the fiscal year ending March 2029, together with ROE of 3.9% and ROIC of 3.3% targeted by FYE2029. This compares with the company’s original guidance for the year just ended (net sales of ¥26,400 million and operating profit of ¥1,850 million), which was not achieved. Key initiatives include the SAICO Project (“Strategic Actionable Initiatives for Cost Optimization”), covering dual-sourcing at ODEV, procurement of China-made surgical instruments (achieving a 30% cost reduction versus U.S. manufacturing for certain instruments), and a shift of production for some Japan-market products to Asian regions including Malaysia to mitigate reciprocal tariff risk. The plan also includes a domestic strategy to restore sales and profitability through enhanced specialization, new product introductions, and AI-driven SG&A efficiency improvements, and a U.S. action plan targeting revenue of US$100 million through nationwide expansion of the Trivicta Hip Stem, supply-chain normalization, and manufacturing cost reduction.
| Item | FYE2026 (Actual) | FYE2027 (Forecast) | FYE2028 (Target) | FYE2029 (Target) |
|---|---|---|---|---|
| Net sales | ¥23,917 million | ¥25,370 million | ¥27,500 million | ¥30,000 million |
| Operating profit (margin) | ¥574 million (2.4%) | ¥430 million (1.7%) | ¥1,000 million (3.6%) | ¥1,500 million (5.0%) |
| Net profit | ¥263 million (1.2%) | ¥60 million (0.2%) | ¥500 million (1.8%) | ¥1,000 million (3.3%) |
| ROE | 1.1% | 0.2% | 2.0% | 3.9% |
| ROIC | 1.3% | 1.0% | 2.2% | 3.3% |
| Dividend payout ratio | 157.4% (actual) | Stable dividend, payout 30% or higher (policy) | Stable dividend, payout 30% or higher (policy) | Stable dividend, payout 30% or higher (policy) |
| Average exchange rate (Yen/US$) | 150.9 | 155.0 | 155.0 | 155.0 |
Non-Compliance with TSE Prime Market Listing Criteria
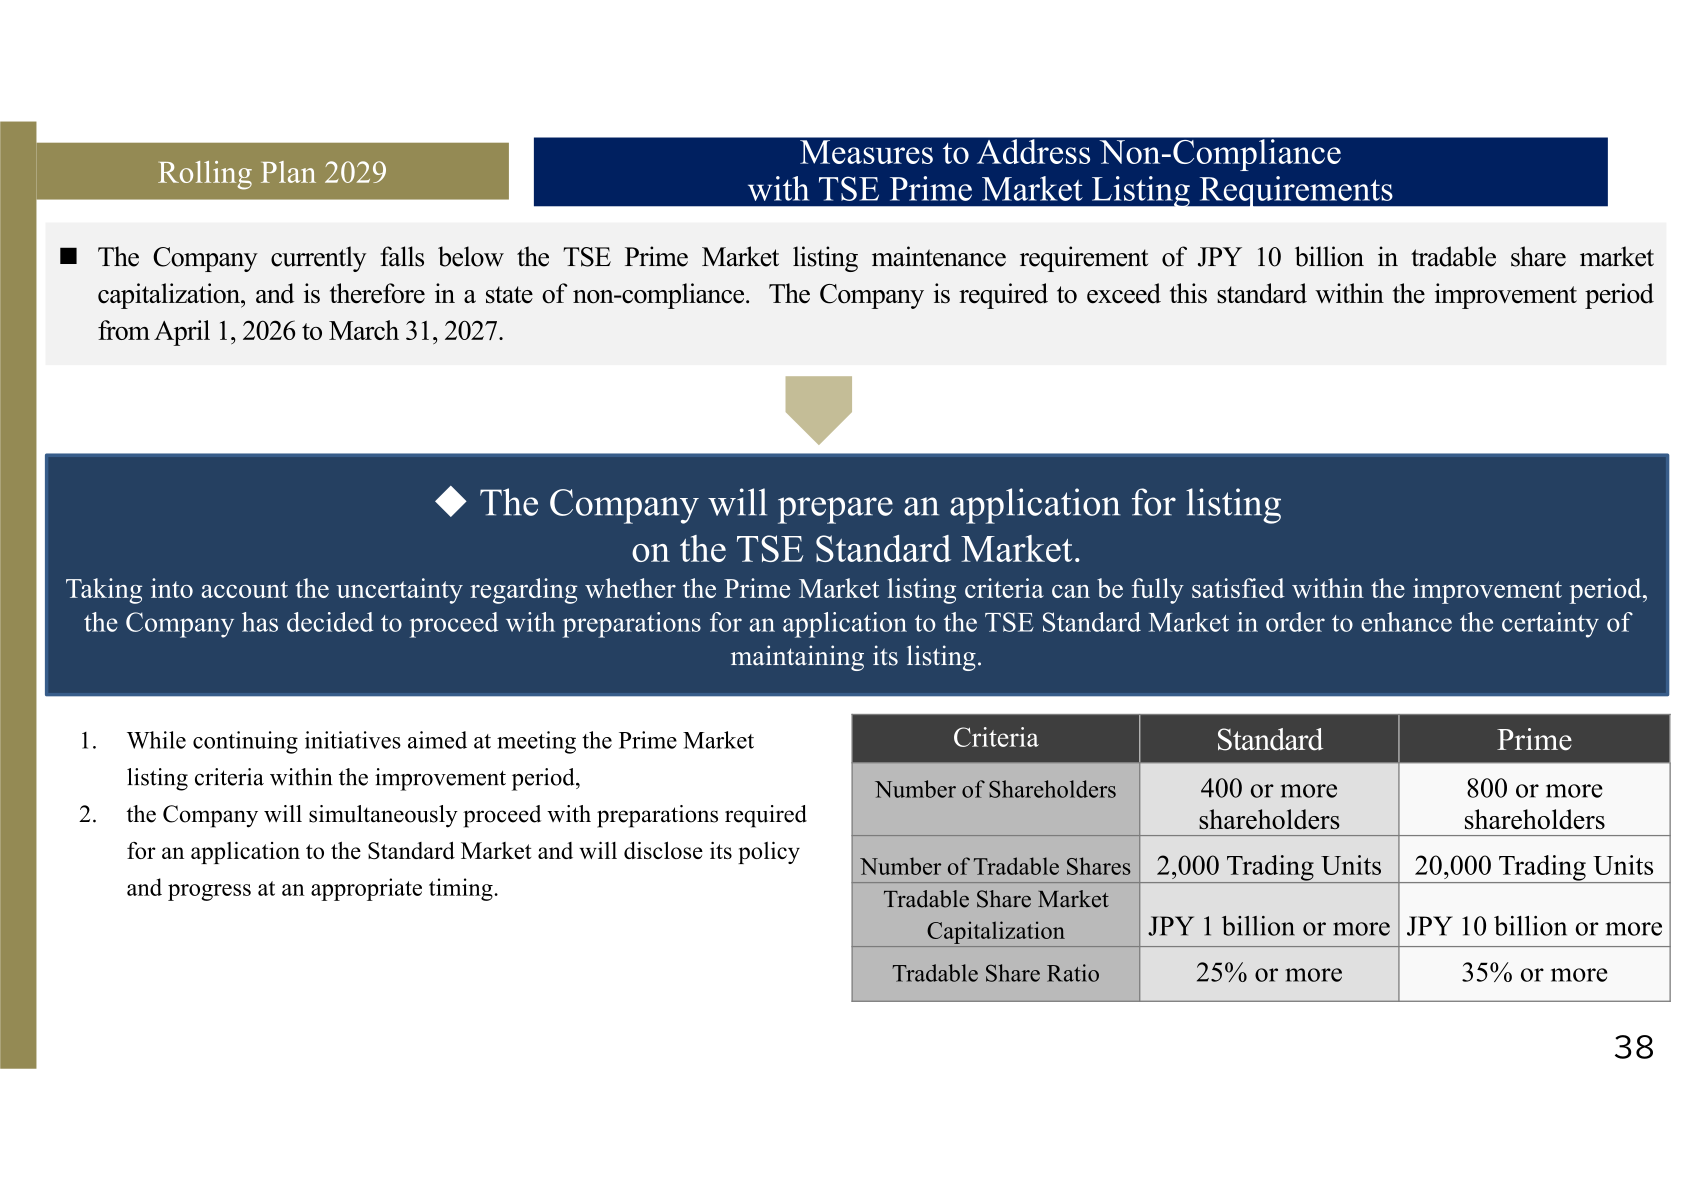
JMDM disclosed that it currently falls below the Tokyo Stock Exchange Prime Market’s tradable share market capitalization requirement of ¥10 billion or more, and is therefore in a state of non-compliance. It is required to exceed this standard within an improvement period running from April 1, 2026 to March 31, 2027. Citing uncertainty over whether the Prime Market criteria can be fully satisfied within that period, the company has decided to proceed with preparations for an application to the TSE Standard Market in order to enhance the certainty of maintaining its listing, while continuing initiatives aimed at meeting the Prime Market criteria in parallel and disclosing its policy and progress at an appropriate timing.
| Criteria | Standard Market Requirement | Prime Market Requirement |
|---|---|---|
| Number of Shareholders | 400 or more shareholders | 800 or more shareholders |
| Number of Tradable Shares | 2,000 trading units | 20,000 trading units |
| Tradable Share Market Capitalization | JPY 1 billion or more | JPY 10 billion or more |
| Tradable Share Ratio | 25% or more | 35% or more |
This article is an analysis based on publicly available information and is not a recommendation to buy or sell any specific securities. Investment decisions are your own responsibility.
















