
This article is based on publicly available IR materials and is not a recommendation to buy or sell any specific securities.
Note: In its English-language results presentation, IDOM labels the fiscal year ended February 28, 2026 as “FY2026”; this site classifies it as FY2025. All figures below follow the labels used in the company’s presentation dated April 14, 2026, “Financial Results for the Fiscal Year Ended February 28, 2026.”
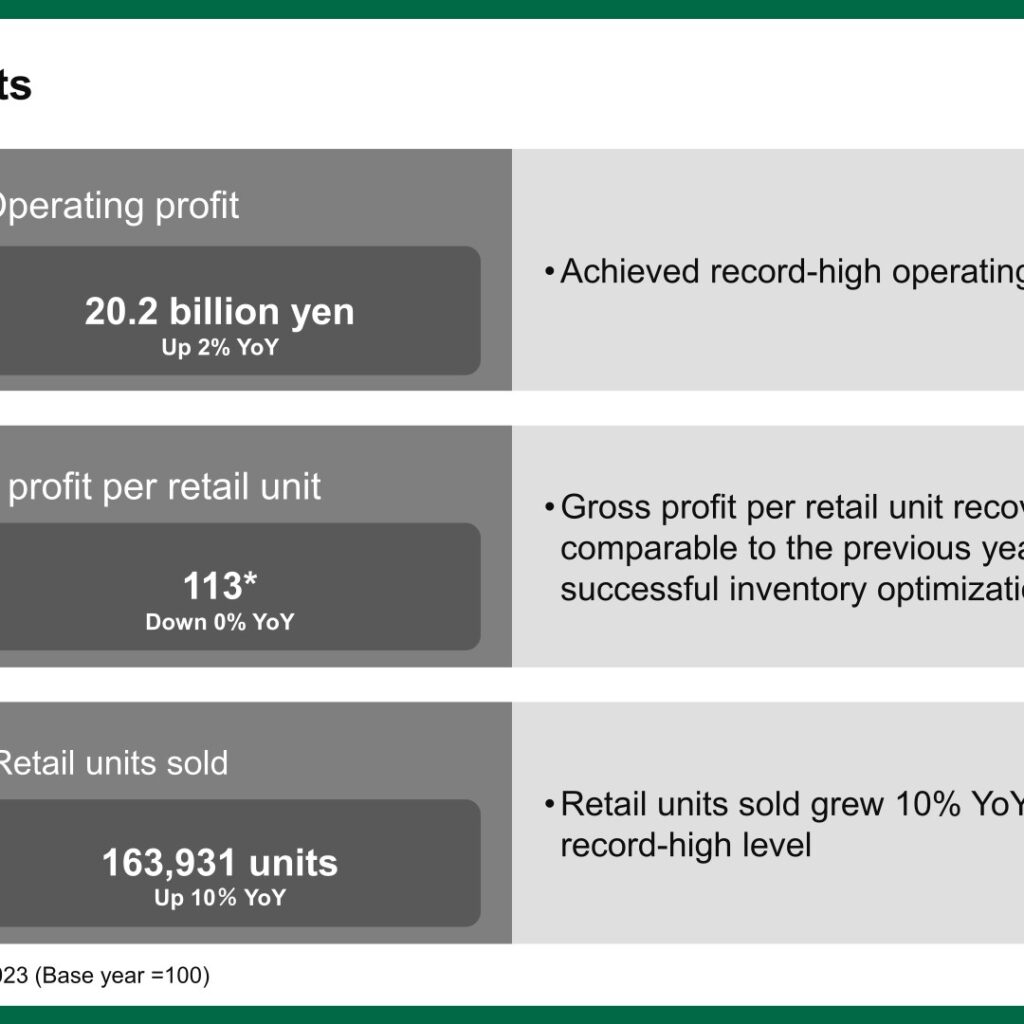
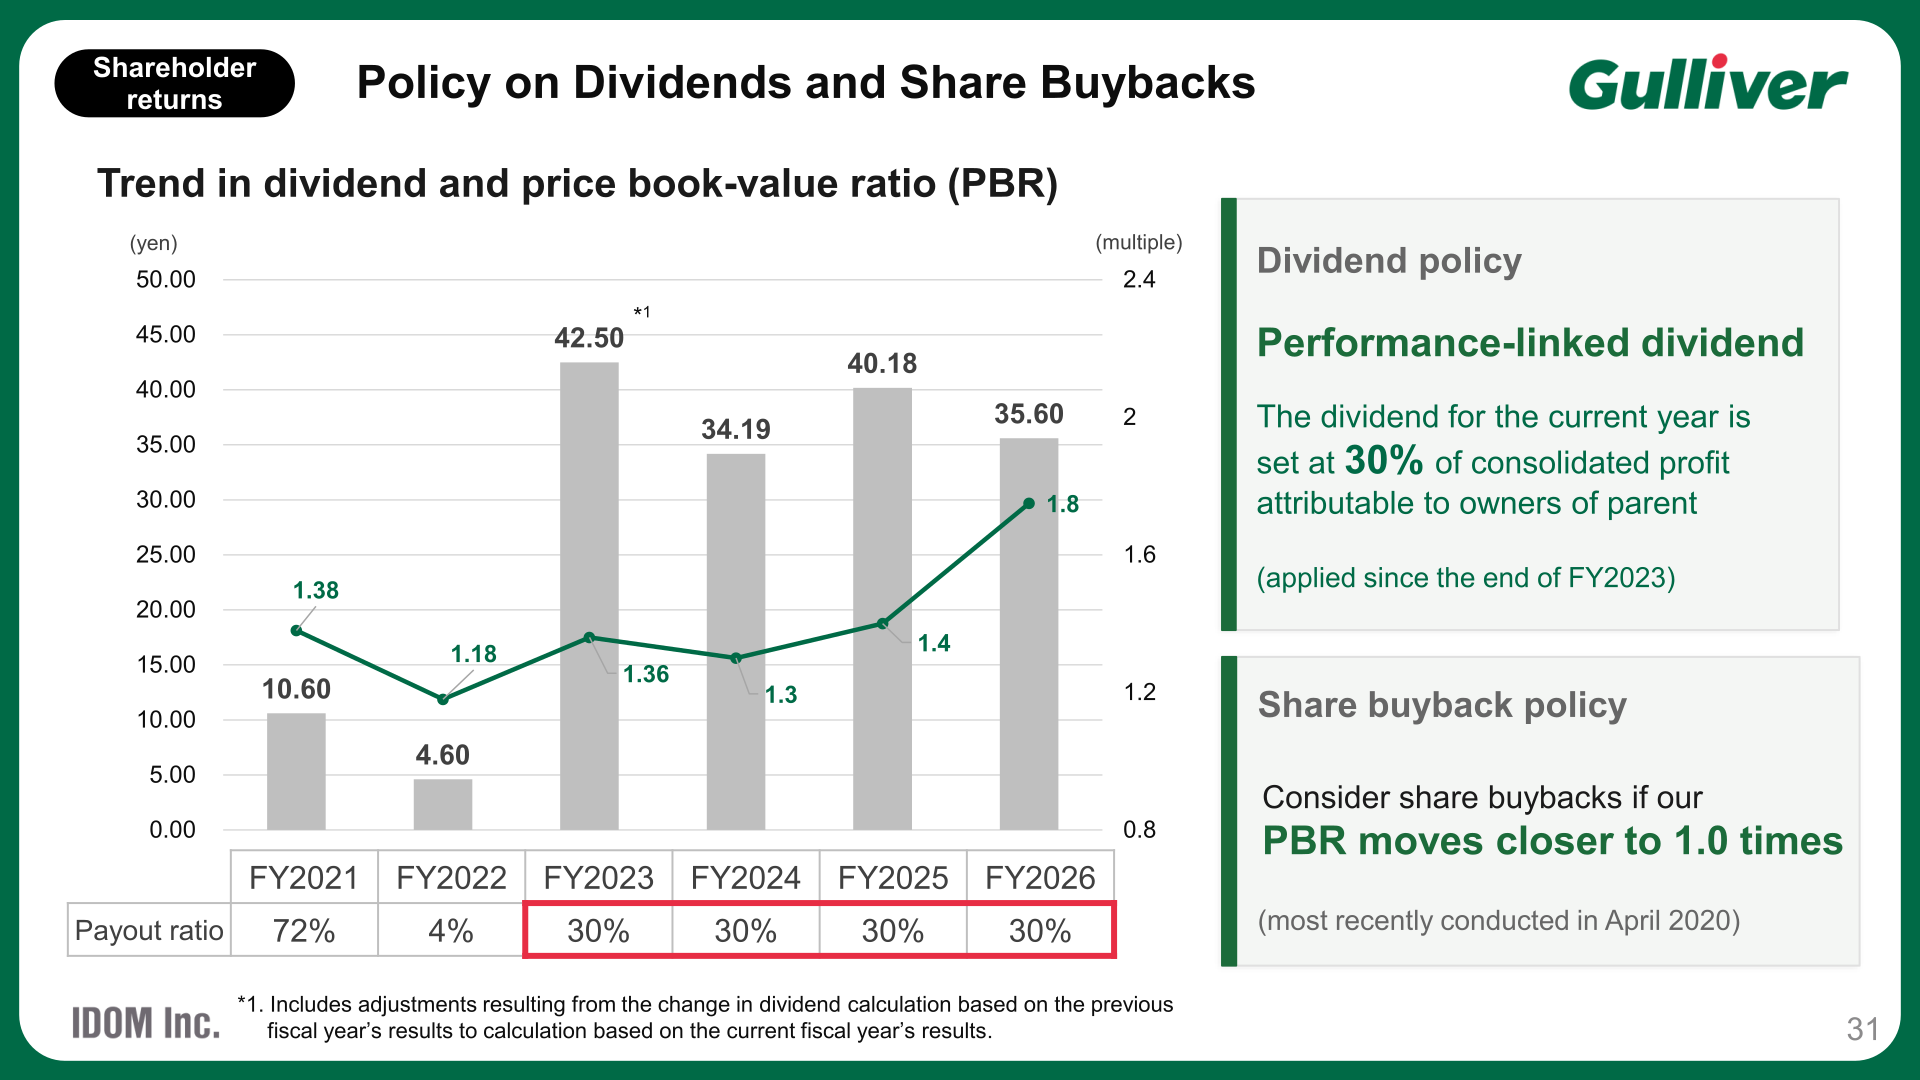
IDOM reported consolidated net sales of 562.8 billion yen for the fiscal year ended February 28, 2026, up 13.3% year on year, and operating profit of 20.2 billion yen, up 1.6% year on year and a record high, driven by a record 163,931 retail units sold, up 10% year on year. Ordinary profit declined 2.7% to 18.6 billion yen and profit attributable to owners of parent declined 11.4% to 11.9 billion yen. For the fiscal year ending February 28, 2027, IDOM forecasts net sales of 629.0 billion yen and operating profit of 24.0 billion yen, up 18.8% year on year. The annual dividend for the year under review was 35.60 yen per share, down from 40.18 yen in the previous fiscal year, under a policy of a payout ratio of 30% of profit attributable to owners of parent.
Consolidated Results (Full-Year Actual)
Net sales, gross profit, SG&A expenses, operating profit and EBITDA all increased year on year. Operating profit reached a record high. Ordinary profit and profit attributable to owners of parent both declined year on year.
| Item (billion yen) | FY2026 | FY2025 | Change (%) |
|---|---|---|---|
| Net sales | 562.8 | 496.7 | 13.3% |
| Gross profit | 96.3 | 88.7 | 8.6% |
| Selling, general and administrative expenses | 76.1 | 68.8 | 10.7% |
| Operating profit | 20.2 | 19.9 | 1.6% |
| Ordinary profit | 18.6 | 19.1 | (2.7%) |
| Profit attributable to owners of parent | 11.9 | 13.4 | (11.4%) |
| EBITDA | 24.4 | 23.1 | 5.6% |
Operating Profit Change Analysis and Major KPIs
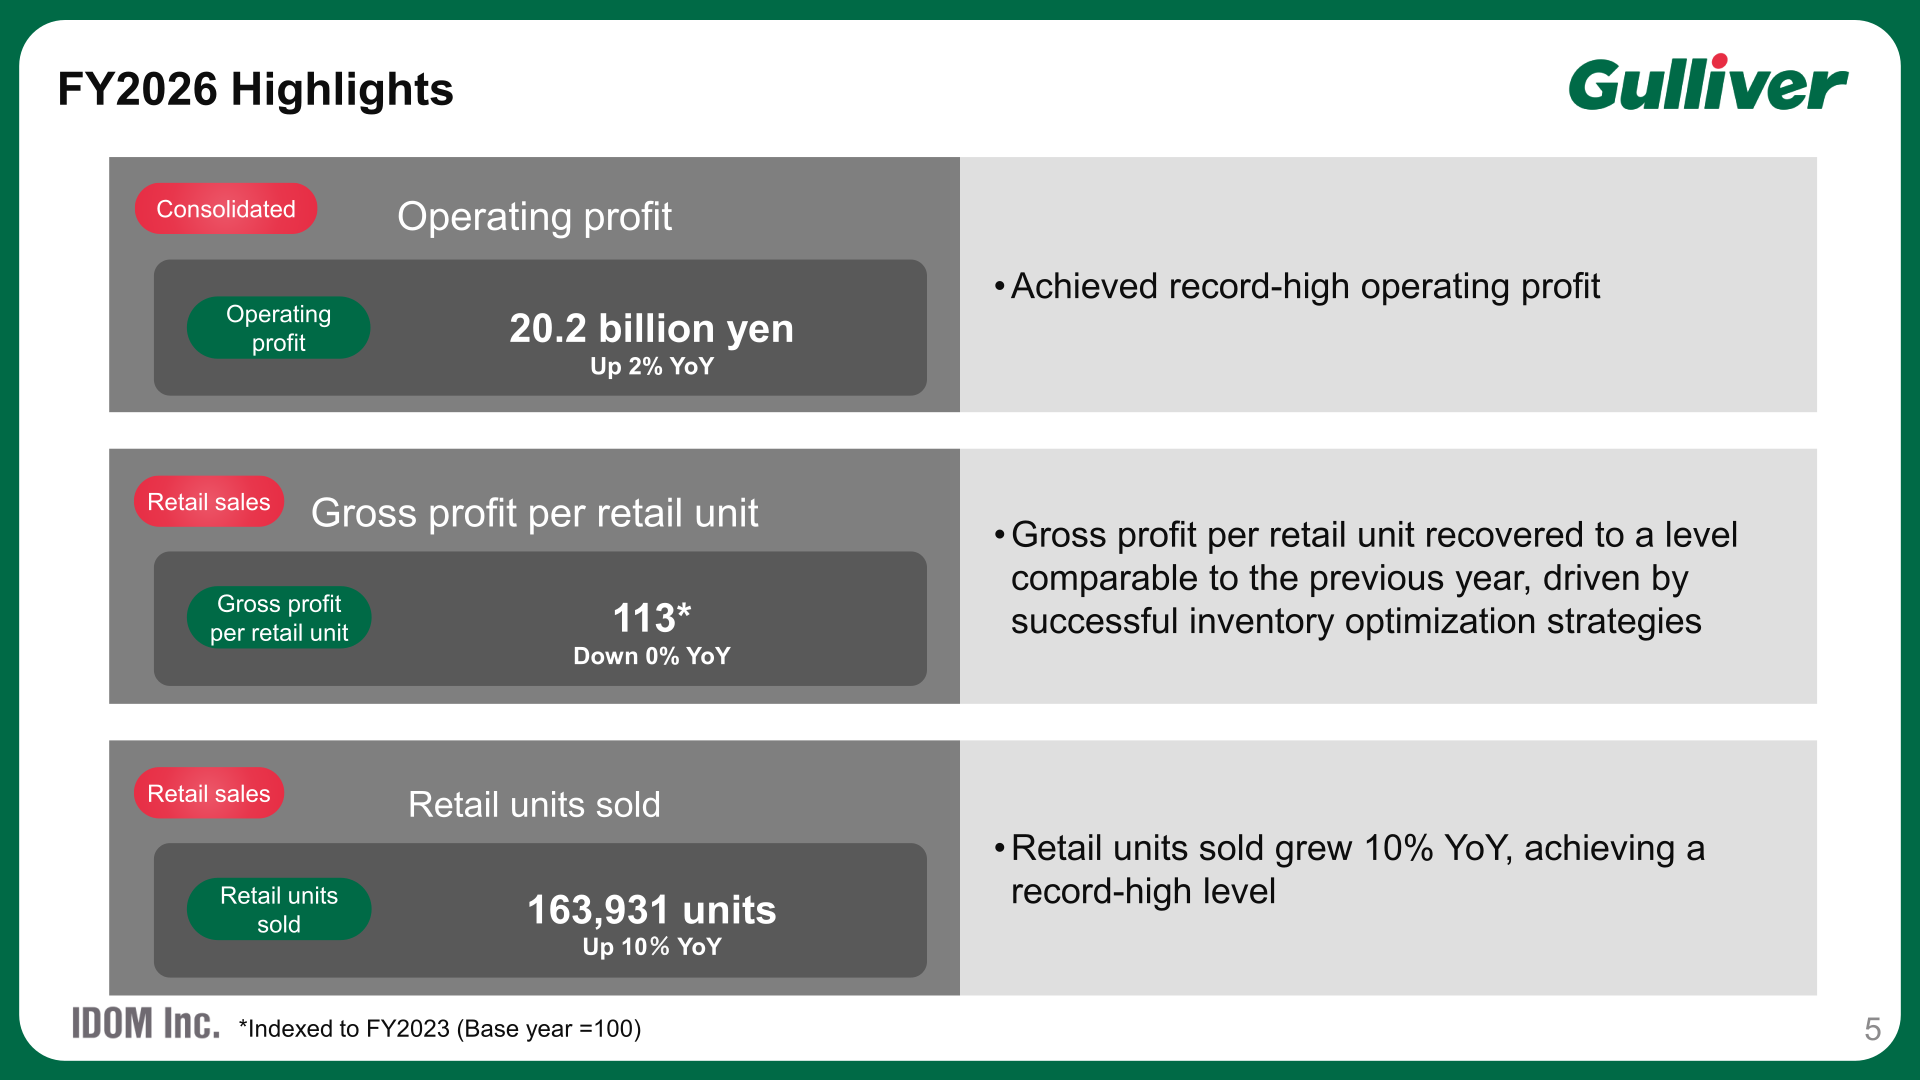
On a consolidated basis, operating profit increased 0.3 billion yen year on year to 20.2 billion yen. Retail sales contributed a 6.6 billion-yen increase, reflecting higher retail units sold, while wholesale sales decreased operating profit by 1.1 billion yen due to the continued impact of the first-half market downturn. Personnel and hiring expenses, costs relating to the opening of large stores, and SG&A expenses and other expenses each reduced operating profit, while subsidiaries remained profitable. In FY2026, the number of large stores opened was 17 (up 1 store year on year), retail units sold rose to 163.9 thousand units (up 14.9 thousand), and wholesale units sold rose to 152.0 thousand units (up 7.8 thousand).
| KPI | FY2024 | FY2025 | FY2026 | Change (FY2026 vs FY2025) |
|---|---|---|---|---|
| Opening of large stores (stores) | 11 | 16 | 17 | 1 |
| Retail units sold (thousand units) | 144.5 | 149.0 | 163.9 | 14.9 |
| Gross profit per retail unit (with 2023 as the base year = 100) | 101 | 113 | 113 | – |
| Wholesale units sold (thousand units) | 124.4 | 144.2 | 152.0 | 7.8 |
| Gross profit per wholesale unit (with 2023 as the base year = 100) | 104 | 120 | 109 | – |
FY2026 Full-Year Performance vs. Earnings Forecast
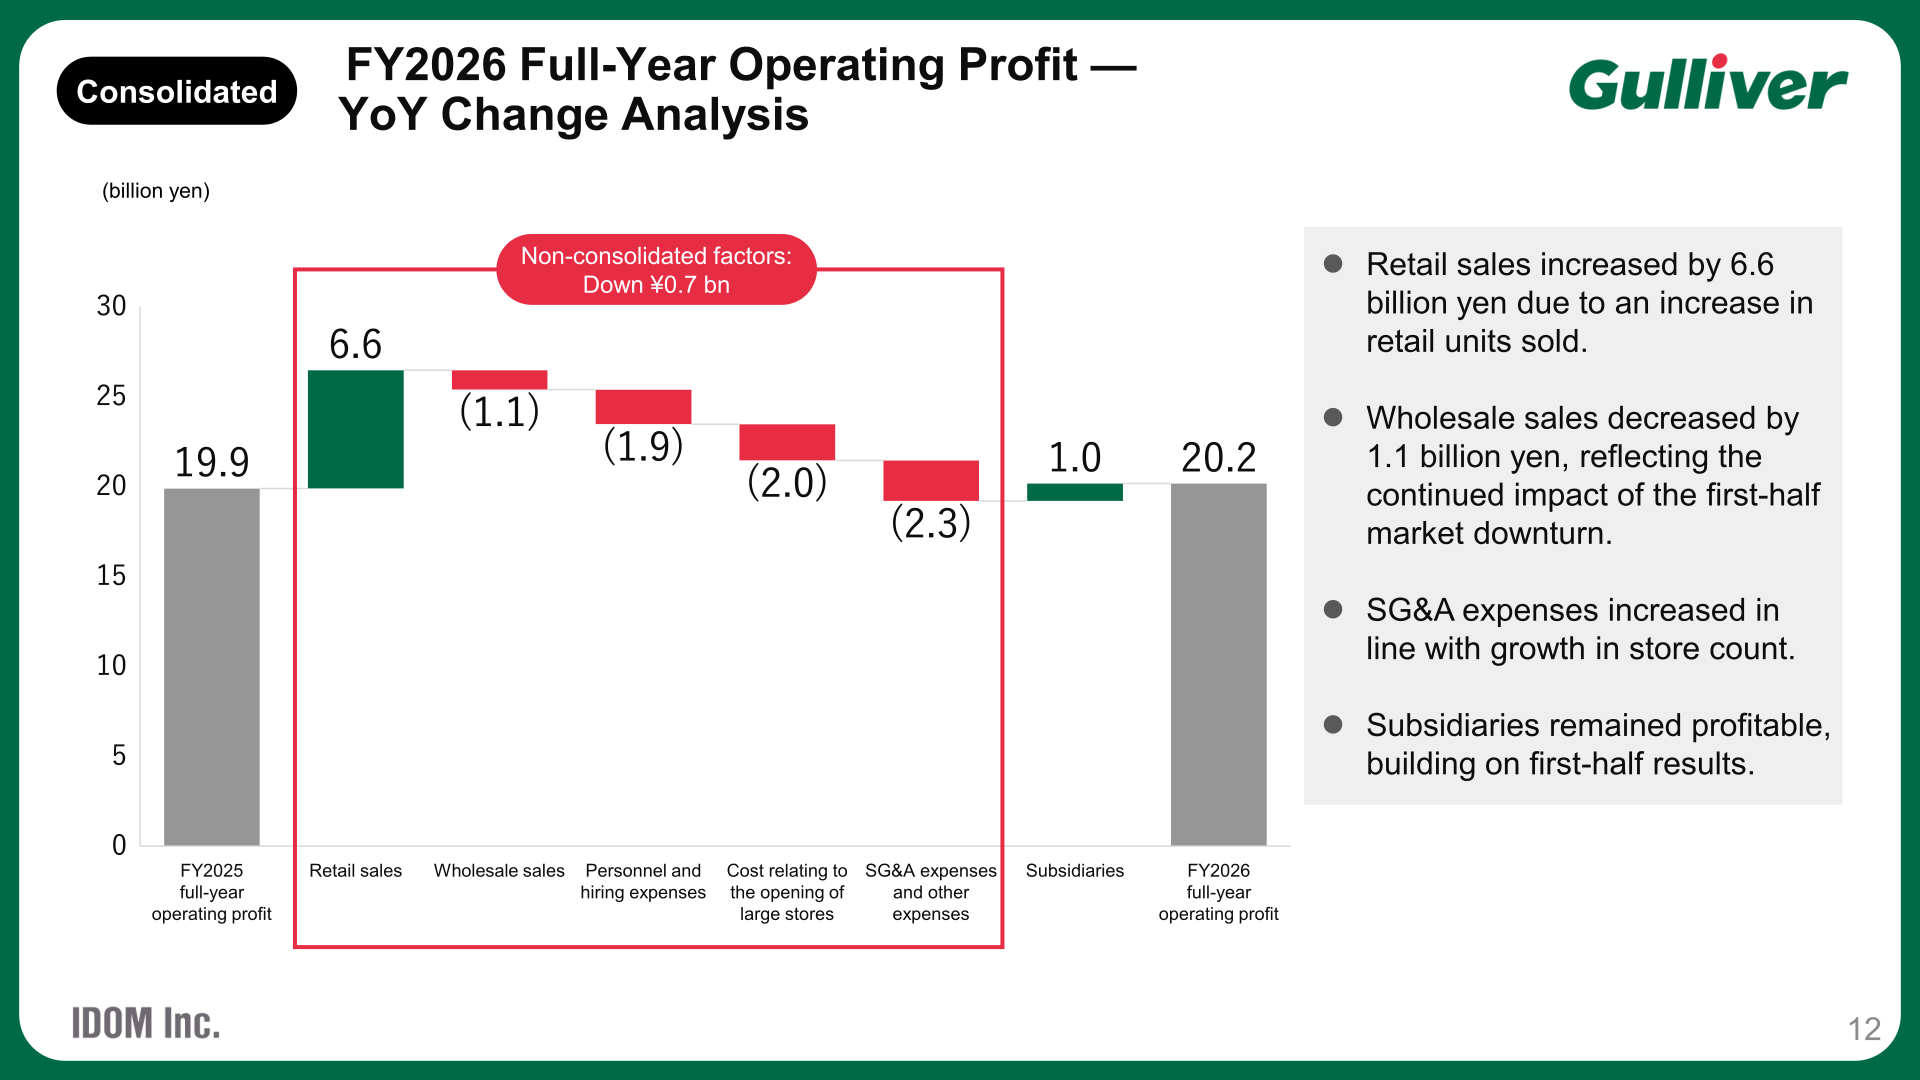
Against the full-year forecast, retail units sold came in below plan at 163.9 thousand units versus a forecast of 167.3 thousand units, while wholesale units sold exceeded the forecast of 145.0 thousand units, reaching 151.8 thousand units. Gross profit, SG&A expenses and operating profit all came in above the full-year forecast.
| Item | Full-year forecast | FY2026 full-year actual | Actual vs. forecast |
|---|---|---|---|
| Opening of large stores (stores) | 15 | 17 | 2 |
| Retail units sold (thousand units) | 167.3 | 163.9 | (3.4) |
| Gross profit per retail unit (with 2023 as the base year = 100) | 111 | 113 | – |
| Wholesale units sold (thousand units) | 145.0 | 151.8 | 6.8 |
| Gross profit per wholesale unit (with 2023 as the base year = 100) | 108 | 109 | – |
| Gross profit (billion yen) | 95.1 | 96.3 | 1.2 |
| Selling, general and administrative expenses (billion yen) | 75.0 | 76.1 | 1.1 |
| Operating profit (billion yen) | 20.1 | 20.2 | 0.1 |
FY2027 Forecast
IDOM forecasts net sales of 629.0 billion yen for the fiscal year ending February 28, 2027, up 11.8% year on year, and operating profit of 24.0 billion yen, up 18.8% year on year. The forecast excludes extraordinary factors, including the prolonged impact of war. Retail units sold are forecast to rise to 177 thousand units and wholesale units sold to 175 thousand units, with 10 additional large stores planned (bringing the cumulative total to 96 stores).
| Item (billion yen) | FY2026 | FY2027 Forecast | Change (%) |
|---|---|---|---|
| Net sales | 562.8 | 629.0 | 11.8% |
| Gross profit | 96.3 | 107.0 | 11.1% |
| Selling, general and administrative expenses | 76.1 | 83.0 | 9.0% |
| Operating profit | 20.2 | 24.0 | 18.8% |
| Ordinary profit | 18.6 | 22.4 | 20.4% |
| Profit attributable to owners of parent | 11.9 | 14.2 | 20.9% |
Shareholder Returns
IDOM’s dividend policy is a performance-linked dividend set at 30% of consolidated profit attributable to owners of parent, applied since the end of FY2023. The annual dividend for FY2026 was 35.60 yen per share (15.43 yen at the second-quarter end and 20.17 yen at year-end), down from 40.18 yen in FY2025. For FY2027, IDOM forecasts an annual dividend of 42.43 yen per share (21.06 yen at the second-quarter end and 21.37 yen at year-end), up 19.2% year on year. On share buybacks, the company states it will consider buybacks if its price book-value ratio (PBR) moves closer to 1.0 times; the most recent buyback was conducted in April 2020.
| Item | Q2-end | Year-end | Total |
|---|---|---|---|
| FY2025 results (previous fiscal year) | 19.38 yen | 20.80 yen | 40.18 yen |
| FY2026 results (fiscal year under review) | 15.43 yen | 20.17 yen | 35.60 yen |
| FY2027 (forecast) | 21.06 yen | 21.37 yen | 42.43 yen |
Medium-Term Business Plan
IDOM’s current medium-term business plan covers 2023 to 2027, with a next medium-term business plan planned for 2028 to 2030 and a subsequent one for 2031 to 2033. The target operating profit for the current medium-term business plan was revised upward from 21.0 billion yen to 30.0 billion yen in an upward revision made in April 2024. Under the plan, ROIC for FY2026 was 6.8%, against a WACC of 4.8%, resulting in an EVA spread of 2.0%, down from 3.7% in FY2025. As of February 28, 2026, IDOM operated 86 large stores, out of a store-opening policy target of a total of 100 large stores, with completion of the 100-store target now expected in 2028 due to construction delays.
This article is an analysis based on publicly available information and is not a recommendation to buy or sell any specific securities. Investment decisions are your own responsibility.
















