
This article is based on publicly available IR materials and is not a recommendation to buy or sell any specific securities.
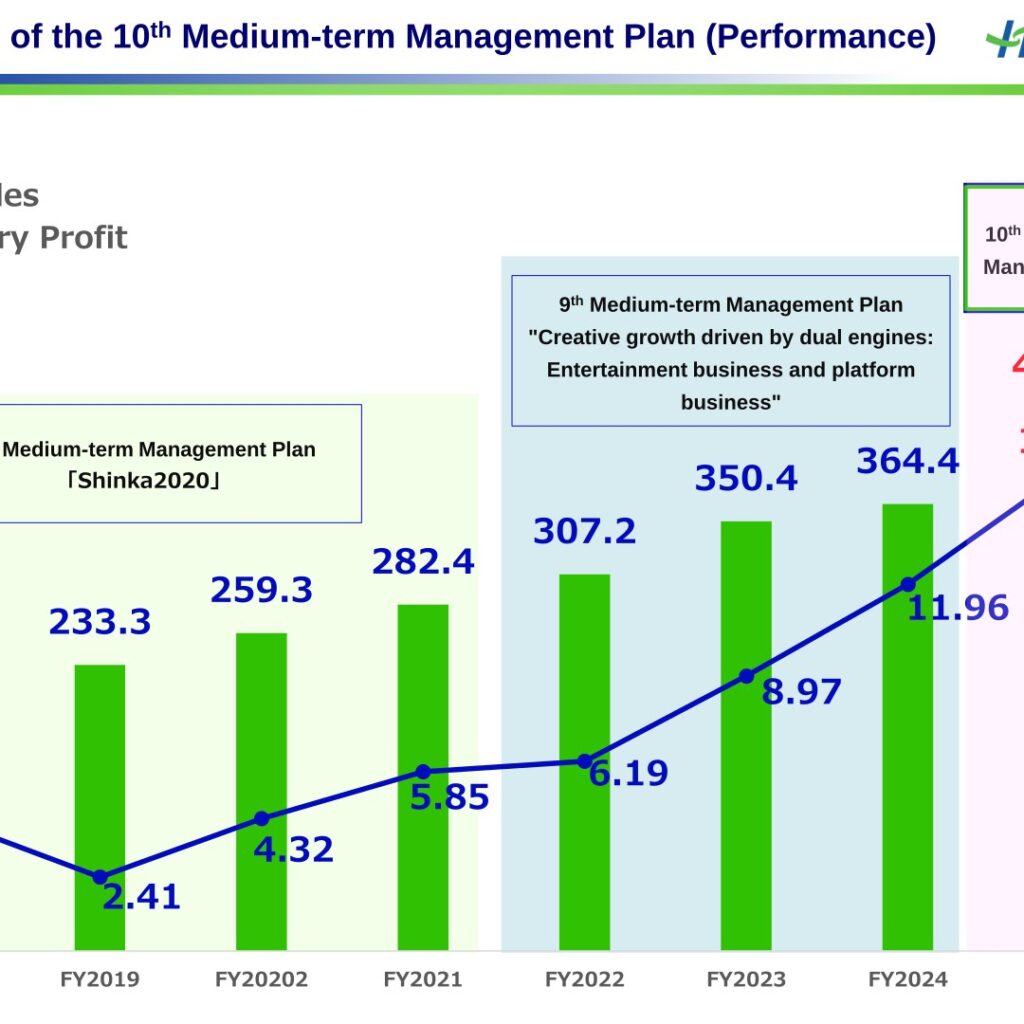
Happinet Corporation reported consolidated net sales of 439,052 million yen for Full Fiscal Year 2025 (Apr. 1, 2025 to Mar. 31, 2026), up 20.5% year on year, with operating profit of 15,590 million yen (up 33.5%) and ordinary profit of 15,701 million yen (up 31.2%). Profit attributable to owners of parent rose 49.2% to 10,096 million yen and earnings per share reached 230.91 yen. Growth was led by the Video-game business, where Nintendo’s “Nintendo Switch 2” and related software lifted net sales 52.5%, and by the Amusement business, where the capsule-toy market and new store openings lifted net sales 24.9%. The company presents an annual dividend of 92.50 yen per share for FY2025 (Plan), reflecting the two-for-one share split conducted on January 1, 2026.
Consolidated Results (Full-Year Actual)
Net sales rose to 439,052 million yen from 364,418 million yen a year earlier. Cost of sales increased 20.9% to 386,422 million yen, equal to 88.0% of net sales, so gross profit grew 17.1% to 52,630 million yen while the gross margin narrowed to 12.0% from 12.3%. SG&A expenses rose 11.4% to 37,040 million yen, within which logistics cost was 8,709 million yen (up 18.4%) and personnel cost was 12,920 million yen (up 7.6%). Operating profit of 15,590 million yen represented a 3.6% operating margin. Non-operating expenses rose to 436 million yen, including a provision of allowance for doubtful accounts of 381 million yen, while extraordinary losses fell 95.8% to 62 million yen from 1,485 million yen in the previous year. Cost of sales included loss on disposal of inventories of 1,981 million yen in FY2025, versus 1,584 million yen in FY2024.
| Item (¥ million) | Full Fiscal Year 2024 (Apr. 1, 2024 to Mar. 31, 2025) | Full Fiscal Year 2025 (Apr. 1, 2025 to Mar. 31, 2026) | YoY (%) |
|---|---|---|---|
| Net sales | 364,418 | 439,052 | 20.5 |
| Cost of sales | 319,489 | 386,422 | 20.9 |
| Gross profit | 44,928 | 52,630 | 17.1 |
| SG&A expenses | 33,250 | 37,040 | 11.4 |
| Operating profit | 11,677 | 15,590 | 33.5 |
| Ordinary profit | 11,963 | 15,701 | 31.2 |
| Profit before income taxes | 10,584 | 15,655 | 47.9 |
| Income taxes | 3,820 | 5,559 | 45.5 |
| Profit attributable to owners of parent | 6,764 | 10,096 | 49.2 |
| Earnings per share (¥) | 153.41 | 230.91 | 50.5 |
Segment Results
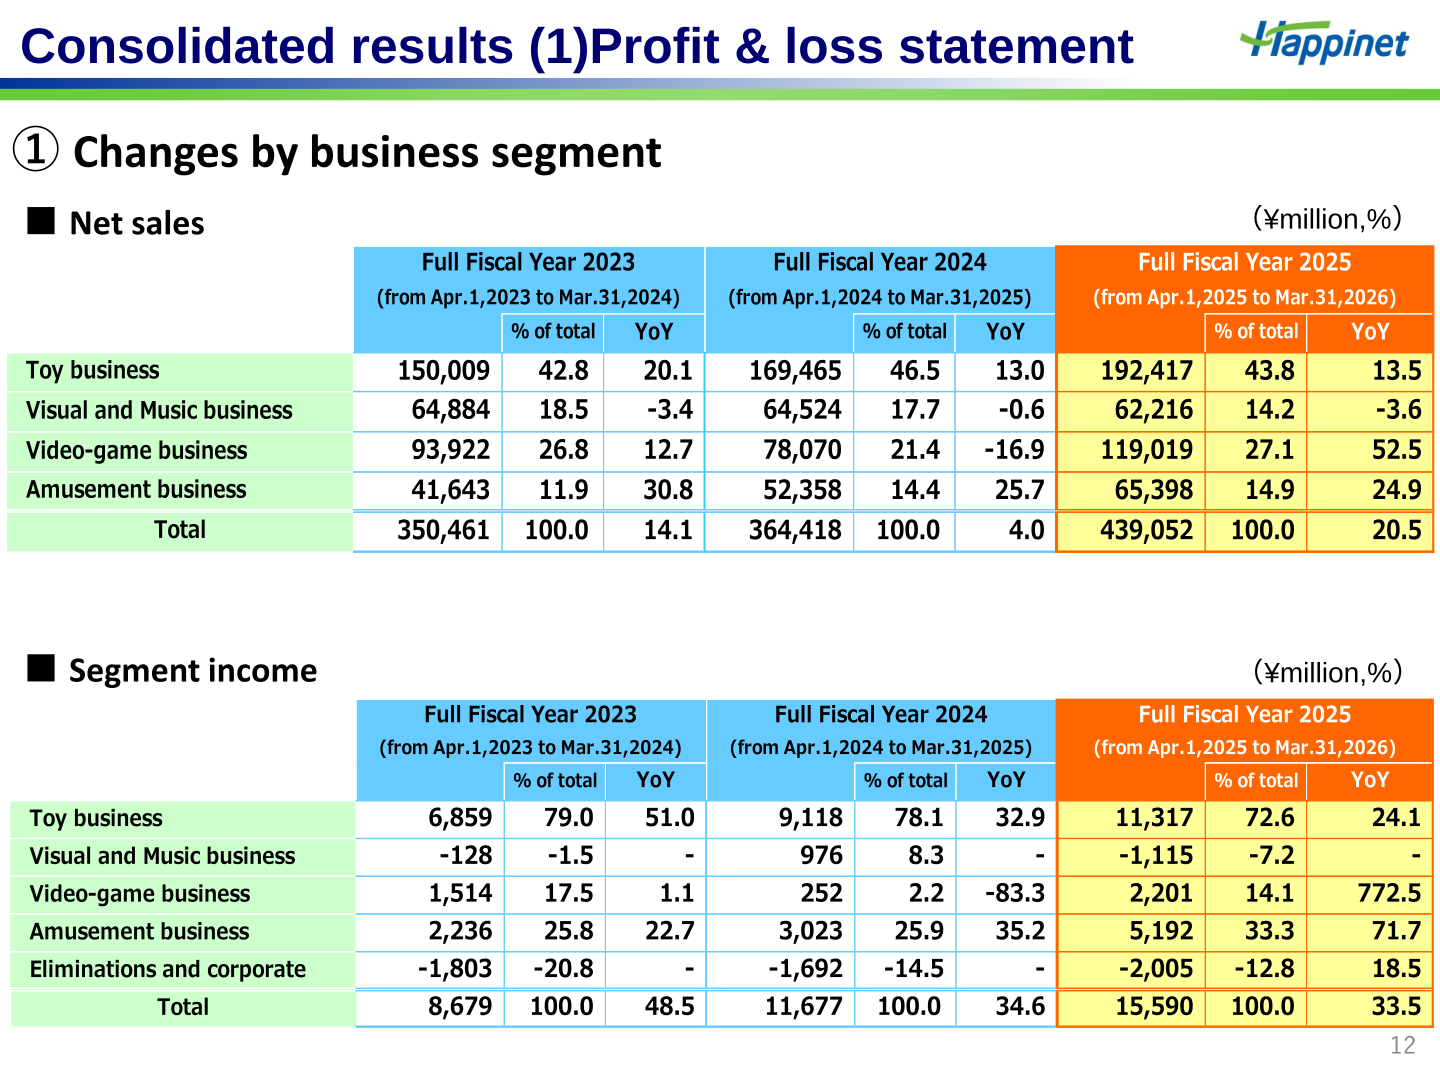
In the Toy business, sales of lottery-based products led by BANDAI SPIRITS’ “Ichiban Kuji” continued to perform strongly, and hit products such as Bandai’s “Tamagotchi Paradise” together with expanded distribution of hobby products such as plastic model kits and figurines lifted both net sales and segment income above the previous fiscal year. The segment accounted for 43.8% of net sales. In the Visual and Music business, the expansion of video package production and distribution operations was not sufficient to offset market contraction, so net sales declined year on year, and segment income declined significantly because of investment losses recorded on foreign films purchased by the Company. In the Video-game business, net sales and segment income rose significantly on the strong performance of Nintendo’s game console “Nintendo Switch 2” and its related accessories, together with higher sales of related software titles such as “Mario Kart World”, “Pokémon LEGENDS Z-A” and “Pokémon Pokopia”; sales of Nintendo products reached 102.0 billion yen (up 92.7%) while sales of Sony Interactive Entertainment products fell 43.4% to 9.9 billion yen. In the Amusement business, both net sales and segment income increased significantly on continued strong performance in the capsule-toy market combined with more openings of Company-run “gashacoco” capsule toy stores and of capsule toy stores jointly run by the Company and Bandai Namco Amusement Inc.; capsule-toy sales rose 33.0% to 52.8 billion yen, and as of March 31, 2026 the Company had opened 154 “gashacoco” stores.
| Segment | Metric (¥ million) | Full Fiscal Year 2024 | Full Fiscal Year 2025 | YoY (%) |
|---|---|---|---|---|
| Toy business | Net sales | 169,465 | 192,417 | 13.5 |
| Visual and Music business | Net sales | 64,524 | 62,216 | -3.6 |
| Video-game business | Net sales | 78,070 | 119,019 | 52.5 |
| Amusement business | Net sales | 52,358 | 65,398 | 24.9 |
| Total | Net sales | 364,418 | 439,052 | 20.5 |
| Toy business | Segment income | 9,118 | 11,317 | 24.1 |
| Visual and Music business | Segment income | 976 | -1,115 | – |
| Video-game business | Segment income | 252 | 2,201 | 772.5 |
| Amusement business | Segment income | 3,023 | 5,192 | 71.7 |
| Eliminations and corporate | Segment income | -1,692 | -2,005 | 18.5 |
| Total | Segment income | 11,677 | 15,590 | 33.5 |
Balance Sheet and Cash Flows
Total assets increased 22,550 million yen to 144,003 million yen as of March 31, 2026, mainly on a 12,934 million yen increase in accounts receivable – trade and a 9,820 million yen increase in cash and deposits. Total liabilities rose 17,936 million yen to 83,717 million yen, led by a 13,339 million yen increase in notes and accounts payable-trade, and total net assets rose 4,613 million yen to 60,285 million yen, with net assets per share at 1,382.59 yen. Net cash provided by operating activities was 15,831 million yen, down 2,289 million yen from the previous year as the increase in trade receivables of 14,120 million yen offset higher profit before income taxes. Net cash used in investing activities narrowed to 1,184 million yen and net cash used in financing activities was 4,798 million yen, including 1,872 million yen for the purchase of treasury shares and 2,925 million yen of dividends paid. Cash and cash equivalents at end of period were 50,825 million yen.
| Item (¥ million) | Full Fiscal Year 2024 | Full Fiscal Year 2025 | Change |
|---|---|---|---|
| Total assets | 121,452 | 144,003 | 22,550 |
| Total current assets | 96,938 | 120,888 | 23,950 |
| Total liabilities | 65,780 | 83,717 | 17,936 |
| Total net assets | 55,672 | 60,285 | 4,613 |
| Net assets per share (¥) | 1,259.24 | 1,382.59 | 123.35 |
| Net cash provided by (used in) operating activities | 18,121 | 15,831 | -2,289 |
| Net cash provided by (used in) investing activities | -2,802 | -1,184 | 1,618 |
| Net cash provided by (used in) financing activities | -3,993 | -4,798 | -805 |
| Cash and cash equivalents at end of period | 40,977 | 50,825 | 9,848 |
Full-Year Outlook
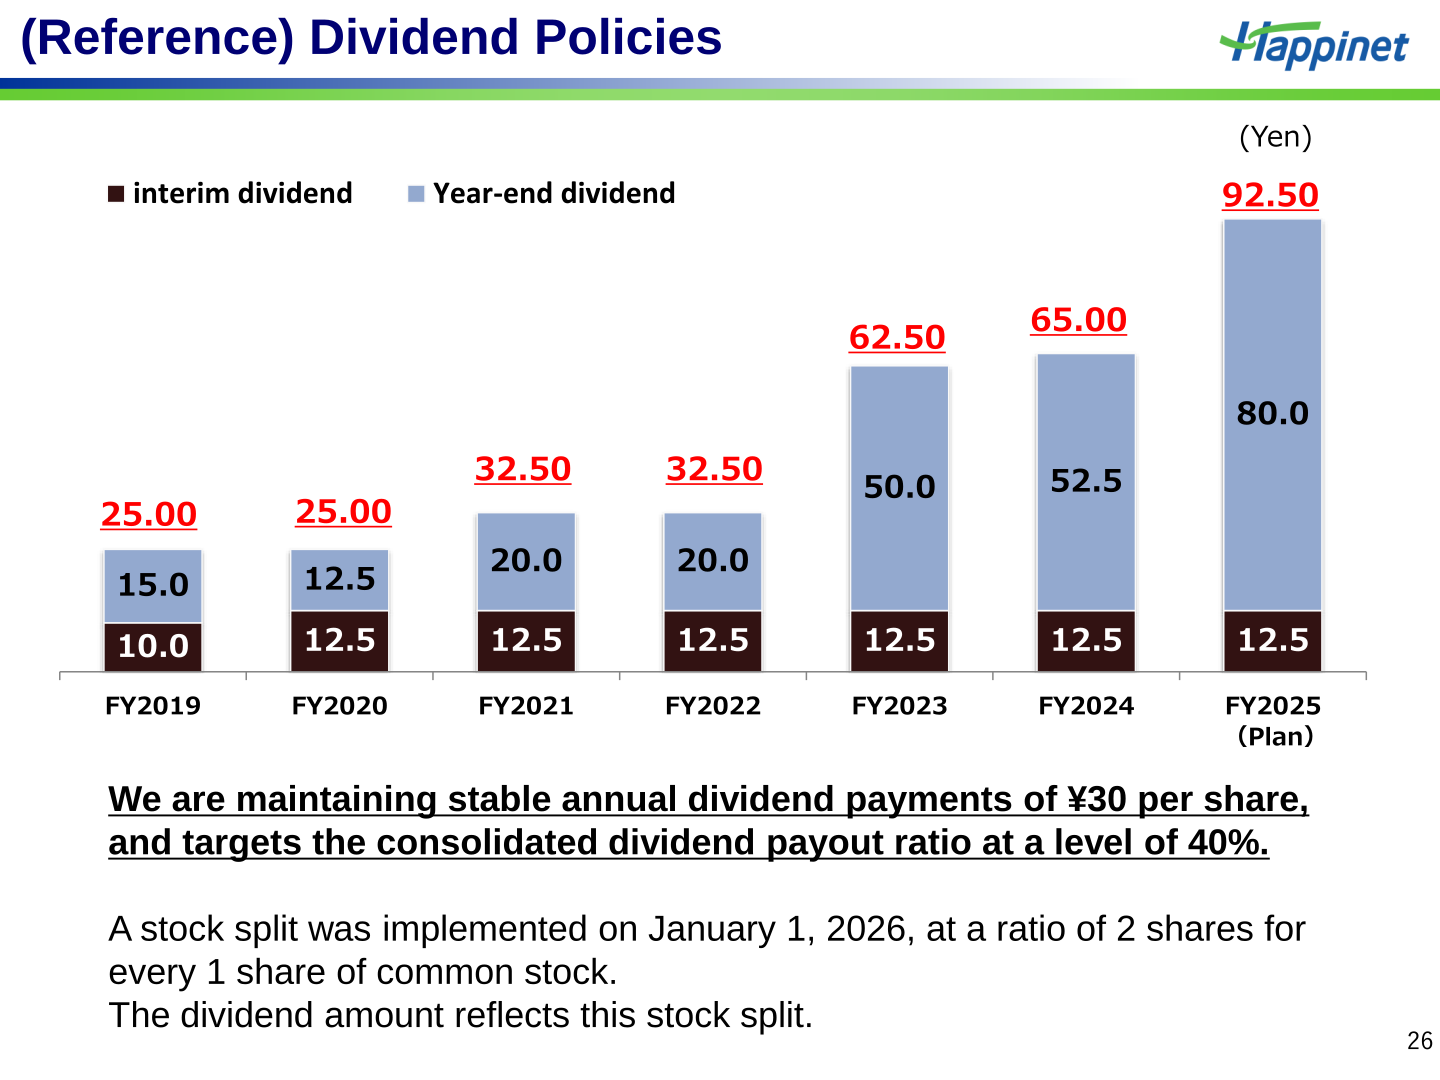
This material does not present consolidated earnings guidance for the next fiscal year. A full-year forecast cannot be confirmed from the materials. The Company does disclose operational targets for the fiscal year 2026, including a store opening target of 20 stores in total for its capsule-toy business in the United States and a domestic “gashacoco” store opening target of plus 35 stores (Direct +15, FC +20), and it lists noteworthy products for the FY2026 first half such as “Splatoon Raiders” (scheduled for release on July 23, 2026) and the Company’s own title “Brigandine Abyss” (scheduled for release on August 27, 2026).
Shareholder Returns
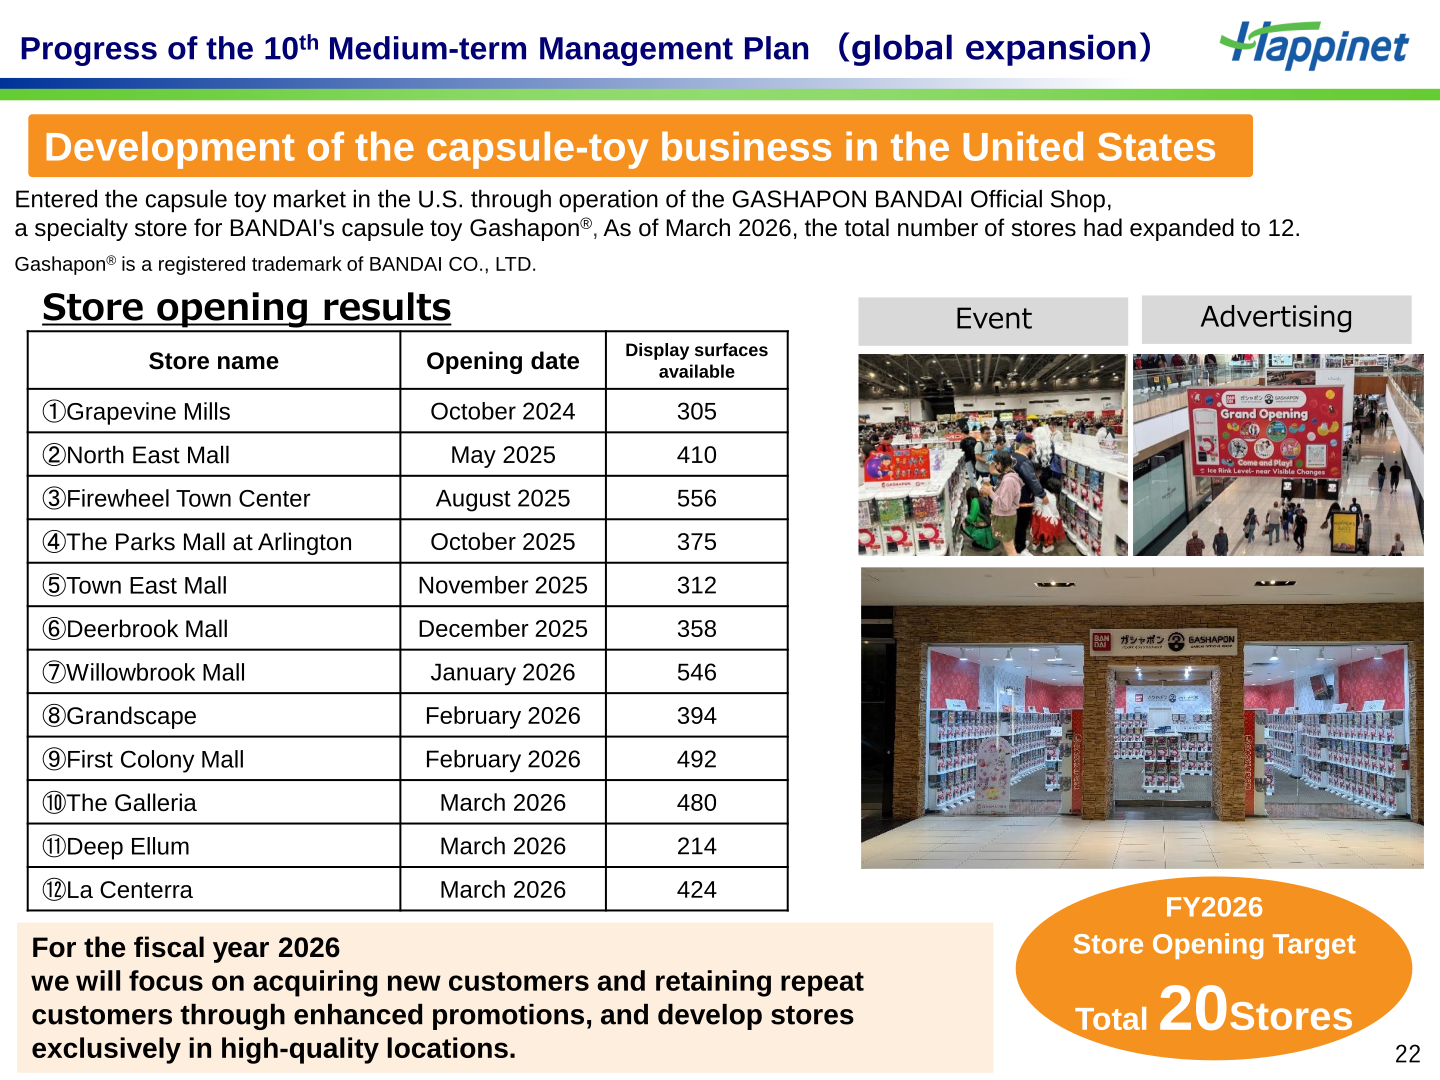
The Company states that it is maintaining stable annual dividend payments of 30 yen per share, and targets the consolidated dividend payout ratio at a level of 40%. A stock split was implemented on January 1, 2026, at a ratio of 2 shares for every 1 share of common stock, and the dividend amounts reflect this stock split. For FY2025 the annual dividend is 92.50 yen per share (Plan), consisting of an interim dividend of 12.5 yen and a year-end dividend of 80.0 yen, up from 65.00 yen for FY2024. The Company also purchased treasury shares of 1,872 million yen during the fiscal year.
| Dividend per share (¥) | FY2023 | FY2024 | FY2025 (Plan) |
|---|---|---|---|
| Interim dividend | 12.5 | 12.5 | 12.5 |
| Year-end dividend | 50.0 | 52.5 | 80.0 |
| Annual total | 62.50 | 65.00 | 92.50 |
Medium-term Management Plan and Topics
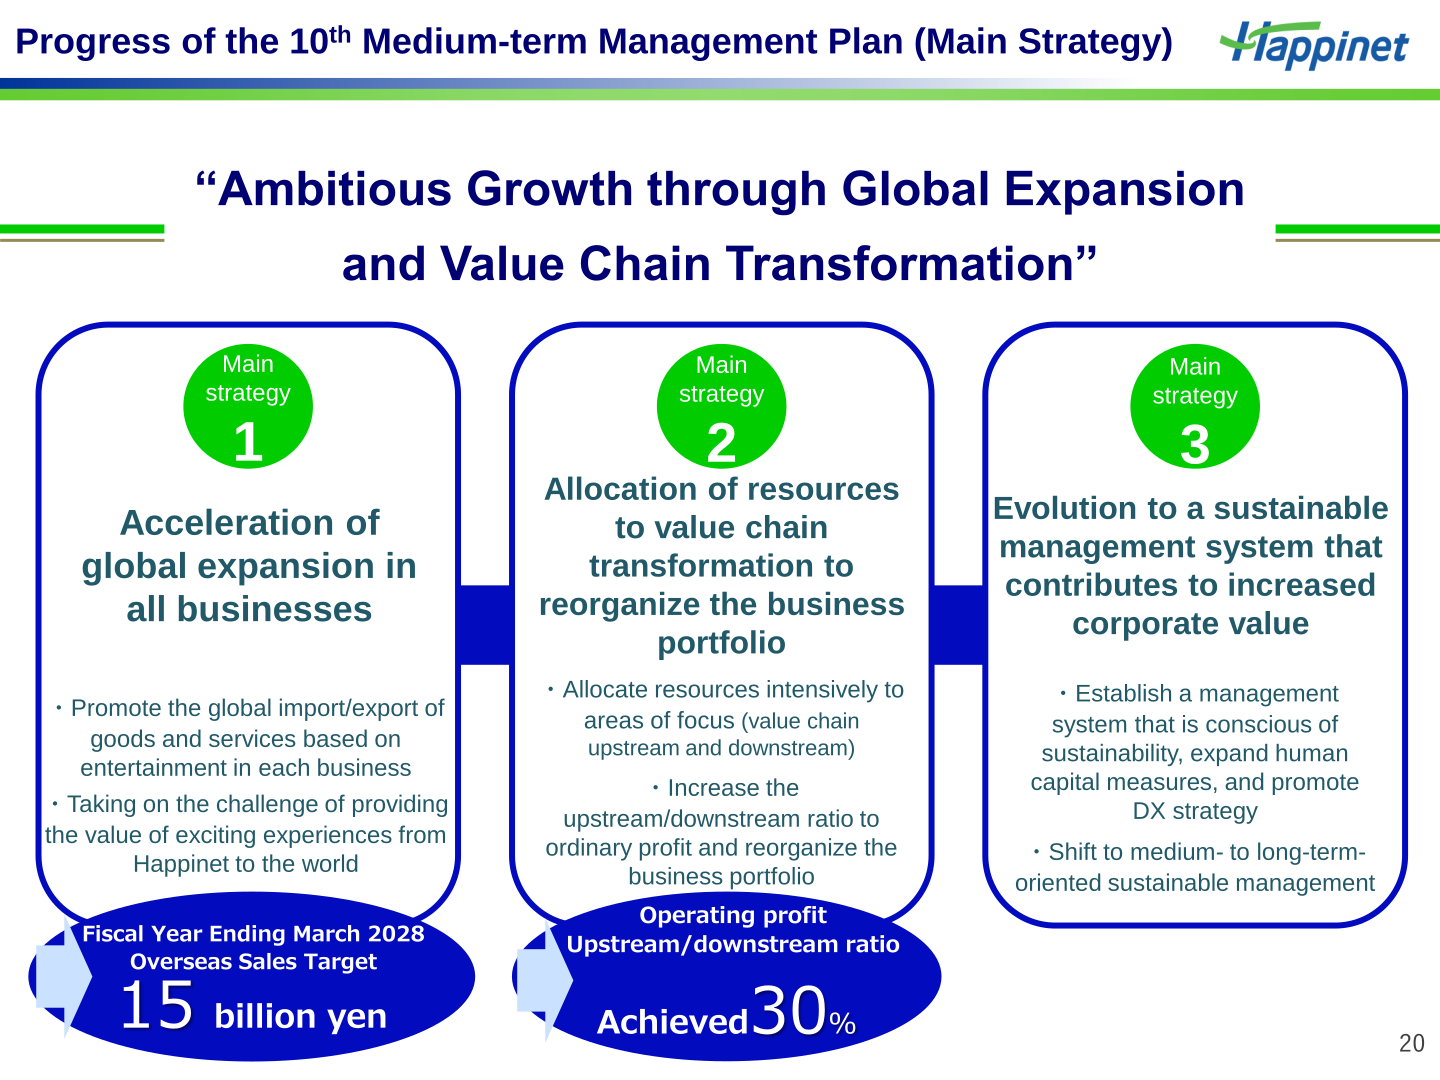
FY2025 was the first year of the 10th Medium-term Management Plan, titled “Ambitious Growth through Global Expansion and Value Chain Transformation”, which is built on three main strategies: acceleration of global expansion in all businesses, allocation of resources to value chain transformation to reorganize the business portfolio, and evolution to a sustainable management system that contributes to increased corporate value. The plan sets an overseas sales target of 15 billion yen for the fiscal year ending March 2028, and the Company reports that it achieved a 30% upstream/downstream ratio of operating profit. In the first year the Company expanded its capsule-toy stores in Texas in the United States to 12, began rolling out game-based IPs to the global market and distributed its original anime titles overseas, added Happinet-original game titles, and incurred a significant loss in the purchase of foreign films. It also achieved its target of 20% female managers for FY2025 and conducted stock splits and proactive investor relations activities to broaden the investor base. Looking ahead, the Company says it will continue expanding the capsule-toy store network while shifting focus to profitability and efficiency, and that investment in foreign films within the Visual and Music business will contract.
This article is an analysis based on publicly available information and is not a recommendation to buy or sell any specific securities. Investment decisions are your own responsibility.
















