
This article is based on publicly available IR materials and is not a recommendation to buy or sell any specific securities.
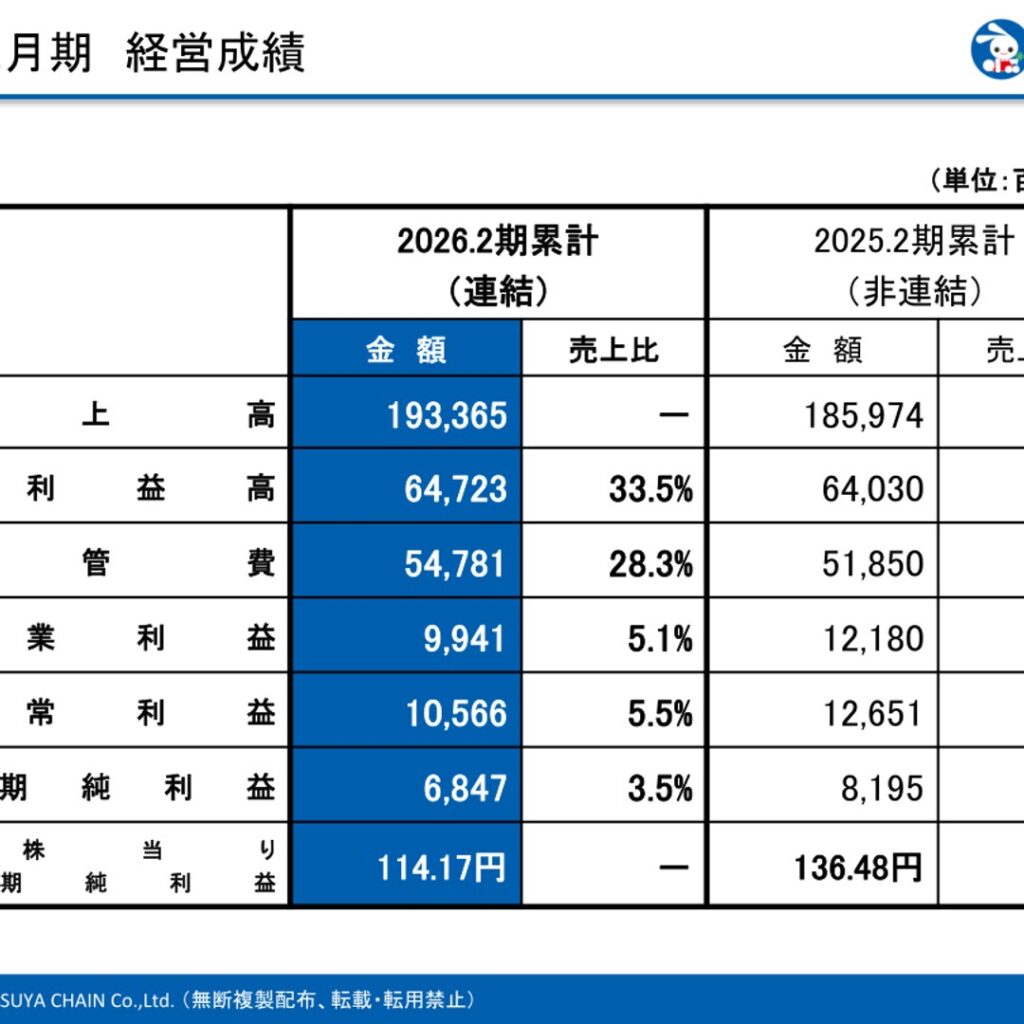
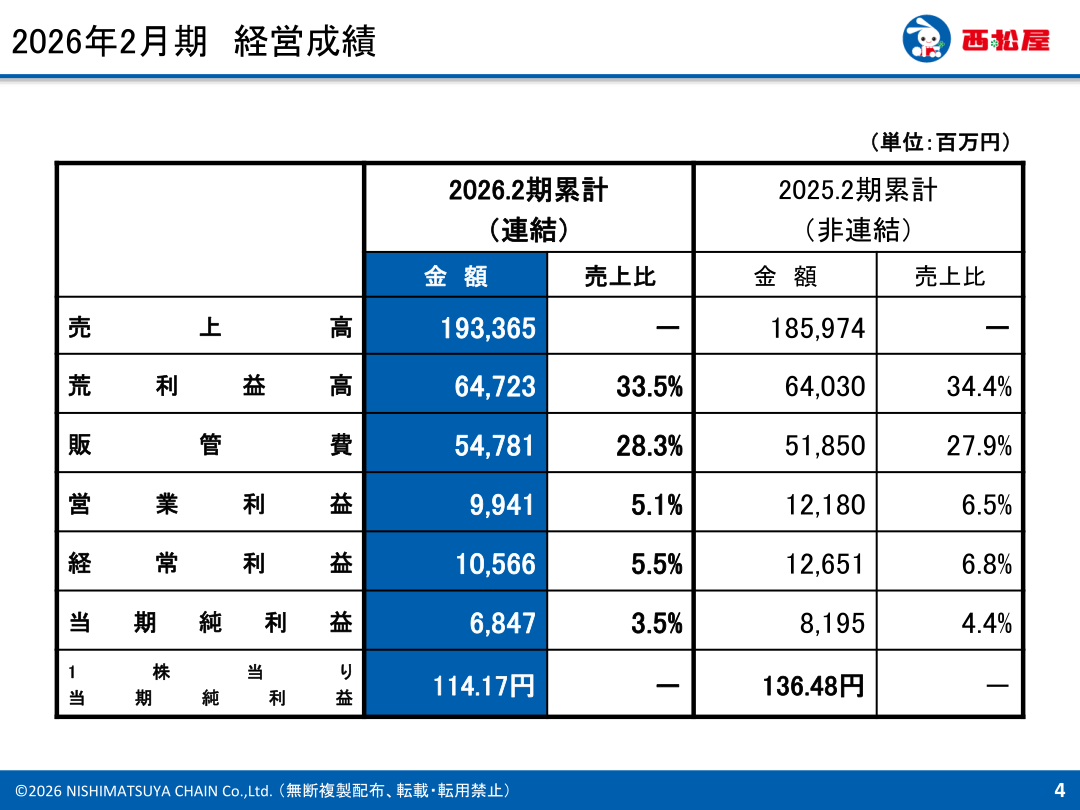
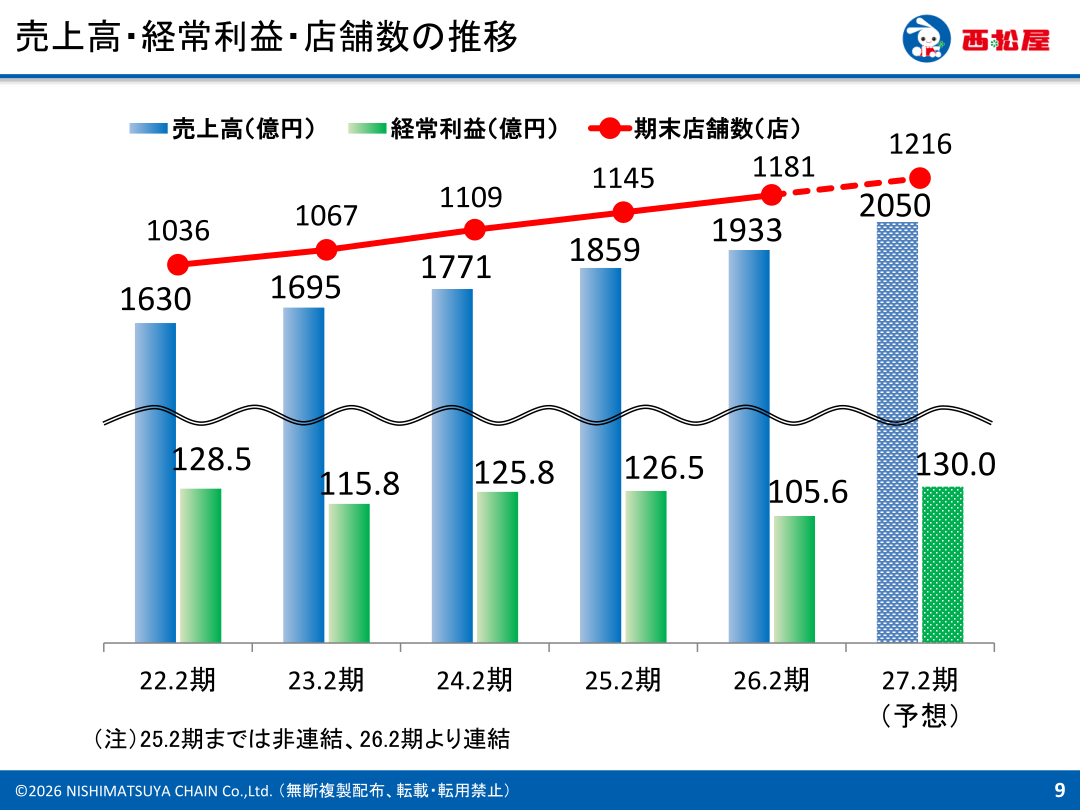
Note: Nishimatsuya Chain Co., Ltd. does not publish an English results presentation; this article is an English translation of the Japanese-language article on our sister site Investalk, which is based on the company’s Japanese-language IR materials, with figures transcribed as reported. This site labels the most recent completed fiscal year as FY2025, while the company designates it the fiscal year ended February 2026. For that fiscal year, Nishimatsuya Chain reported consolidated net sales of 193,365 million yen, up from 185,974 million yen in the previous fiscal year (ended February 2025, non-consolidated). On the other hand, a lower gross profit margin and a higher SG&A expense ratio meant that operating profit of 9,941 million yen, ordinary profit of 10,566 million yen and net income of 6,847 million yen all fell short of the previous year’s results. Net income per share was 114.17 yen. For the fiscal year ending February 2027, the company expects net sales of 205,000 million yen and ordinary profit of 13,000 million yen, forecasting higher sales and higher profit.
Consolidated Results (Fiscal Year Ended February 2026, Actual)
Net sales increased year on year, but the gross profit margin fell to 33.5% (34.4% in the previous year) and SG&A expenses rose to 28.3% of net sales (27.9% in the previous year), so operating profit, ordinary profit and net income all came in below the previous year. Note that the previous fiscal year (ended February 2025) was reported on a non-consolidated basis while the fiscal year under review (ended February 2026) is reported on a consolidated basis, so the basis of comparison differs.
| Item | FY ended February 2026 (Consolidated) | FY ended February 2025 (Non-consolidated) |
|---|---|---|
| Net sales | 193,365 million yen | 185,974 million yen |
| Gross profit | 64,723 million yen (33.5% of net sales) | 64,030 million yen (34.4% of net sales) |
| SG&A expenses | 54,781 million yen (28.3% of net sales) | 51,850 million yen (27.9% of net sales) |
| Operating profit | 9,941 million yen (5.1% of net sales) | 12,180 million yen (6.5% of net sales) |
| Ordinary profit | 10,566 million yen (5.5% of net sales) | 12,651 million yen (6.8% of net sales) |
| Net income | 6,847 million yen (3.5% of net sales) | 8,195 million yen (4.4% of net sales) |
| Net income per share | 114.17 yen | 136.48 yen |
Store Network
In the fiscal year ended February 2026, the company opened 61 new stores and closed 25 stores, leaving 1,181 stores at the end of the period. That was a net increase from the 1,145 stores at the end of the previous fiscal year (ended February 2025).
| Item | FY ended February 2026 | End of FY ended February 2025 |
|---|---|---|
| Store openings | 61 stores | – |
| Store closures | 25 stores | – |
| Stores at period-end | 1,181 stores | 1,145 stores |
Full-Year Forecast (Fiscal Year Ending February 2027)
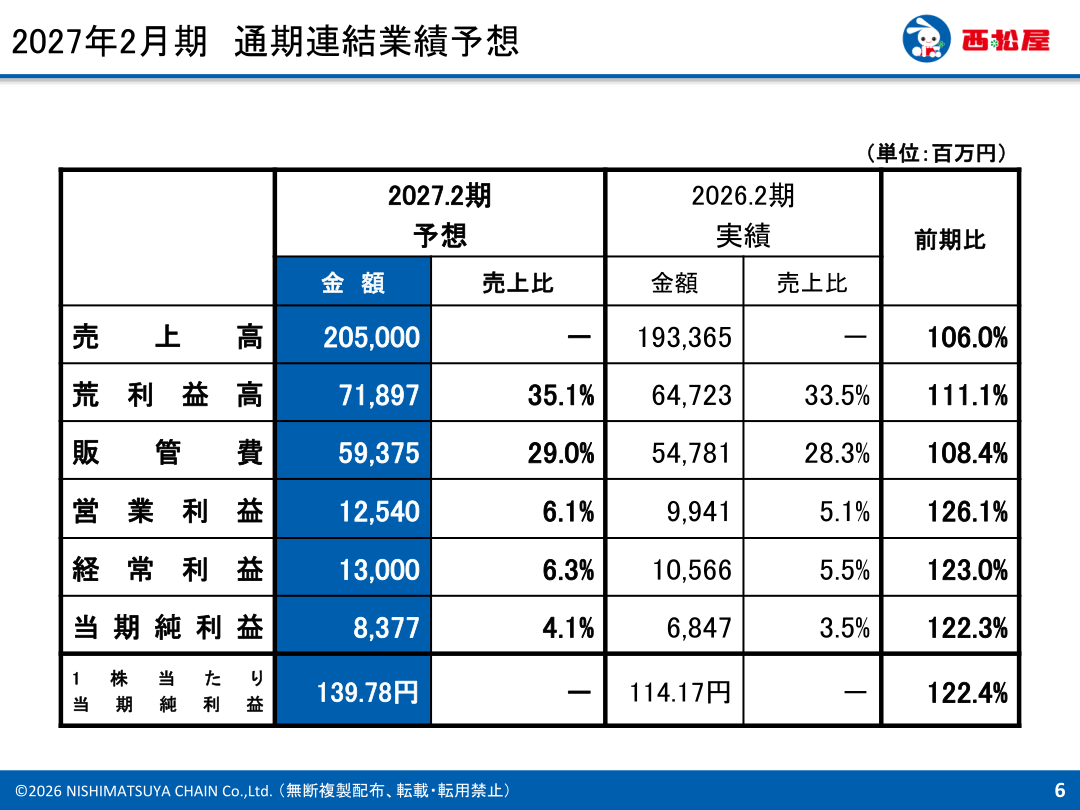
As its consolidated earnings forecast for the fiscal year ending February 2027, the company expects net sales of 205,000 million yen (106.0% of the previous year), operating profit of 12,540 million yen (126.1%), ordinary profit of 13,000 million yen (123.0%) and net income of 8,377 million yen (122.3%). Net income per share is forecast at 139.78 yen (122.4% of the previous year).
| Item | FY ending February 2027 (Forecast) | FY ended February 2026 (Actual) | Change vs. previous year |
|---|---|---|---|
| Net sales | 205,000 million yen | 193,365 million yen | 106.0% |
| Gross profit | 71,897 million yen (35.1% of net sales) | 64,723 million yen (33.5% of net sales) | 111.1% |
| SG&A expenses | 59,375 million yen (29.0% of net sales) | 54,781 million yen (28.3% of net sales) | 108.4% |
| Operating profit | 12,540 million yen (6.1% of net sales) | 9,941 million yen (5.1% of net sales) | 126.1% |
| Ordinary profit | 13,000 million yen (6.3% of net sales) | 10,566 million yen (5.5% of net sales) | 123.0% |
| Net income | 8,377 million yen (4.1% of net sales) | 6,847 million yen (3.5% of net sales) | 122.3% |
| Net income per share | 139.78 yen | 114.17 yen | 122.4% |
Shareholder Returns
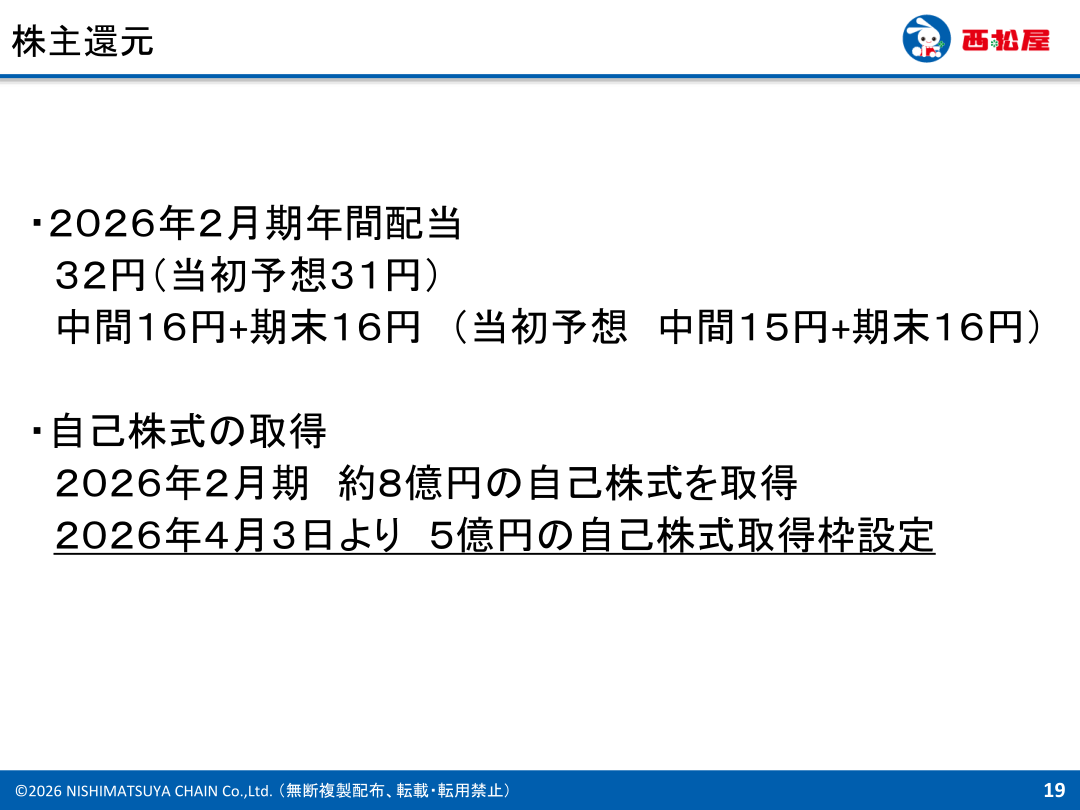
The annual dividend for the fiscal year ended February 2026 was 32 yen (16 yen interim plus 16 yen year-end), an increase from the initial forecast of 31 yen (15 yen interim plus 16 yen year-end). As for share buybacks, the company acquired approximately 800 million yen of its own shares in the fiscal year ended February 2026, and from April 3, 2026 it newly set a share buyback framework of 500 million yen.
| Item | FY ended February 2026 (Actual) | Initial forecast |
|---|---|---|
| Annual dividend | 32 yen | 31 yen |
| Interim dividend | 16 yen | 15 yen |
| Year-end dividend | 16 yen | 16 yen |
Medium-Term Management Plan
As quantitative targets of its medium-term management plan, the company has set consolidated net sales of 205.0 billion yen and ordinary profit of 13.0 billion yen for the fiscal year ending February 2027, and consolidated net sales of 270.0 billion yen and ordinary profit of 23.0 billion yen for the fiscal year ending February 2031.
This article is an analysis based on publicly available information and is not a recommendation to buy or sell any specific securities. Investment decisions are your own responsibility.
















