
This article is based on publicly available IR materials and is not a recommendation to buy or sell any specific securities.
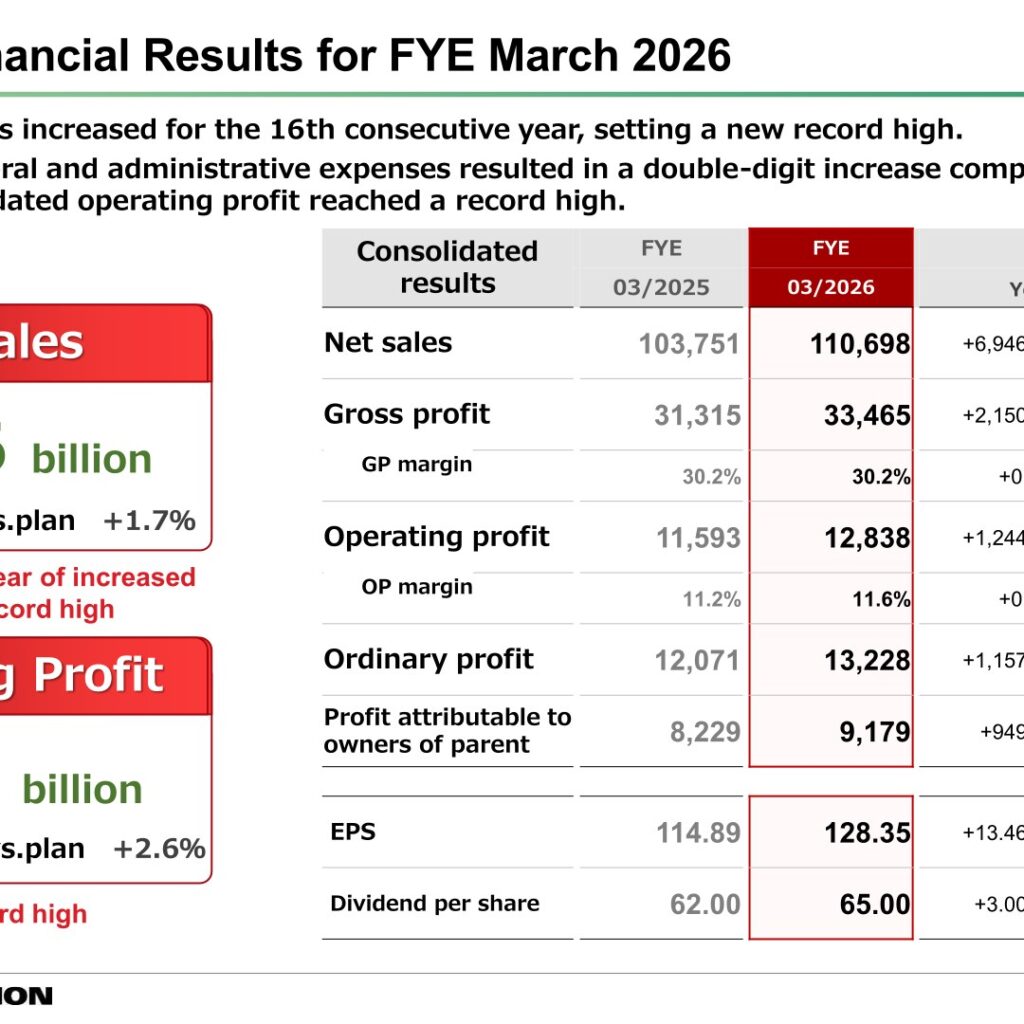
AS ONE CORPORATION reported net sales of 110,698 million yen (up 6.7% year on year) and operating profit of 12,838 million yen (up 10.7%) for the fiscal year ended March 2026, both record highs. Profit attributable to owners of parent rose 11.5% to 9,179 million yen, and ROE reached a record high of 13.3%. For the fiscal year ending March 2027 the company forecasts net sales of 117,850 million yen (up 6.5%) and operating profit of 12,900 million yen (up 0.5%), with the annual dividend raised to 66.00 yen. Note: the company labels the year ended March 2026 as “FYE 03/2026” and the current year as “FYE 03/2027”, whereas this site classifies the most recently completed full year as FY2025; the labels used in the text, tables and segment data below follow the company’s presentation.
Consolidated Results (Full-Year Actual)
Consolidated net sales increased for the 16th consecutive year and set a new record high. Gross profit rose 6.9% to 33,465 million yen while the gross profit margin was unchanged at 30.2%, as strategies for private label products, imported goods and web-only products offset the impact of the change in product mix. Operating profit reached a record high, rising 10.7%, and came in 2.6% above the company’s plan.
| Item (million yen) | FYE 03/2025 | FYE 03/2026 | YoY | vs. plan |
|---|---|---|---|---|
| Net sales | 103,751 | 110,698 | +6,946 / +6.7% | +1,798 / +1.7% |
| Gross profit | 31,315 | 33,465 | +2,150 / +6.9% | +364 / +1.1% |
| GP margin | 30.2% | 30.2% | +0.0% | (0.2)% |
| Operating profit | 11,593 | 12,838 | +1,244 / +10.7% | +328 / +2.6% |
| OP margin | 11.2% | 11.6% | +0.4% | +0.1% |
| Ordinary profit | 12,071 | 13,228 | +1,157 / +9.6% | +278 / +2.2% |
| Profit attributable to owners of parent | 8,229 | 9,179 | +949 / +11.5% | +239 / +2.7% |
| EPS (yen) | 114.89 | 128.35 | +13.46 / +11.7% | +3.58 / +2.9% |
| Dividend per share (yen) | 62.00 | 65.00 | +3.00 / +4.8% | +2.00 / +3.2% |
Total selling, general and administrative expenses rose only 4.6% to 20,627 million yen, against sales growth of 6.7%. Freight and warehousing work costs were held to a 3.7% increase at 5,368 million yen through various logistics initiatives, and advertising expenses fell 28.7% to 553 million yen, while rent expenses on real estate rose 14.5% to 1,918 million yen due to the relocation and establishment of the Kyushu DC. The share buyback carried out during the year brought ROE to over 13% for the first time, at 13.3% (up 0.7%), reaching the target level set out in the medium-term plan.
Segment Results
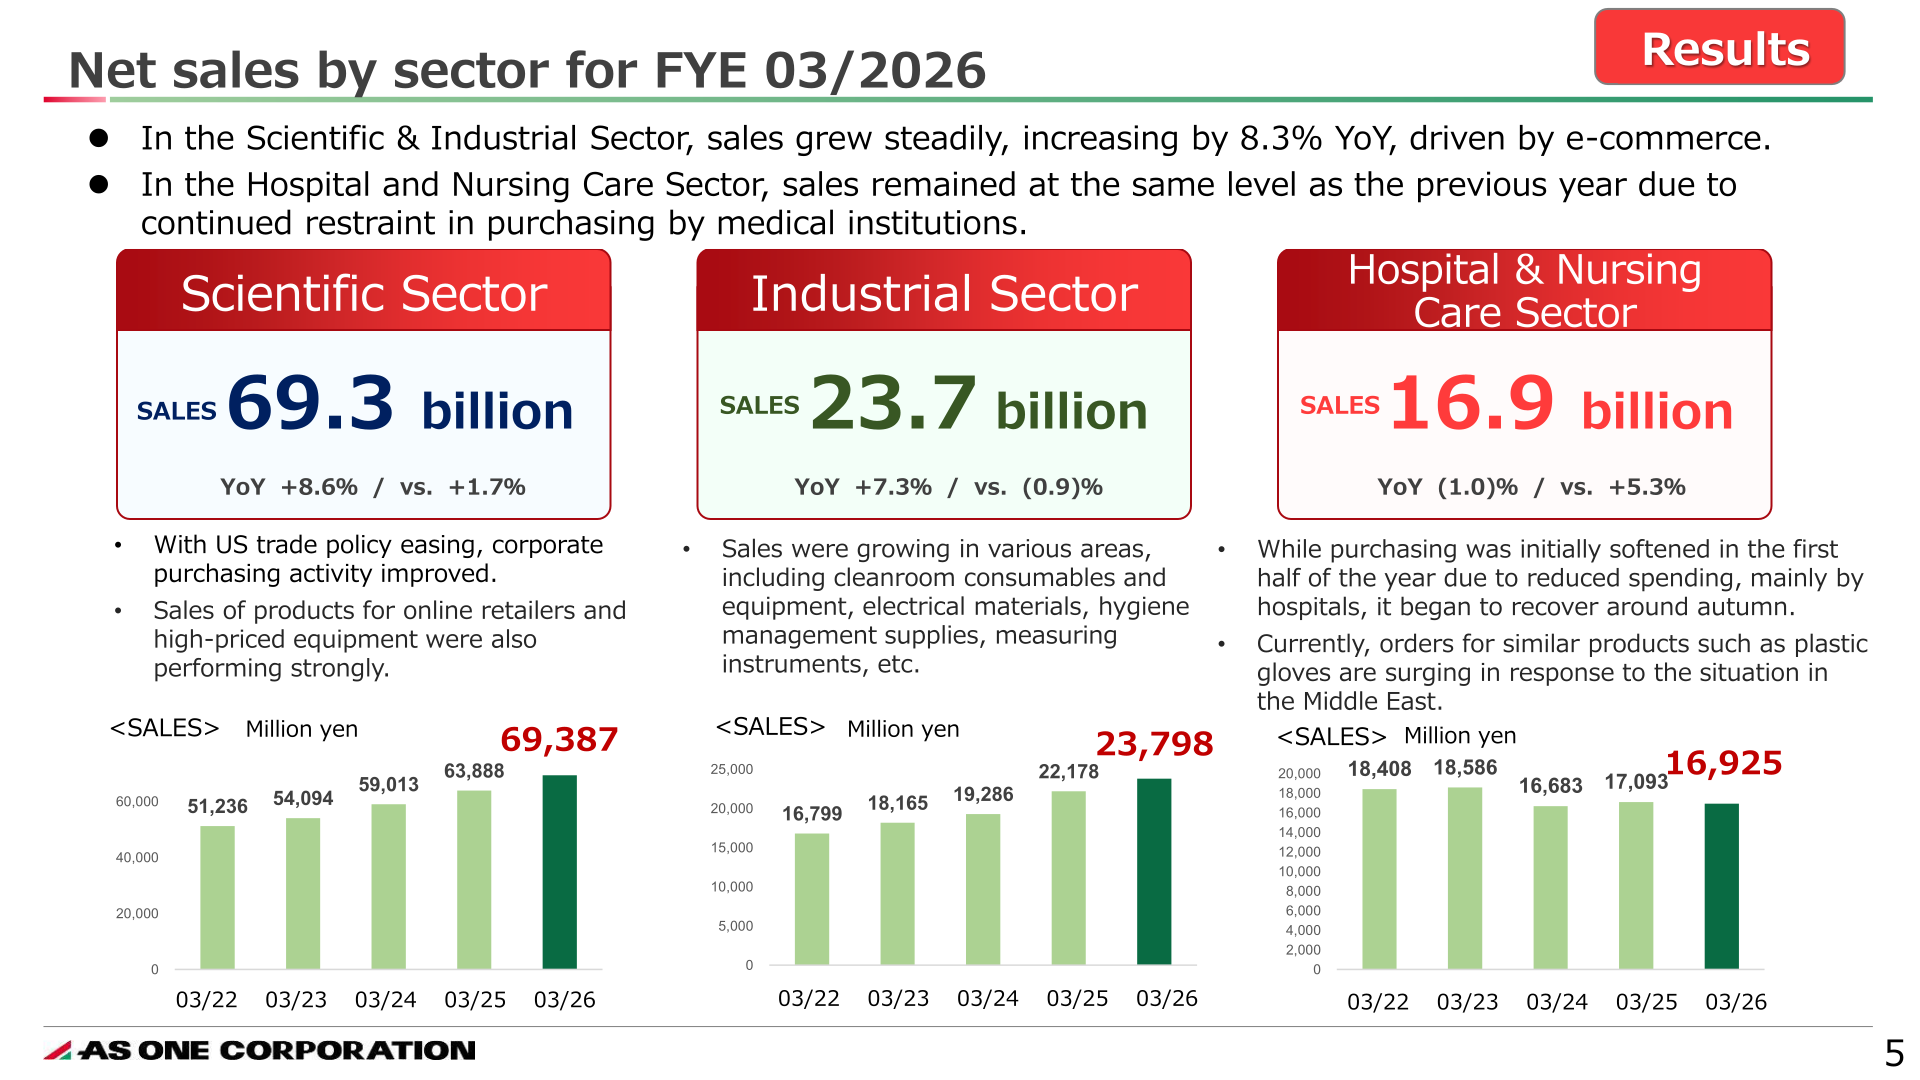
In the Scientific & Industrial Sector, sales grew steadily, increasing 8.3% year on year, driven by e-commerce, while in the Hospital and Nursing Care Sector sales remained at the same level as the previous year due to continued restraint in purchasing by medical institutions. In the Scientific Sector, easing U.S. trade policy improved corporate purchasing activity and sales of products for online retailers and high-priced equipment performed strongly. In the Hospital and Nursing Care Sector, purchasing was initially softened in the first half of the year, mainly by hospitals, but began to recover around autumn.
| Sector (million yen) | FYE 03/2025 | FYE 03/2026 | YoY | FYE 03/2027 (Forecast) | YoY |
|---|---|---|---|---|---|
| Scientific | 63,888 | 69,387 | +8.6% | 74,558 | +7.5% |
| Industrial | 22,178 | 23,798 | +7.3% | 25,576 | +7.5% |
| Hospital & Nursing Care | 17,093 | 16,925 | (1.0)% | 17,095 | +1.0% |
| Other | — | 587 | — | 619 | +5.4% |
| Total | 103,751 | 110,698 | +6.7% | 117,850 | +6.5% |
E-commerce remained the main growth driver, with total e-commerce sales of 38,259 million yen, up 12.8%. Sales of web-only catalog products rose 13.4% to 22,530 million yen, original product sales rose 6.8% to 35,721 million yen and overseas business sales rose 15.9% to 6,503 million yen, while service revenue declined 2.0% to 3,922 million yen. As of the end of the period, the number of ocean accounts increased 49.2% to 643 and Wave accounts increased 13.9% to 23,965.
| Item (million yen) | FYE 03/2025 | FYE 03/2026 | YoY | FYE 03/2027 (Forecast) | YoY |
|---|---|---|---|---|---|
| E-commerce sales, total | 33,926 | 38,259 | +12.8% | 44,000 | +15.0% |
| ocean | 15,610 | 17,249 | +10.5% | 19,693 | +14.2% |
| Wave | 1,779 | 2,093 | +17.7% | 2,516 | +20.2% |
| AXEL | 2,414 | 2,851 | +18.1% | 3,310 | +16.1% |
| Online Retailers | 14,122 | 16,064 | +13.7% | 18,479 | +15.0% |
| Sales of web-only catalog products | 19,865 | 22,530 | +13.4% | 27,100 | +20.3% |
| Original product sales | 33,446 | 35,721 | +6.8% | 38,570 | +8.0% |
| Service revenue | 4,004 | 3,922 | (2.0)% | 4,346 | +10.8% |
| Overseas Business | 5,609 | 6,503 | +15.9% | 6,993 | +7.5% |
FYE 03/2027 Forecast
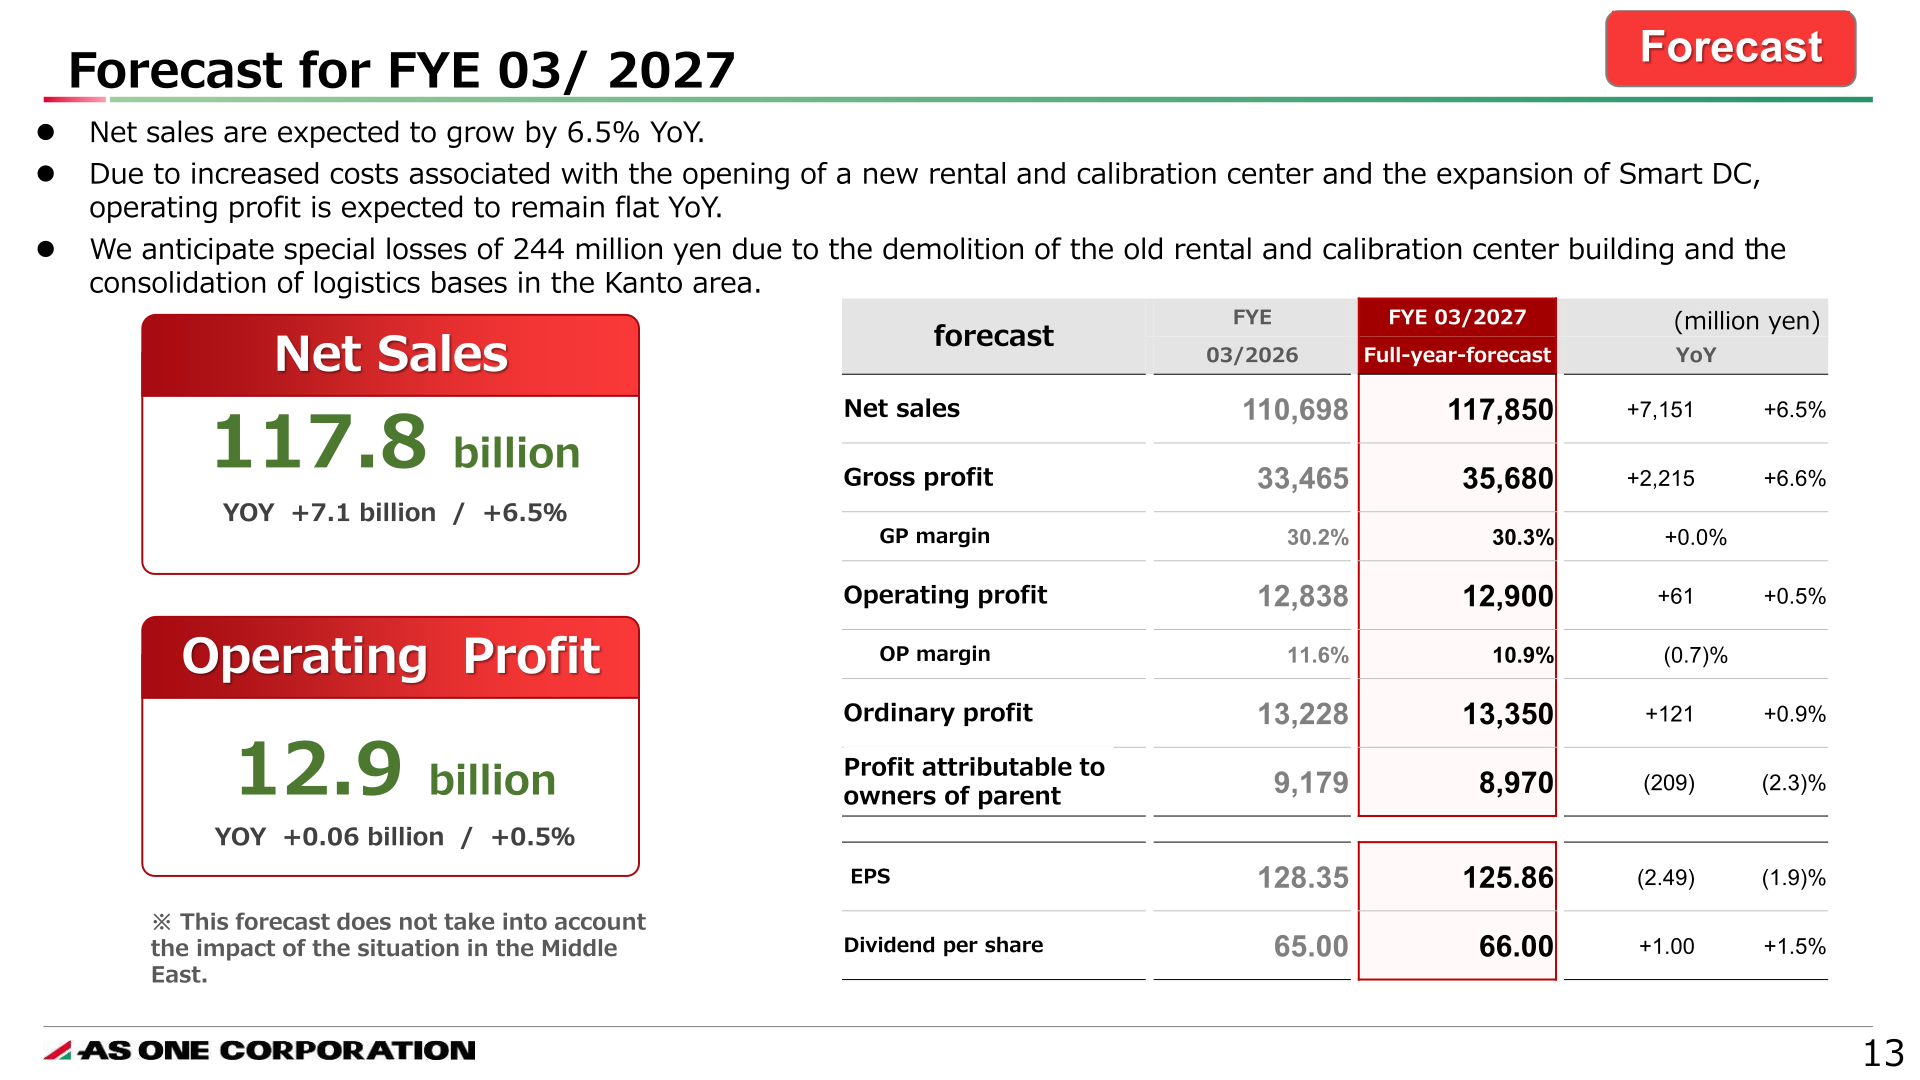
Net sales are expected to grow by 6.5% year on year, while operating profit is expected to remain roughly flat, up 0.5%, due to increased costs associated with the opening of a new rental and calibration center and the expansion of Smart DC. The company also anticipates special losses of 244 million yen due to the demolition of the old rental and calibration center building and the consolidation of logistics bases in the Kanto area. The forecast does not take into account the impact of the situation in the Middle East, because a reasonable calculation is difficult.
| Item (million yen) | FYE 03/2026 | FYE 03/2027 (Full-year forecast) | YoY |
|---|---|---|---|
| Net sales | 110,698 | 117,850 | +7,151 / +6.5% |
| Gross profit | 33,465 | 35,680 | +2,215 / +6.6% |
| GP margin | 30.2% | 30.3% | +0.0% |
| Operating profit | 12,838 | 12,900 | +61 / +0.5% |
| OP margin | 11.6% | 10.9% | (0.7)% |
| Ordinary profit | 13,228 | 13,350 | +121 / +0.9% |
| Profit attributable to owners of parent | 9,179 | 8,970 | (209) / (2.3)% |
| EPS (yen) | 128.35 | 125.86 | (2.49) / (1.9)% |
| Dividend per share (yen) | 65.00 | 66.00 | +1.00 / +1.5% |
In its environmental assessment the company plans the Research and Industrial Instruments Division at 100.1 billion yen (up 7.5%), citing the determination of the 17 strategic areas and expanded investment in basic research, and the Medical Instruments Division at 17.0 billion yen (up 1.0%), citing the FY2026 medical fee revision, the largest in 30 years with a main portion of +3.09%. SG&A expenses are forecast to rise 10.4% to 22,780 million yen, reflecting personnel expenses of 7,821 million yen (up 7.8%), freight and warehousing work costs of 5,824 million yen (up 8.5%) and the costs of opening the new Rental & Calibration Center.
Shareholder Returns
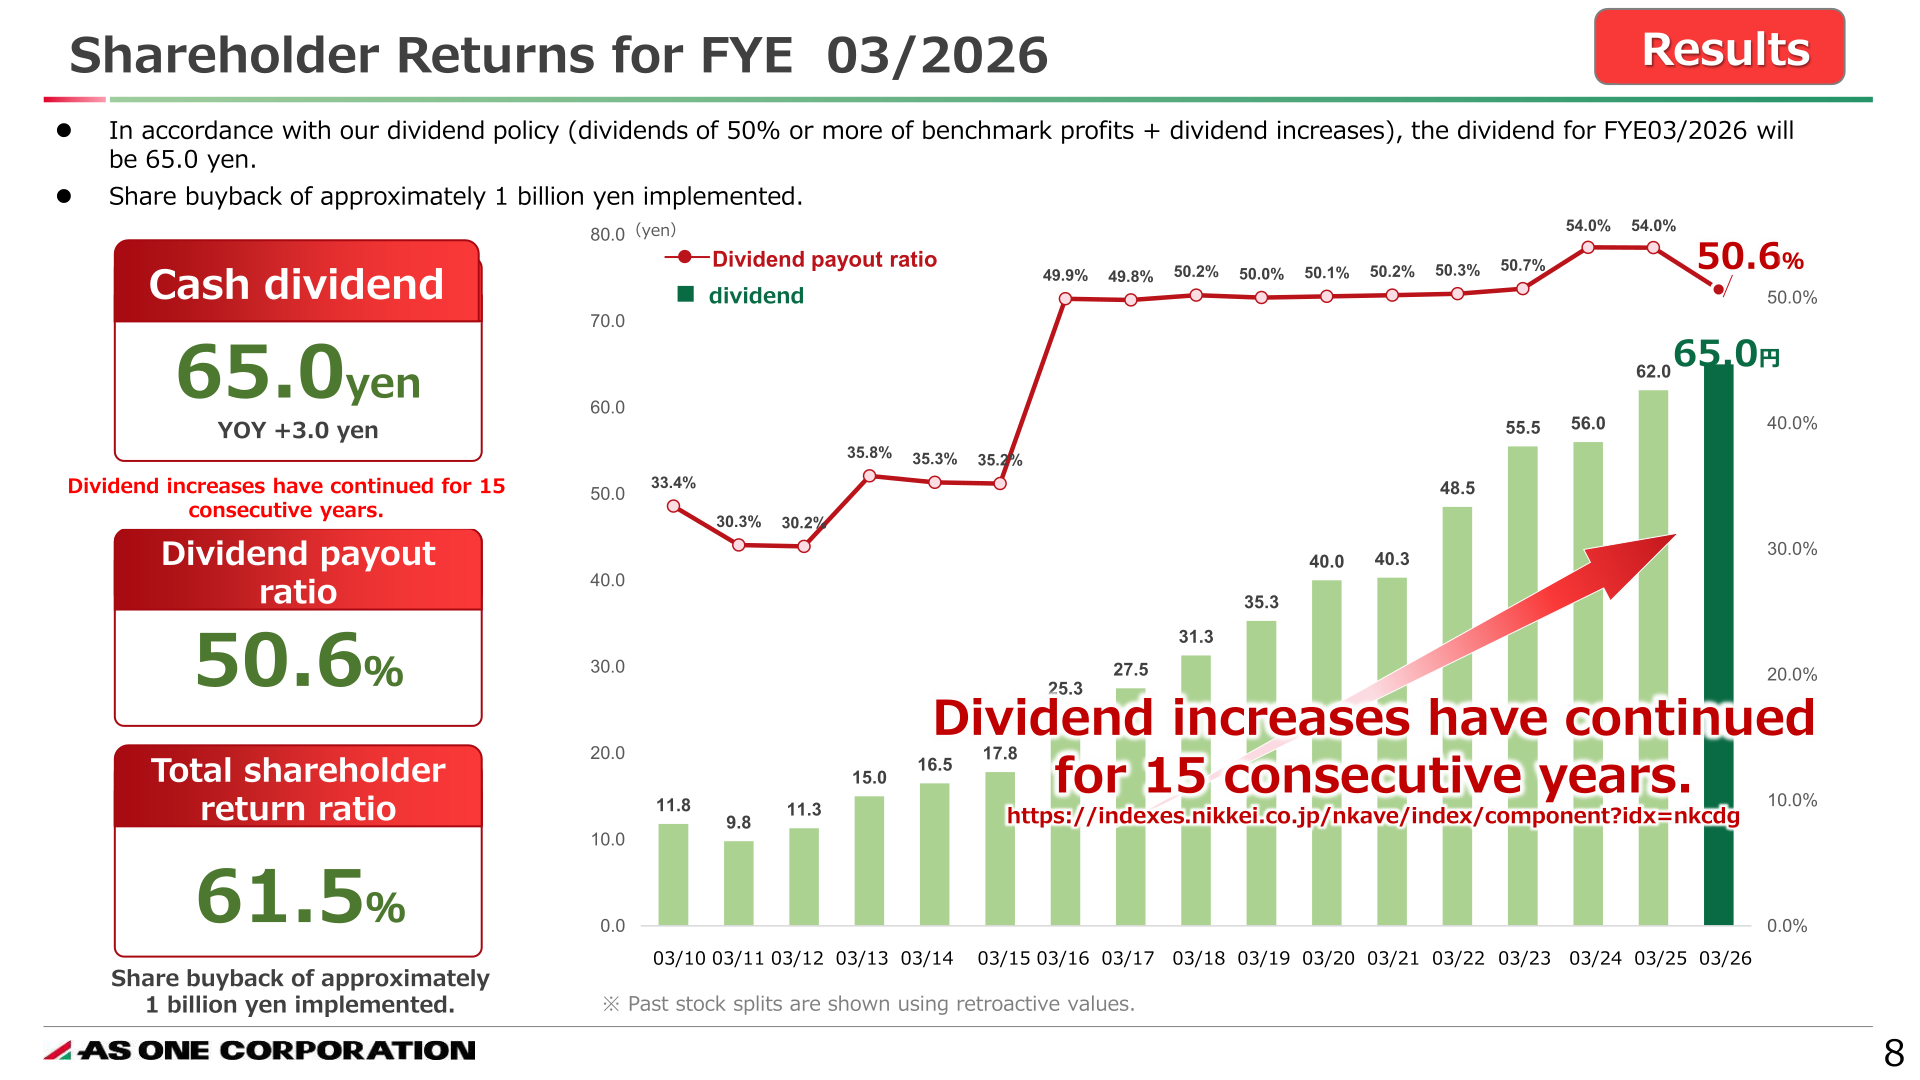
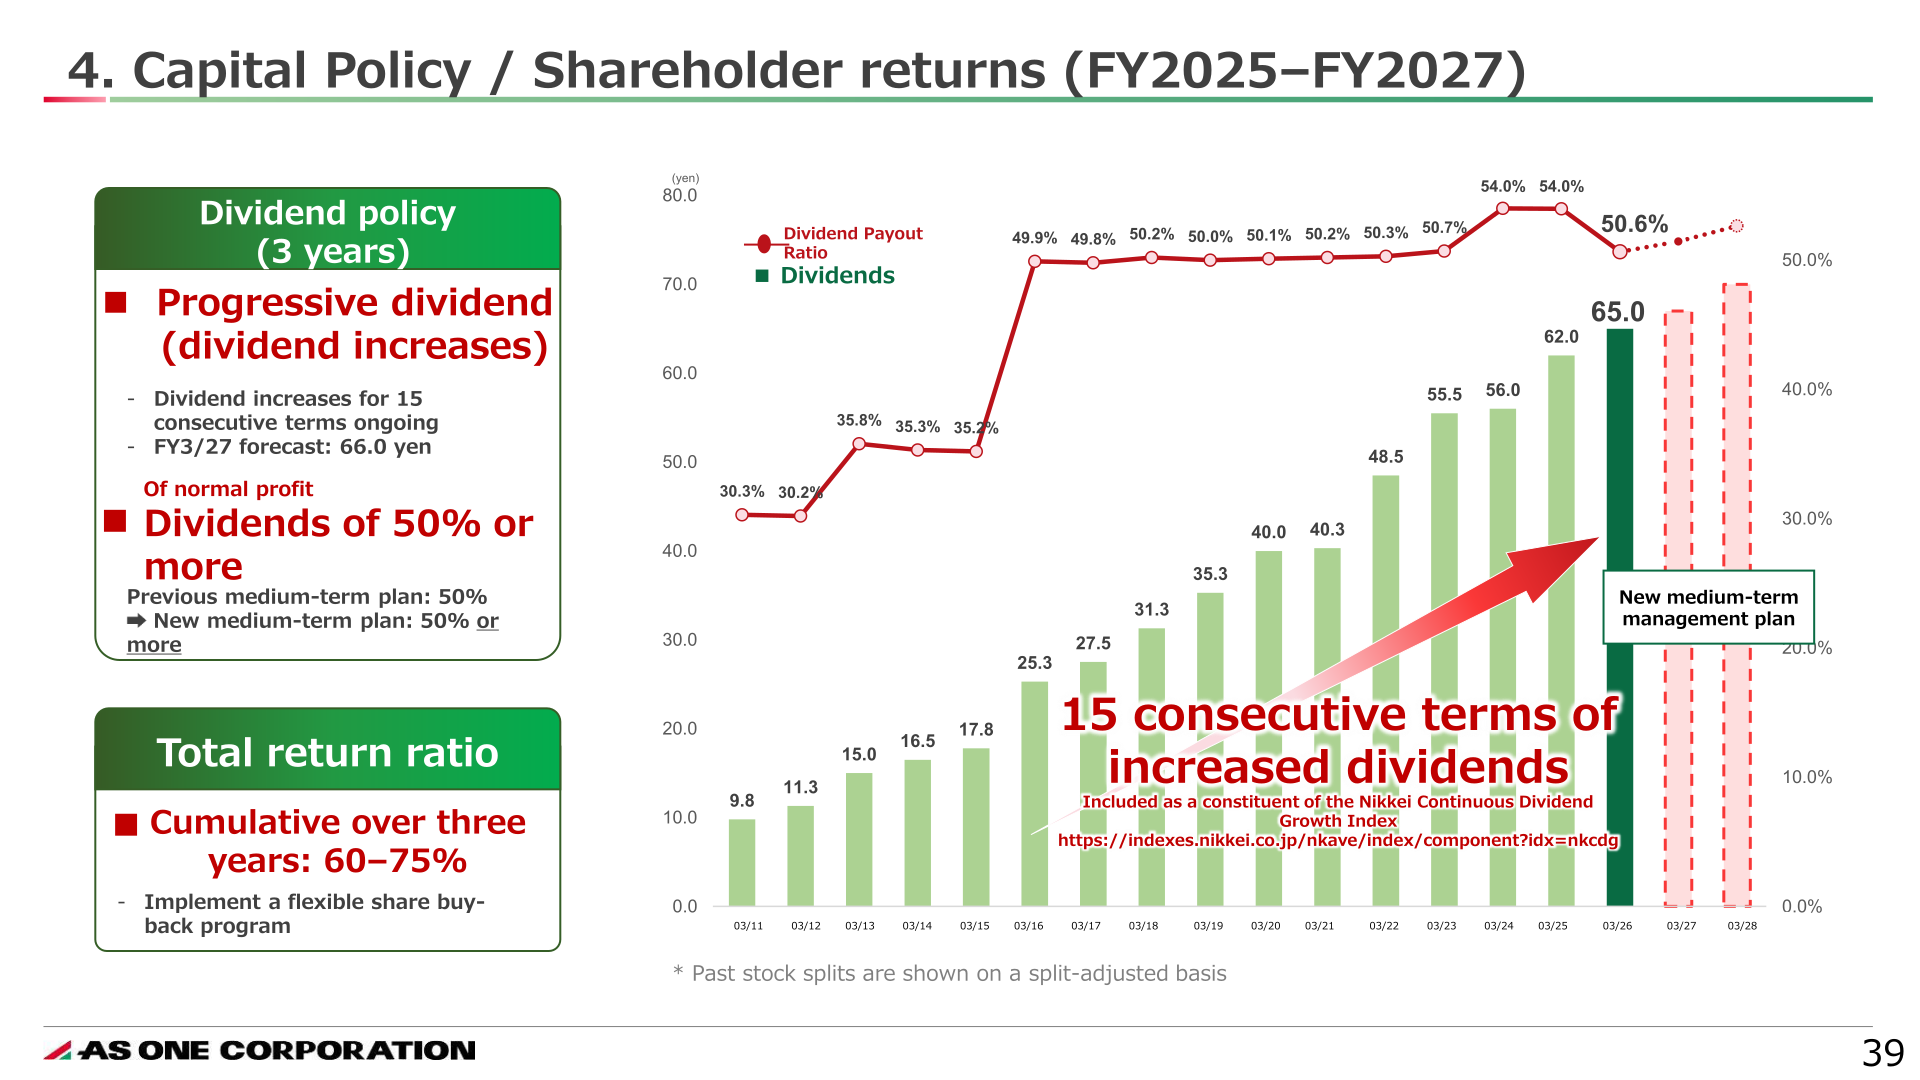
In accordance with its dividend policy of dividends of 50% or more of benchmark profits plus dividend increases, the dividend for FYE 03/2026 was 65.0 yen, an increase of 3.0 yen and the 15th consecutive year of dividend increases, for a dividend payout ratio of 50.6%. The company also implemented a share buyback of approximately 1 billion yen through market purchases, bringing the total shareholder return ratio, including dividends, to 61.5%. The dividend forecast for FYE 03/2027 is 66.0 yen. The decision regarding share buybacks this fiscal year will be made after assessing the impact of the situation in the Middle East.
| Item | FYE 03/2026 | FYE 03/2027 (Forecast) |
|---|---|---|
| Dividend per share | 65.00 yen | 66.00 yen |
| Dividend payout ratio | 50.6% | — |
| Total shareholder return ratio | 61.5% | — |
| Share buyback | Approximately 1 billion yen | To be decided after assessing the impact of the situation in the Middle East |
| Consecutive years of dividend increases | 15 | — |
Medium-Term Plan and Capital Policy
The shareholder return policy for the three years of the medium-term plan (FY2025–FY2027) sets a total return ratio of 60–75% cumulative over three years, a dividend payout ratio of 50% or more after excluding the impact of extraordinary gains and losses, progressive dividends, and a treasury share ratio of 5% or less. The cash allocation plan assumes operating cash flow of approximately 28.0 billion yen, with approximately 9.0 billion yen for business investment, approximately 16.0 billion yen for shareholder returns and approximately 10.0 billion yen for M&A and other strategic investments. For FYE 03/2026, operating cash flow plus the reduction of securities was 8.4 billion yen, against shareholder returns of 5.6 billion yen (dividends of 4.6 billion yen plus share buybacks of 1.0 billion yen) and business investment of 3.6 billion yen.
Key strategies center on strengthening e-commerce and the supply chain. The SHARE-DB product database collects information from more than 5,500 suppliers and covers approximately 14 million SKUs, an increase of 1.6 million items year on year, and is being combined with generative AI. The company has released two new services: “Mare’s”, a hospital inventory management service that adds inventory and order management functions to its e-commerce platform for medical and nursing care, and “4-Stock”, which displays supplier-held inventory data from 738 companies worth 170 billion yen on AXEL. On logistics, the newly established Kyushu DC has a total floor area of 8,453 square meters, 2.6 times the previous center, and Smart DC is being expanded to 11,916 square meters. Construction has begun on a new Rental & Calibration Center representing an investment of 2.8 billion yen with a total floor area of 6,000 square meters, three times the current center and four stories above ground, scheduled to become operational at the end of 2026.
Under the long-term vision “AS ONE VISION-2035”, the company targets consolidated net sales of 200 billion yen to 300 billion yen and ROE of 17% or more.
This article is an analysis based on publicly available information and is not a recommendation to buy or sell any specific securities. Investment decisions are your own responsibility.
![[Obayashi] Investors’ Guide 2026 — The Complete 24-Article Breakdown](https://japan-equity.com/wp-content/uploads/2026/07/hub_cover-1024x1024.png)
![[Obayashi] IR & SR Policy — Feeding Dialogue Back into Management](https://japan-equity.com/wp-content/uploads/2026/07/p32_sq-1024x1024.jpg)
![[Obayashi] Real Estate Development — 18.7% Margin, ¥287.7bn Unrealized Gains](https://japan-equity.com/wp-content/uploads/2026/07/p20_sq-1024x1024.jpg)
![[Obayashi] Domestic Civil Engineering — Resilience Spending Supports 9.6% Margin](https://japan-equity.com/wp-content/uploads/2026/07/p11_sq-1024x1024.jpg)
![[Obayashi] Share Price & External Ratings — vs TOPIX, ESG Index Inclusion](https://japan-equity.com/wp-content/uploads/2026/07/p40_sq-1024x1024.jpg)
![[Construction] ¥75.5tn Investment, Shrinking Workforce — Big-5 Market Share](https://japan-equity.com/wp-content/uploads/2026/07/p12_sq-1024x1024.jpg)



![[Obayashi] Capital Policy & Shareholder Returns — ROE 10%+, DOE ~5%, ¥100bn Buyback](https://japan-equity.com/wp-content/uploads/2026/07/p27_sq-1024x1024.jpg)
![[Obayashi] Reducing Cross-Shareholdings — ¥285.2bn Sold in Five Years](https://japan-equity.com/wp-content/uploads/2026/07/p29_sq-1024x1024.jpg)
![[Obayashi] ¥750bn Investment Plan — ¥300bn to Development, ¥190bn to Tech/DX](https://japan-equity.com/wp-content/uploads/2026/07/p30_sq-1024x1024.jpg)
![[Obayashi] MTP2022 KPIs — Operating Profit ~2x Target, ROE 14.4%](https://japan-equity.com/wp-content/uploads/2026/07/p25_sq-1024x1024.jpg)
![[Obayashi] Cash Allocation — ¥420bn Investment CF Over Five Years](https://japan-equity.com/wp-content/uploads/2026/07/p26_sq-1024x1024.jpg)
![[Obayashi] Green Energy — 44 Plants, 344MW, and the Green Hydrogen Challenge](https://japan-equity.com/wp-content/uploads/2026/07/p21_sq-1024x1024.jpg)
![[Obayashi] Tackling the Labor Shortage — Robotics Construction®](https://japan-equity.com/wp-content/uploads/2026/07/p14_sq-1024x1024.jpg)
