
This article is based on publicly available IR materials and is not a recommendation to buy or sell any specific securities.
Note: Ryohin Keikaku’s fiscal year ends in August, and the company labels the year ended August 31, 2025 as “FY25/8”; the labels used in this article follow the materials, and this fiscal year is classified as FY2025 on this site. Ryohin Keikaku, the operator of the MUJI brand, reported operating revenue of 784.6 billion yen for FY25/8 (12 months), 118.6% of the prior year, with operating profit of 73.8 billion yen (131.5% YoY) and net income attributable to owners of parent of 50.8 billion yen (122.3% YoY). The materials state that operating revenue and all levels of profit for FY25/8 reached record highs, marking the second consecutive year of record results, and that the outcome exceeded the revised forecast announced in July. Management attributes the performance to the continued success of enhanced product development and promotion strategy, with particularly strong sales in the overseas business, especially mainland China, Europe and North America.
Consolidated Results (FY25/8 Full-Year Actual)
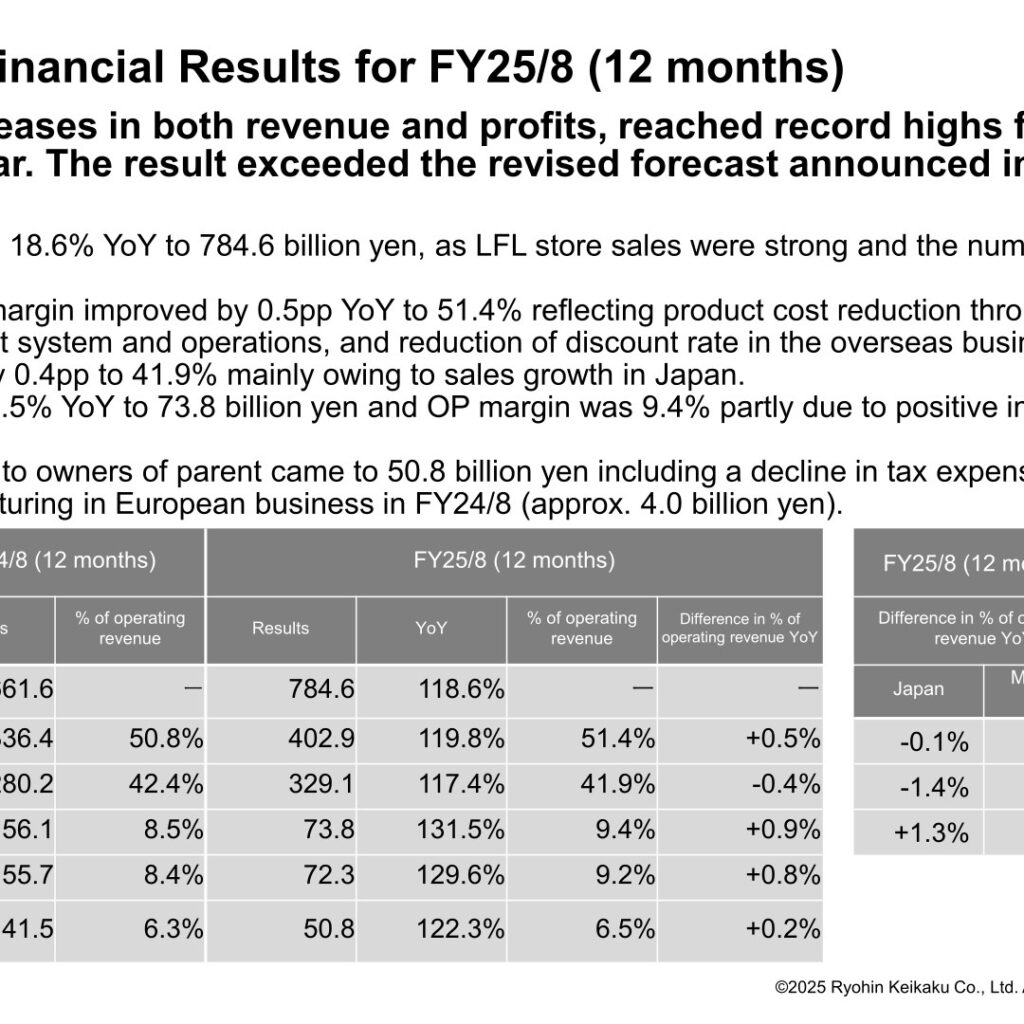
Operating revenue rose 18.6% YoY to 784.6 billion yen, as LFL store sales were strong and the number of stores in Japan and overseas increased. Operating gross profit margin improved by 0.5pp YoY to 51.4%, reflecting product cost reduction through strengthening of the in-house production management system and operations, and a reduction of the discount rate in the overseas business. The SG&A ratio improved by 0.4pp to 41.9%, mainly owing to sales growth in Japan. Operating profit rose 31.5% YoY to 73.8 billion yen and the operating profit margin was 9.4%, partly due to a positive impact from foreign exchange rates. Net income attributable to owners of parent came to 50.8 billion yen, including a decline in tax expense due to the reorganizational restructuring in the European business in FY24/8 (approx. 4.0 billion yen).
| Item (billion yen) | FY25/8 (12 months) | FY24/8 (12 months) | YoY |
|---|---|---|---|
| Operating revenue | 784.6 | 661.6 | 118.6% |
| Operating gross profit | 402.9 | 336.4 | 119.8% |
| SG&A | 329.1 | 280.2 | 117.4% |
| Operating profit | 73.8 | 56.1 | 131.5% |
| Ordinary profit | 72.3 | 55.7 | 129.6% |
| Net income attributable to owners of parent | 50.8 | 41.5 | 122.3% |
| Operating gross profit margin | 51.4% | 50.8% | +0.5% |
| SG&A ratio | 41.9% | 42.4% | -0.4% |
| Operating profit margin | 9.4% | 8.5% | +0.9% |
The results exceeded both the forecast announced in July and the initial forecast. Against the July forecast, operating revenue was 776.0 billion yen, operating profit 70.0 billion yen, ordinary profit 67.0 billion yen and net income attributable to owners of parent 47.0 billion yen; against the initial forecast, the figures were 734.0 billion yen, 55.0 billion yen, 53.0 billion yen and 38.0 billion yen respectively. On the balance sheet, total assets stood at 562.7 billion yen as of August 31, 2025 (up 53.1 billion yen), inventories at 169.9 billion yen (up 15.9 billion yen, an increase below the 18% rate of sales growth) and net assets at 335.9 billion yen (up 38.9 billion yen). Inventory turnover improved from 2.26 times/year in FY24/8 to 2.36 times/year. Operating cash flow provided 73.3 billion yen, investing cash flow used 40.9 billion yen and financing cash flow used 22.1 billion yen, leaving free cash flow of 32.4 billion yen; total capital expenditure was 40.9 billion yen.
Segment Results
Each segment achieved YoY growth in both revenue and profit. Operating revenue increased by 123 billion yen YoY, with an increase of 81.2 billion yen in Japan and 41.7 billion yen from overseas. Operating profit increased by 17.7 billion yen YoY, including an increase of 12.4 billion yen in Japan and 9.7 billion yen from overseas, while the year-over-year impact of foreign exchange fluctuations was insignificant. Global SG&A increased by 4.5 billion yen, mainly due to the enhancement of the production management system and IT related cost.
| Segment (billion yen) | Operating revenue FY25/8 | YoY | Operating profit FY25/8 | YoY | Operating profit margin FY25/8 |
|---|---|---|---|---|---|
| Consolidated | 784.6 | 118.6% | 73.8 | 131.5% | 9.4% |
| Japan business | 470.1 | 120.9% | 52.1 | 131.2% | 11.1% |
| Overseas total | 314.4 | 115.3% | 55.3 | 121.2% | 17.6% |
| East Asia | 222.2 | 114.2% | 42.7 | 120.4% | 19.3% |
| Southeast Asia and Oceania | 50.1 | 128.0% | 5.5 | 121.4% | 11.1% |
| Europe and North America | 42.1 | 107.9% | 6.9 | 125.7% | 16.4% |
| Global SG&A | – | – | -33.7 | 115.2% | -4.3% |
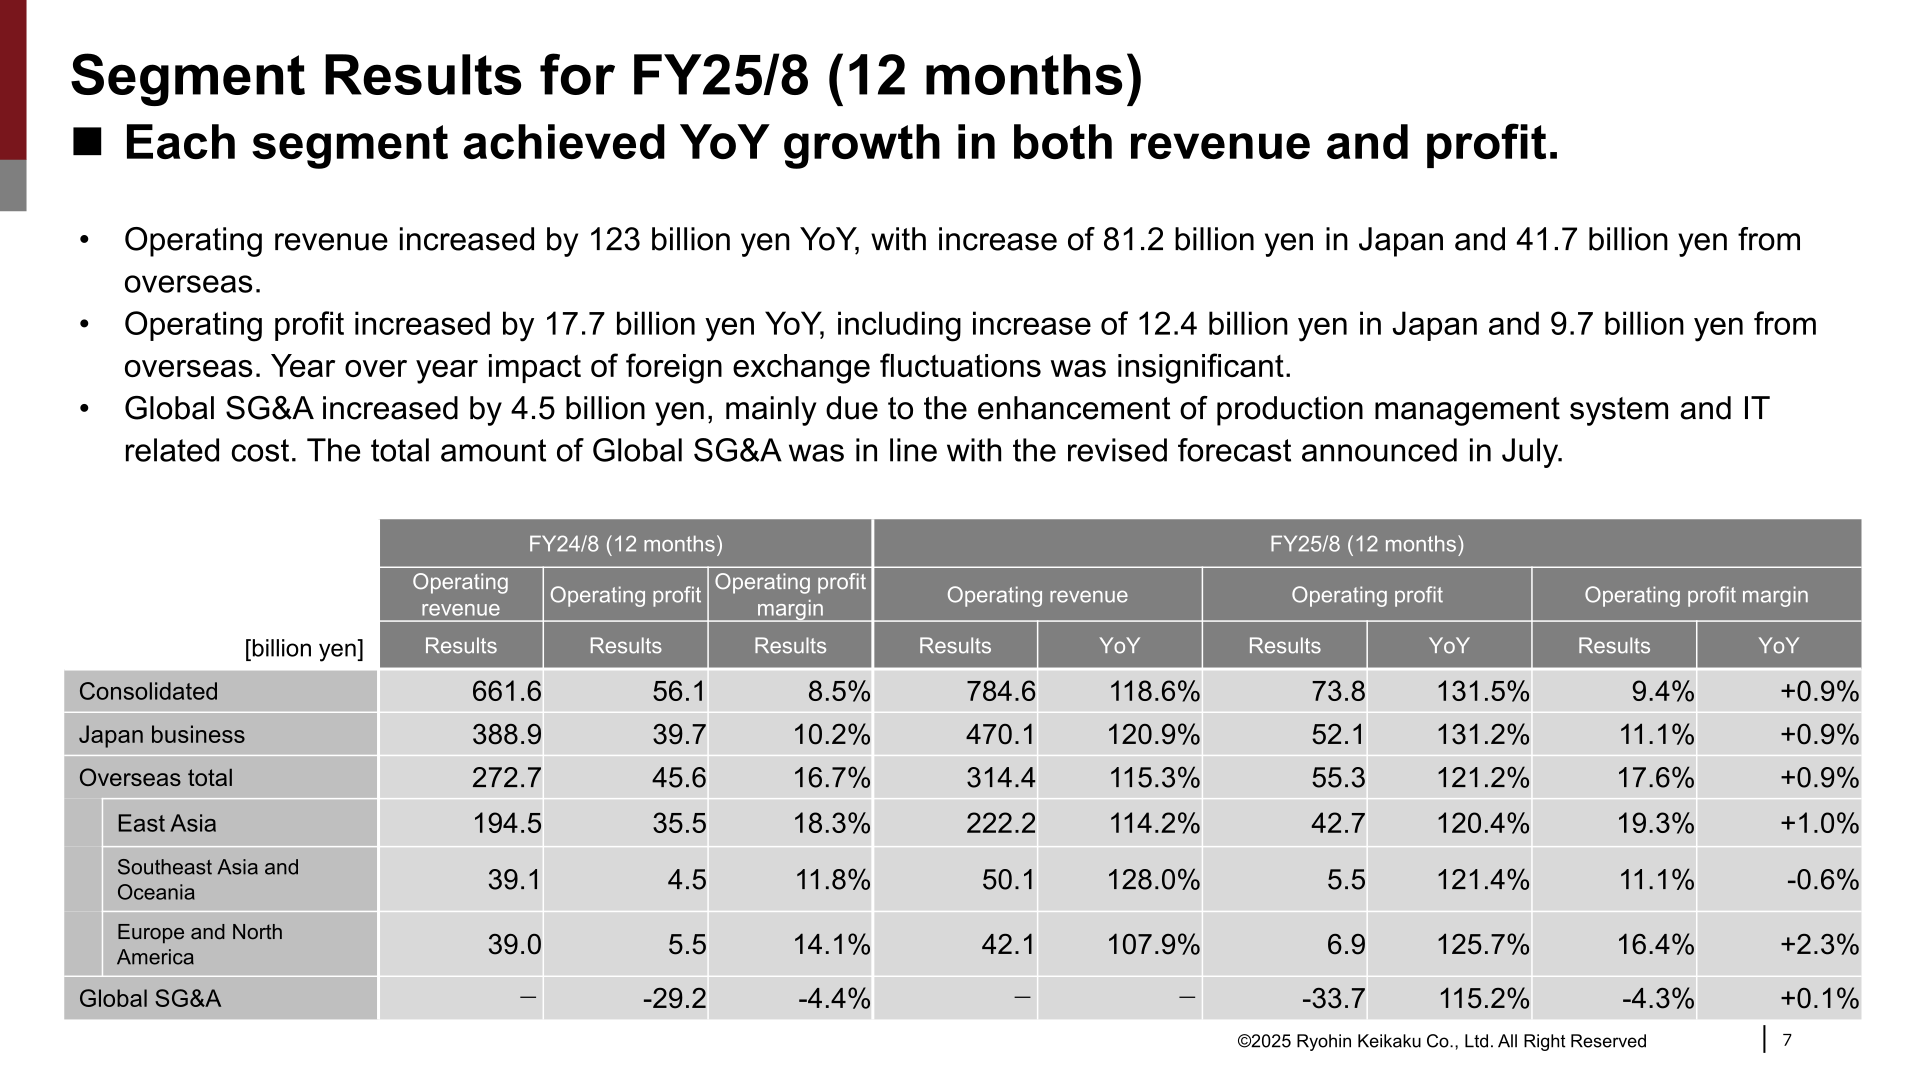
In the Japan business, full-year sales at LFL directly managed stores plus the online store were 113.5% YoY, with Apparel at 111.5%, Household goods at 115.6% and Food at 111.1%, all posting double-digit growth. Within Household goods, Health & Beauty and Houseware (daily supplies) were strong; the share of Health & Beauty in overall sales increased by 5pp to 22% compared with two years ago and its sales exceeded 100 billion yen. In East Asia, LFL store plus EC sales in mainland China were 110.0% YoY for the 12 months, and the East Asia operating profit margin improved by 1.0pp to 19.3% on an improved COGS ratio. In Southeast Asia and Oceania, operating revenue rose to 50.1 billion yen as the number of stores increased, though on a local accounting basis profit declined due to upfront expenses related to new store openings. In Europe and North America, LFL store plus EC sales grew 112.3% YoY and the operating profit margin rose to 16.4% following the closure of unprofitable stores and the effect of structural reforms.
Store Network
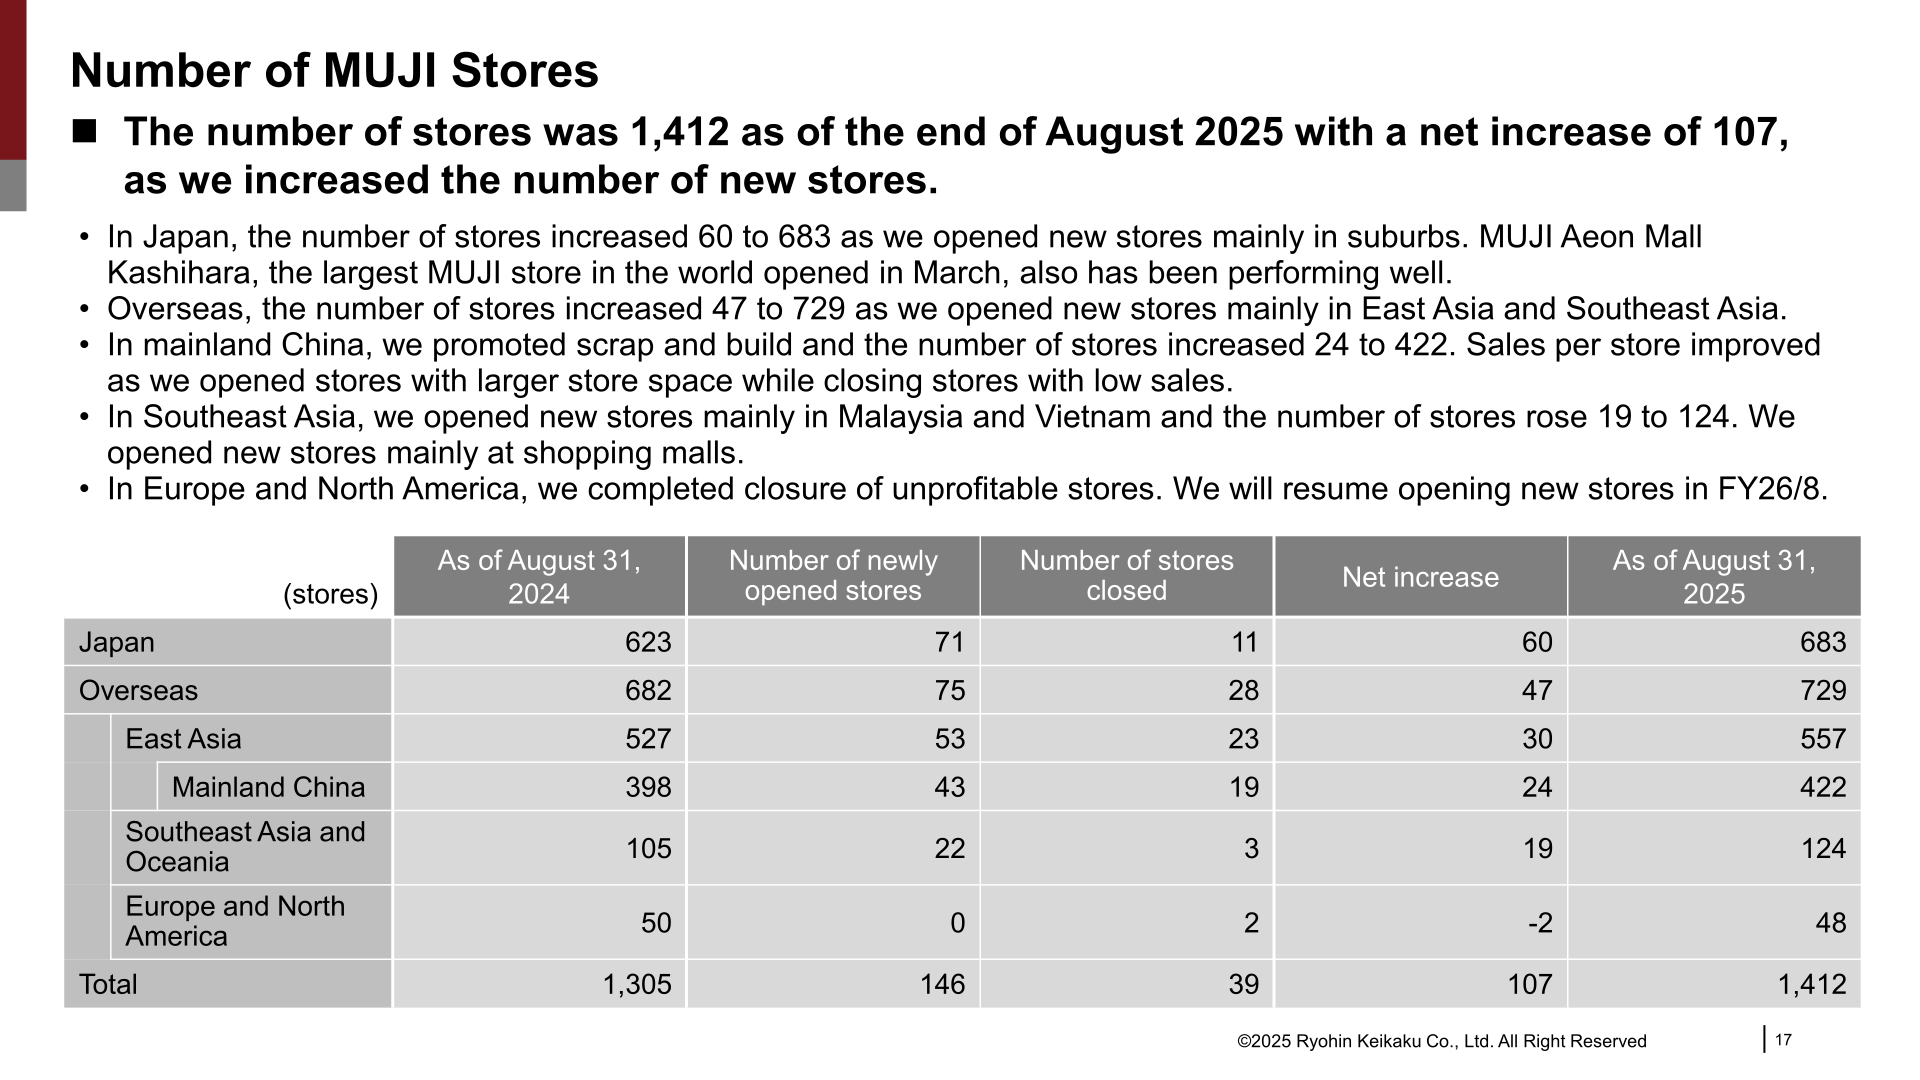
The number of MUJI stores was 1,412 as of the end of August 2025, a net increase of 107. In Japan the number of stores increased by 60 to 683, with new stores opened mainly in suburbs, including MUJI Aeon Mall Kashihara, described as the largest MUJI store in the world, which opened in March. Overseas the count increased by 47 to 729. In mainland China, scrap and build was promoted and the store count increased by 24 to 422. In Southeast Asia, new stores were opened mainly in Malaysia and Vietnam, lifting the count by 19 to 124. In Europe and North America, the closure of unprofitable stores was completed and the count fell by 2 to 48.
| Region (stores) | As of August 31, 2024 | Newly opened | Closed | Net increase | As of August 31, 2025 |
|---|---|---|---|---|---|
| Japan | 623 | 71 | 11 | 60 | 683 |
| Overseas | 682 | 75 | 28 | 47 | 729 |
| East Asia | 527 | 53 | 23 | 30 | 557 |
| Mainland China | 398 | 43 | 19 | 24 | 422 |
| Southeast Asia and Oceania | 105 | 22 | 3 | 19 | 124 |
| Europe and North America | 50 | 0 | 2 | -2 | 48 |
| Total | 1,305 | 146 | 39 | 107 | 1,412 |
FY26/8 Plan
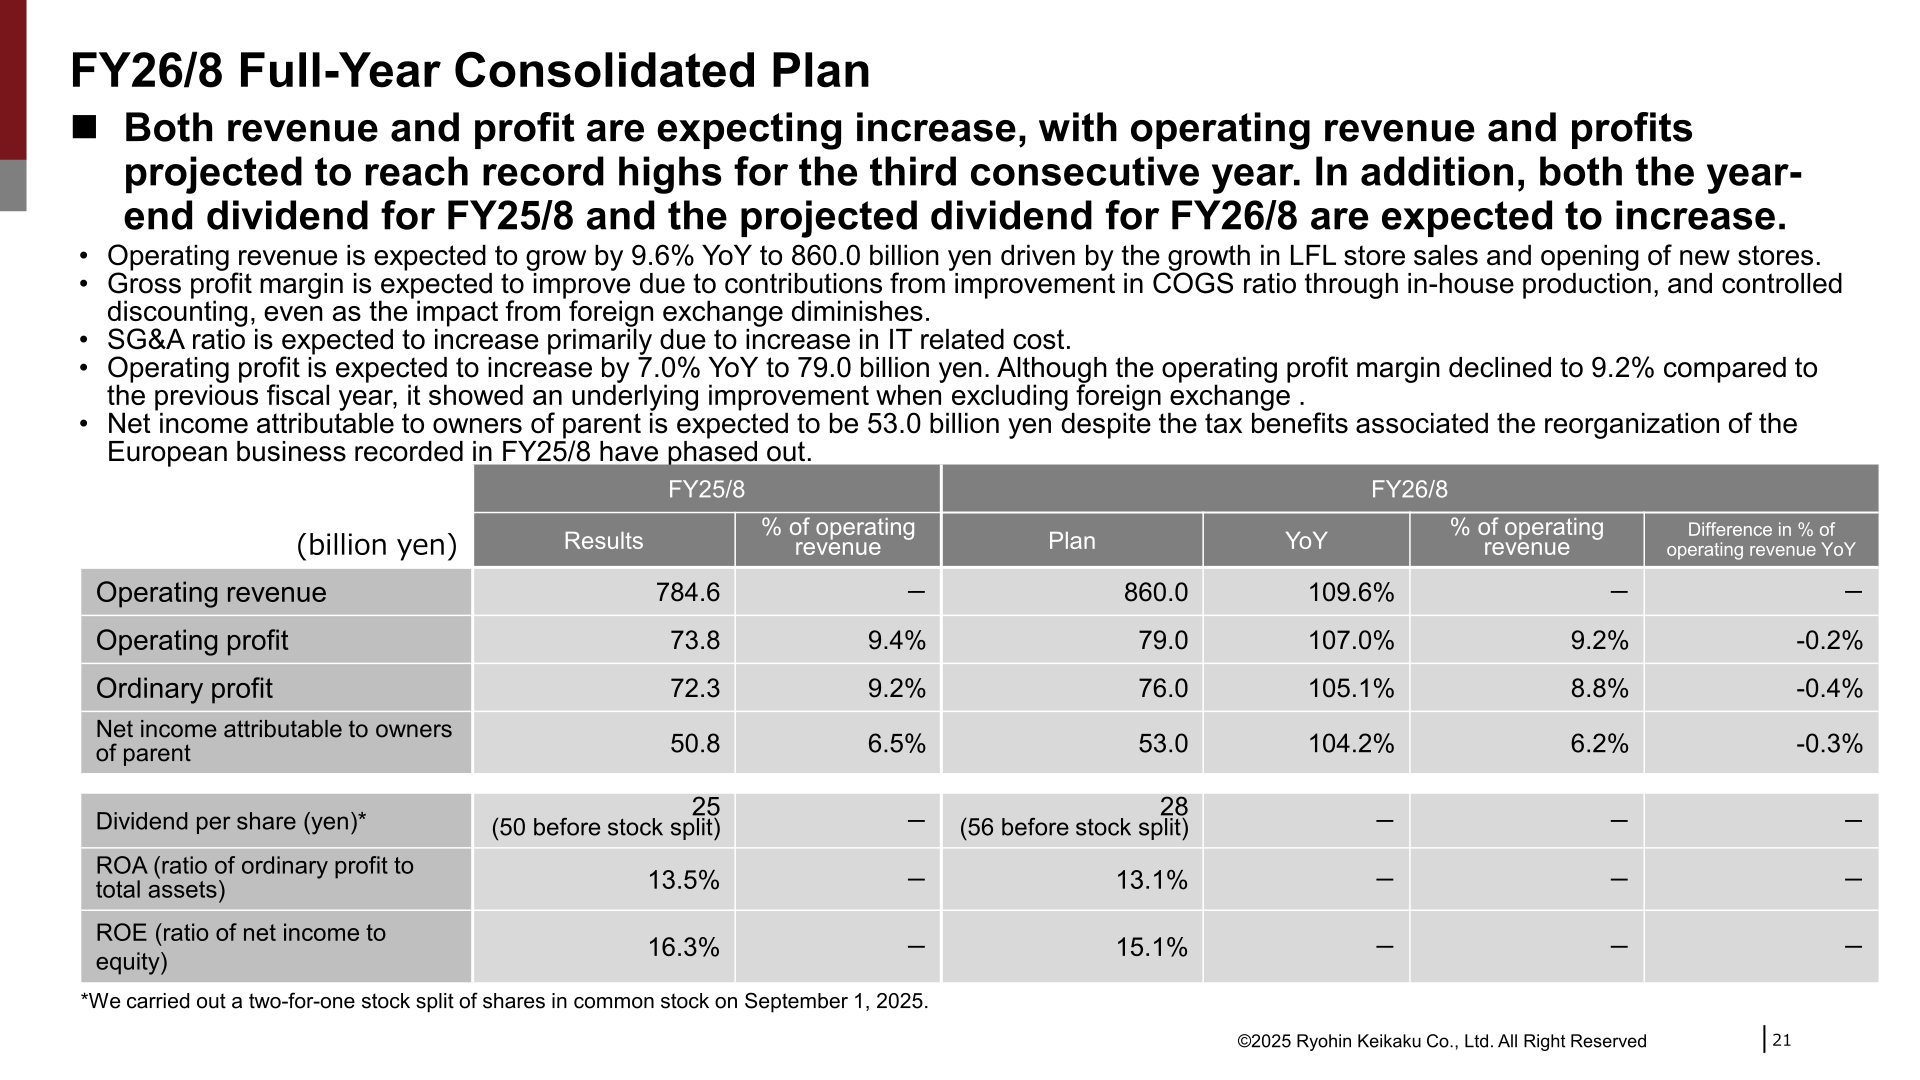
For FY26/8, operating revenue is expected to grow by 9.6% YoY to 860.0 billion yen, driven by growth in LFL store sales and the opening of new stores. Gross profit margin is expected to improve on an improved COGS ratio through in-house production and controlled discounting, even as the impact from foreign exchange diminishes, while the SG&A ratio is expected to increase primarily due to higher IT related cost. Operating profit is expected to increase by 7.0% YoY to 79.0 billion yen; although the operating profit margin declines to 9.2% compared with the previous fiscal year, the company states it shows an underlying improvement when excluding foreign exchange. Net income attributable to owners of parent is expected to be 53.0 billion yen despite the phasing out of the tax benefits associated with the reorganization of the European business recorded in FY25/8. Operating revenue and profits are projected to reach record highs for the third consecutive year.
| Item (billion yen) | FY26/8 Plan | FY25/8 Result | YoY |
|---|---|---|---|
| Operating revenue | 860.0 | 784.6 | 109.6% |
| Operating profit | 79.0 | 73.8 | 107.0% |
| Ordinary profit | 76.0 | 72.3 | 105.1% |
| Net income attributable to owners of parent | 53.0 | 50.8 | 104.2% |
| Operating profit margin | 9.2% | 9.4% | -0.2% |
| Dividend per share (yen) | 28 (56 before stock split) | 25 (50 before stock split) | – |
| ROA (ratio of ordinary profit to total assets) | 13.1% | 13.5% | – |
| ROE (ratio of net income to equity) | 15.1% | 16.3% | – |
By segment, the FY26/8 plan calls for Japan operating revenue of 510.0 billion yen (108.5% YoY) and operating profit of 59.7 billion yen (114.6% YoY), overseas operating revenue of 350.0 billion yen (111.3%) and operating profit of 59.0 billion yen (106.7%), with East Asia at 245.5 billion yen and 47.2 billion yen, Southeast Asia and Oceania at 59.5 billion yen and 6.3 billion yen, and Europe and North America at 45.0 billion yen and 5.5 billion yen (79.5% YoY, as the SG&A ratio rises and the foreign exchange impact diminishes). Global SG&A is expected to be 39.6 billion yen. The plan for LFL directly managed stores plus online store sales is 102% YoY in Japan, 104% in East Asia (including 104% in mainland China), 103% in Southeast Asia and Oceania and 106% in Europe and North America. The number of stores is expected to reach 1,508 as of August 31, 2026, with 132 openings and 36 closures, and capital investment is projected at 40.7 billion yen.
Shareholder Returns
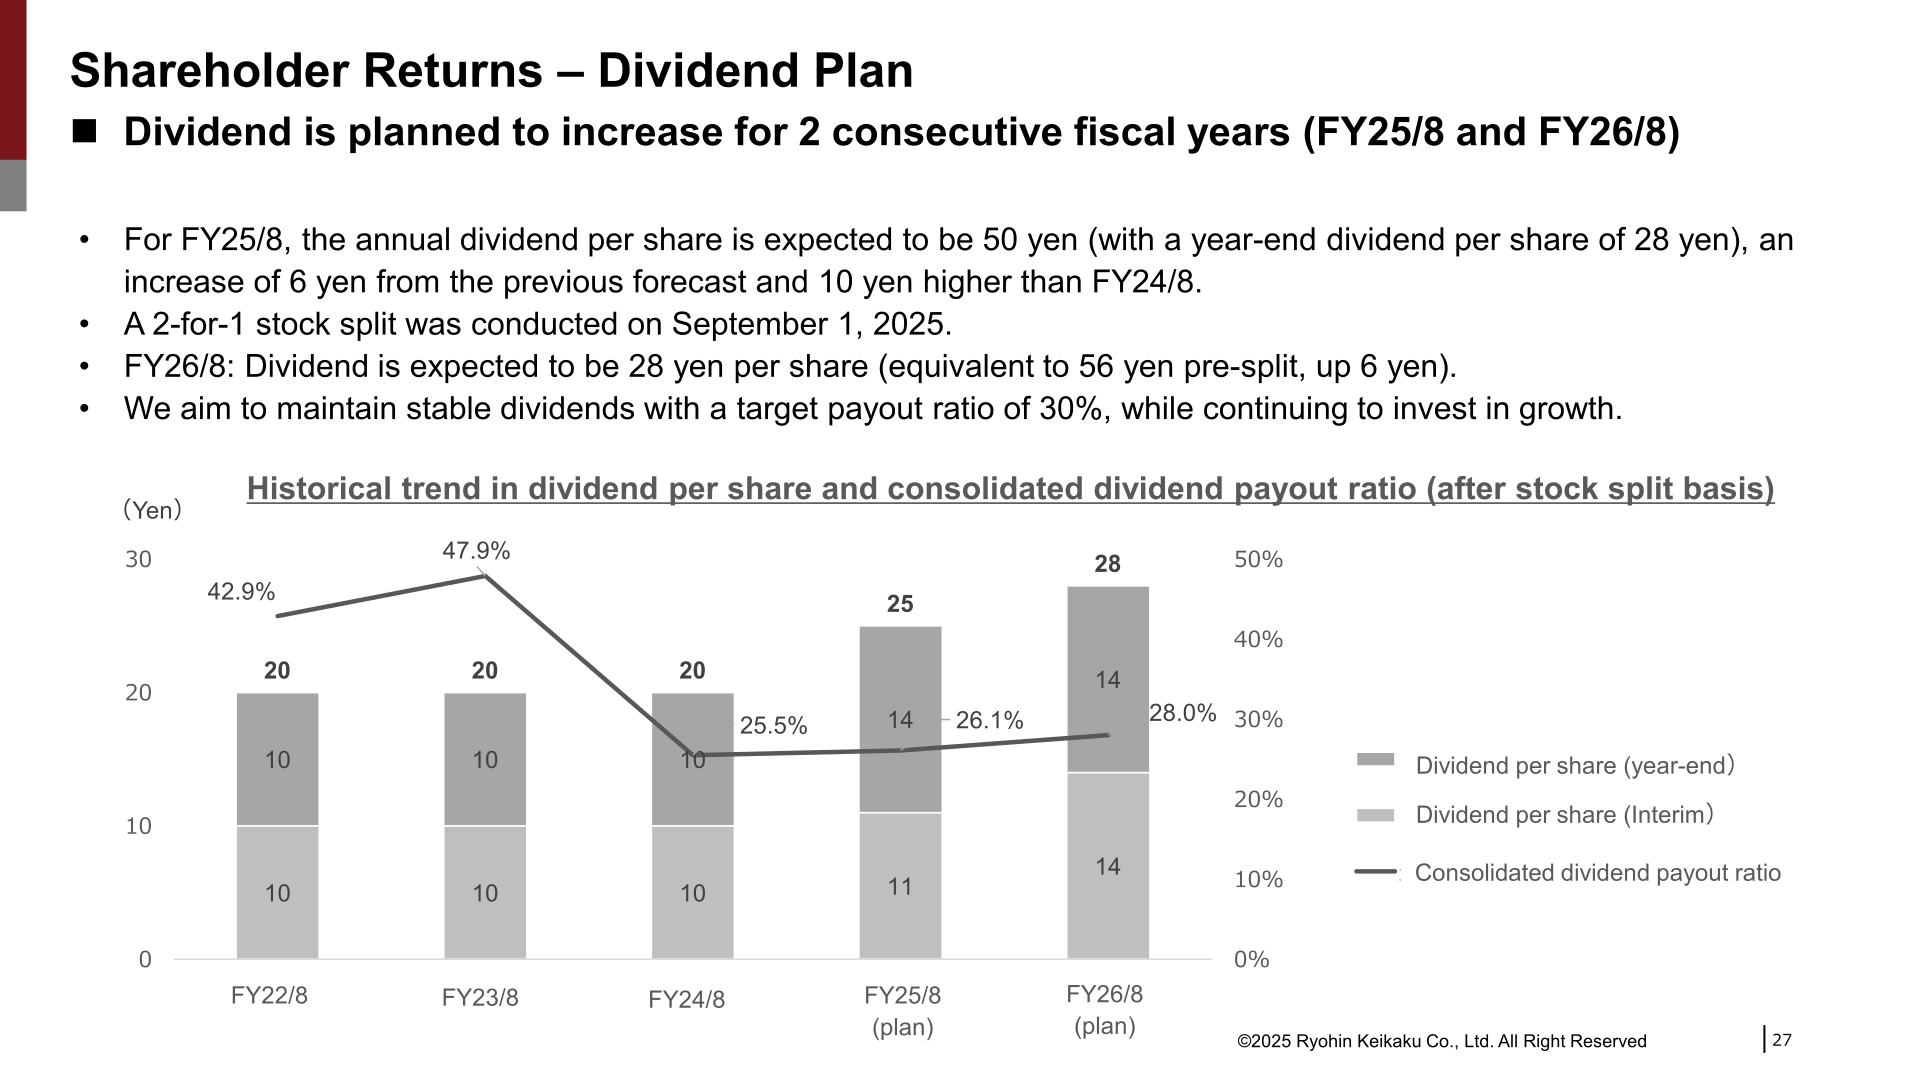
For FY25/8, the annual dividend per share is expected to be 50 yen (with a year-end dividend per share of 28 yen), an increase of 6 yen from the previous forecast and 10 yen higher than FY24/8. A 2-for-1 stock split of shares of common stock was conducted on September 1, 2025. For FY26/8, the dividend is expected to be 28 yen per share (equivalent to 56 yen pre-split, up 6 yen), meaning the dividend is planned to increase for two consecutive fiscal years. The company aims to maintain stable dividends with a target payout ratio of 30%, while continuing to invest in growth. Under its financial policy, Ryohin Keikaku plans to invest approximately 60% of operating cash flow into business growth and to provide shareholder returns with a dividend payout ratio of 30%, equivalent to approximately 20% of operating cash flow, while managing the balance sheet with the goal of maintaining an A rating or higher and consistently targeting ROA and ROE of 15% or more.
Three-Year Rolling Plan and Growth Drivers
Ryohin Keikaku presented a 3 Year Rolling Plan covering FY26/8 to FY28/8, targeting operating revenue of 1,080.0 billion yen and operating profit of 108.0 billion yen with an operating profit margin of 10.0% in FY28/8, implying a three-year CAGR of 11.2% for operating revenue and 13.5% for operating profit. The interim step is operating revenue of 950.0 billion yen and operating profit of 89.0 billion yen in FY27/8. The company states that progress is currently one year ahead of schedule compared with the original three-year mid-term plan covering FY25/8 to FY27/8, and that the goal of achieving 1 trillion yen in operating revenue and 100 billion yen in operating profit is now targeted for FY28/8, with profitability to be raised further toward 12% thereafter. By the end of FY28/8 the total number of stores is expected to reach 1,750, and overseas sales are expected to reach 500 billion yen, accounting for 46% of total revenue.
The strategy is organized around 8 Growth Drivers for Global Growth, covering enhancement of product development capabilities, store expansion, deployment of operations developed in Japan, marketing strategy, strengthening OMO, improving operational efficiency and SCM transformation, IT-driven support, and ESG as a core business strategy. Specific initiatives disclosed include opening MUJI’s first European flagship store on Rue de Rivoli in Paris around autumn to winter in 2026 with over 600 tsubo (approx. 1,980 square meters) of sales floor, raising the coverage of Household goods in overseas stores to 80% of the Japanese product lineup by the end of FY26/8 (from 60% in FY25/8 and a planned 70% in FY26/8), and increasing the overseas Food sales ratio from 4% to over 7%. In FY25/8, production management bases were expanded from mainland China and Vietnam to Cambodia, India and Indonesia, and product costs were reduced by approximately 1%, a level of progress the company describes as surpassing initial expectations.
This article is an analysis based on publicly available information and is not a recommendation to buy or sell any specific securities. Investment decisions are your own responsibility.
![[Obayashi] Investors’ Guide 2026 — The Complete 24-Article Breakdown](https://japan-equity.com/wp-content/uploads/2026/07/hub_cover-1024x1024.png)
![[Obayashi] IR & SR Policy — Feeding Dialogue Back into Management](https://japan-equity.com/wp-content/uploads/2026/07/p32_sq-1024x1024.jpg)
![[Obayashi] Real Estate Development — 18.7% Margin, ¥287.7bn Unrealized Gains](https://japan-equity.com/wp-content/uploads/2026/07/p20_sq-1024x1024.jpg)
![[Obayashi] Domestic Civil Engineering — Resilience Spending Supports 9.6% Margin](https://japan-equity.com/wp-content/uploads/2026/07/p11_sq-1024x1024.jpg)
![[Obayashi] Share Price & External Ratings — vs TOPIX, ESG Index Inclusion](https://japan-equity.com/wp-content/uploads/2026/07/p40_sq-1024x1024.jpg)
![[Construction] ¥75.5tn Investment, Shrinking Workforce — Big-5 Market Share](https://japan-equity.com/wp-content/uploads/2026/07/p12_sq-1024x1024.jpg)



![[Obayashi] Capital Policy & Shareholder Returns — ROE 10%+, DOE ~5%, ¥100bn Buyback](https://japan-equity.com/wp-content/uploads/2026/07/p27_sq-1024x1024.jpg)
![[Obayashi] Reducing Cross-Shareholdings — ¥285.2bn Sold in Five Years](https://japan-equity.com/wp-content/uploads/2026/07/p29_sq-1024x1024.jpg)
![[Obayashi] ¥750bn Investment Plan — ¥300bn to Development, ¥190bn to Tech/DX](https://japan-equity.com/wp-content/uploads/2026/07/p30_sq-1024x1024.jpg)
![[Obayashi] MTP2022 KPIs — Operating Profit ~2x Target, ROE 14.4%](https://japan-equity.com/wp-content/uploads/2026/07/p25_sq-1024x1024.jpg)
![[Obayashi] Cash Allocation — ¥420bn Investment CF Over Five Years](https://japan-equity.com/wp-content/uploads/2026/07/p26_sq-1024x1024.jpg)
![[Obayashi] Green Energy — 44 Plants, 344MW, and the Green Hydrogen Challenge](https://japan-equity.com/wp-content/uploads/2026/07/p21_sq-1024x1024.jpg)
![[Obayashi] Tackling the Labor Shortage — Robotics Construction®](https://japan-equity.com/wp-content/uploads/2026/07/p14_sq-1024x1024.jpg)
