
This article is based on publicly available IR materials and is not a recommendation to buy or sell any specific securities.
Note: KAPPA-CREATE CO., LTD. does not publish an English results presentation; this article is an English translation of the Japanese-language article on our sister site Investalk, which is based on the company’s Japanese-language IR materials, with figures transcribed as reported. The company has a March fiscal year-end, and this site classifies its most recently completed fiscal year (ended March 31, 2026) as FY2025 in the title; the labels used in the body and tables follow the source materials (FY3/2026, FY3/2025, FY3/2027). Negative figures are shown with the ▲ symbol used in the source materials.
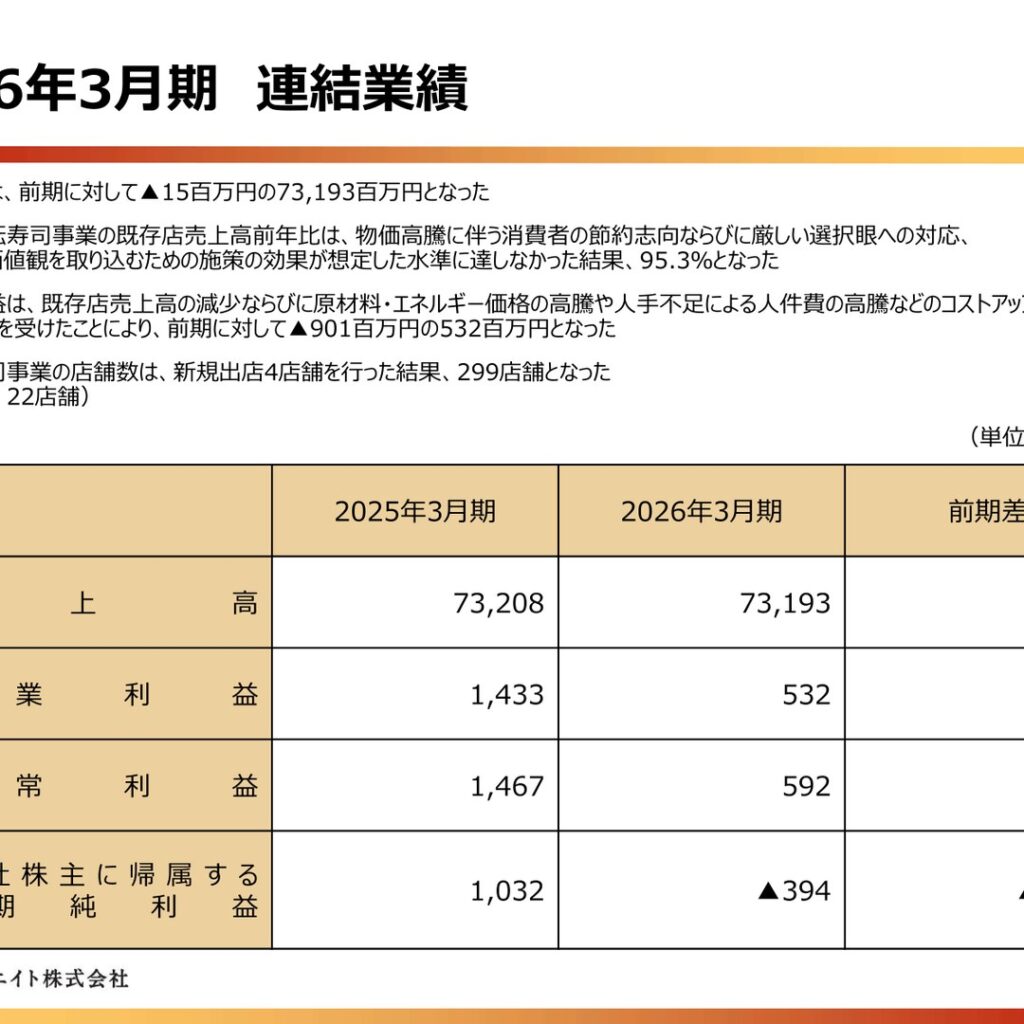
Kappa Create’s consolidated results for FY3/2026 showed revenue of 73,193 million yen, roughly flat at ▲15 million yen versus the previous fiscal year, while operating profit declined by ▲901 million yen to 532 million yen and ordinary profit declined by ▲875 million yen to 592 million yen. Profit attributable to owners of parent swung from 1,032 million yen in the previous fiscal year to a loss of ▲394 million yen. Year-on-year same-store sales in the domestic conveyor-belt sushi business came to 95.3%, and with four new store openings the store count reached 299.
Consolidated Results (FY3/2026 Actual)
Year-on-year same-store sales in the domestic conveyor-belt sushi business came to 95.3%, as the effects of measures responding to consumers’ thrift-orientation and increasingly discerning eye amid rising prices, and of measures intended to capture diverse sets of values, did not reach the assumed level. Operating profit was 532 million yen, down ▲901 million yen year on year, reflecting the decline in same-store sales together with continued cost increases from soaring raw material and energy prices and from higher personnel expenses caused by labor shortages. As a result of four new store openings, the conveyor-belt sushi business had 299 stores (of which 22 were renovated stores).
| Item | FY3/2026 | FY3/2025 | Change vs. previous year |
|---|---|---|---|
| Revenue | 73,193 million yen | 73,208 million yen | ▲15 million yen |
| Operating profit | 532 million yen | 1,433 million yen | ▲901 million yen |
| Ordinary profit | 592 million yen | 1,467 million yen | ▲875 million yen |
| Profit attributable to owners of parent | ▲394 million yen | 1,032 million yen | ▲1,426 million yen |
Quarterly Earnings Trends
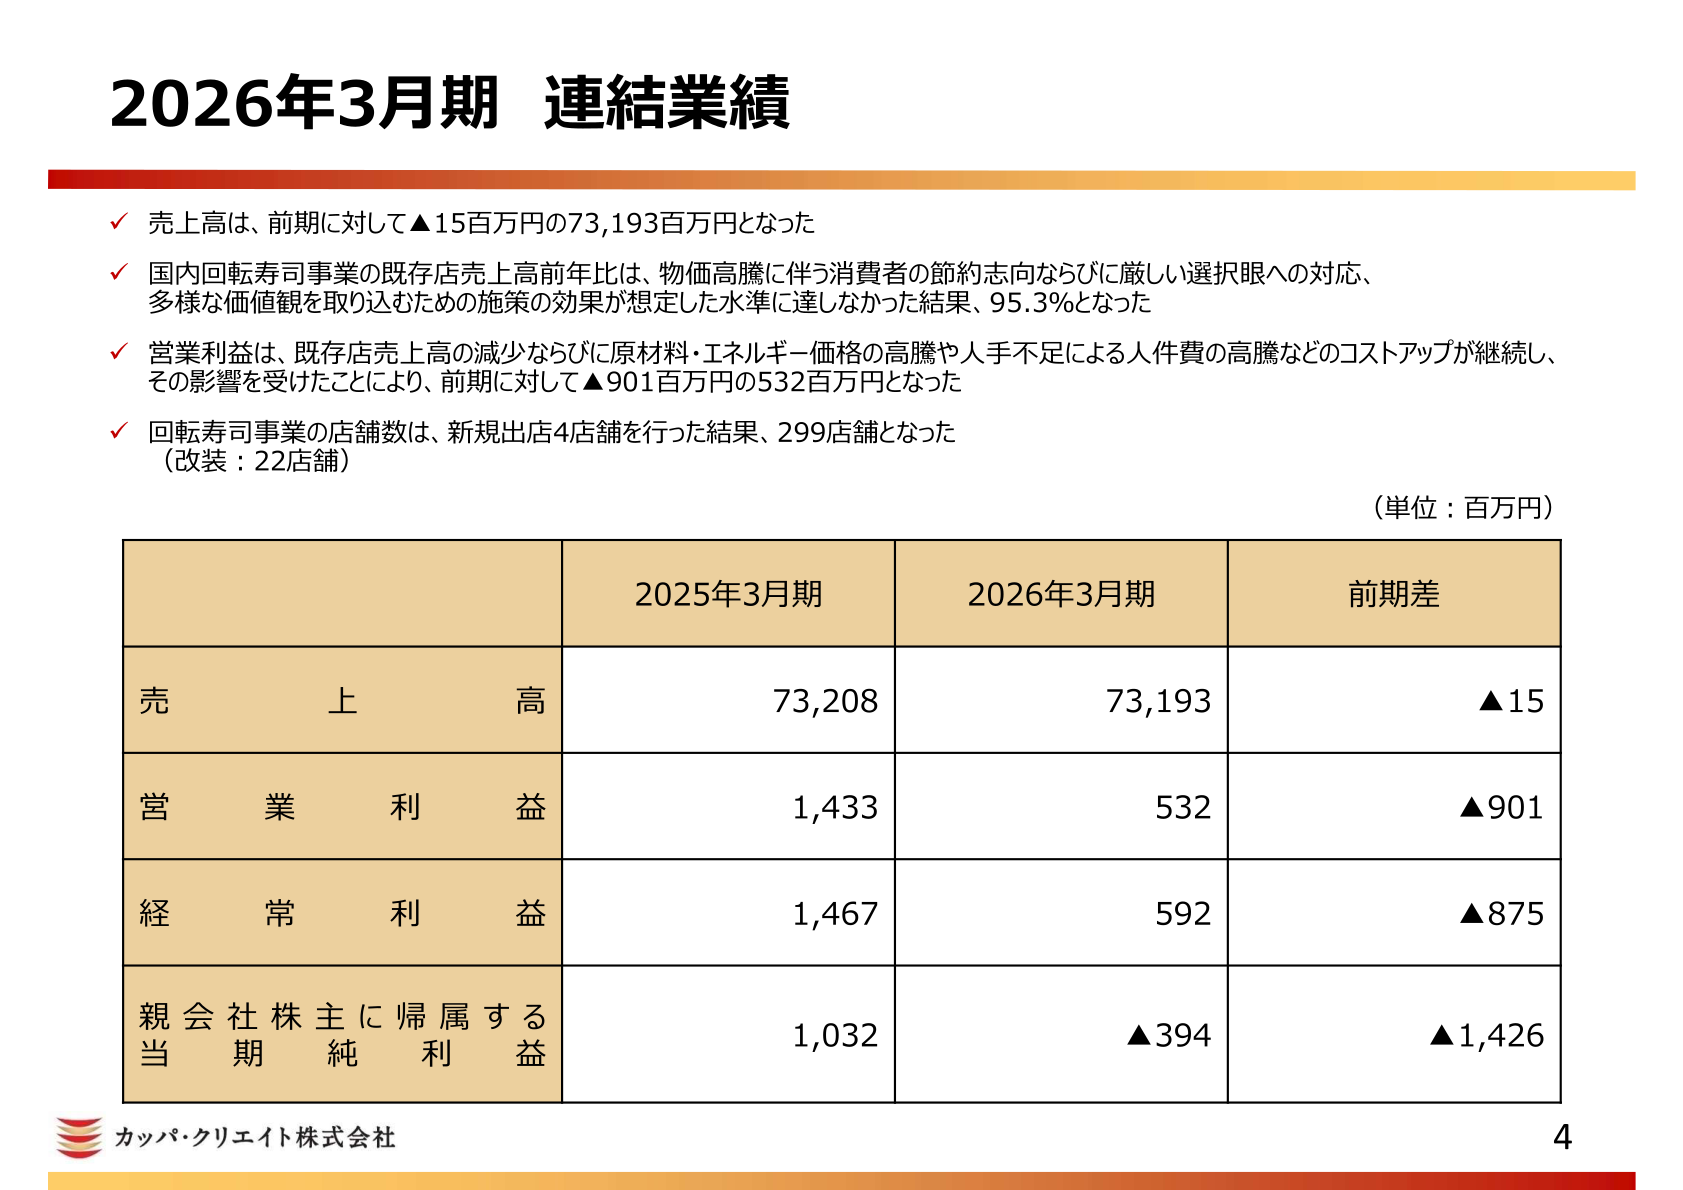
The first half progressed favorably as the profit and loss structure built in the previous fiscal year was maintained. In the third quarter, however, a decline in customer numbers due to inflation fatigue became apparent, and the gross profit margin fell as a result of sales promotions centered on price appeal. Price appeal was continued in the fourth quarter as well: customer numbers turned toward recovery and the gross profit margin moved onto a recovery track thanks to reduced losses accompanying higher base sales. While efforts to optimize costs were strengthened, the surge in gasoline prices from mid-March held back customer traffic mainly at roadside stores, and the company was unable to absorb costs.
| Item | Q1 | Q2 | Q3 | Q4 |
|---|---|---|---|---|
| Revenue (million yen) | 18,189 | 18,859 | 17,964 | 18,179 |
| Operating profit (million yen) | 322 | 510 | ▲390 | 90 |
| Ordinary profit (million yen) | 363 | 476 | ▲346 | 98 |
| Profit attributable to owners of parent (million yen) | 331 | 407 | ▲377 | ▲754 |
Results by Business (Domestic Conveyor-Belt Sushi, Delica, and Overseas)
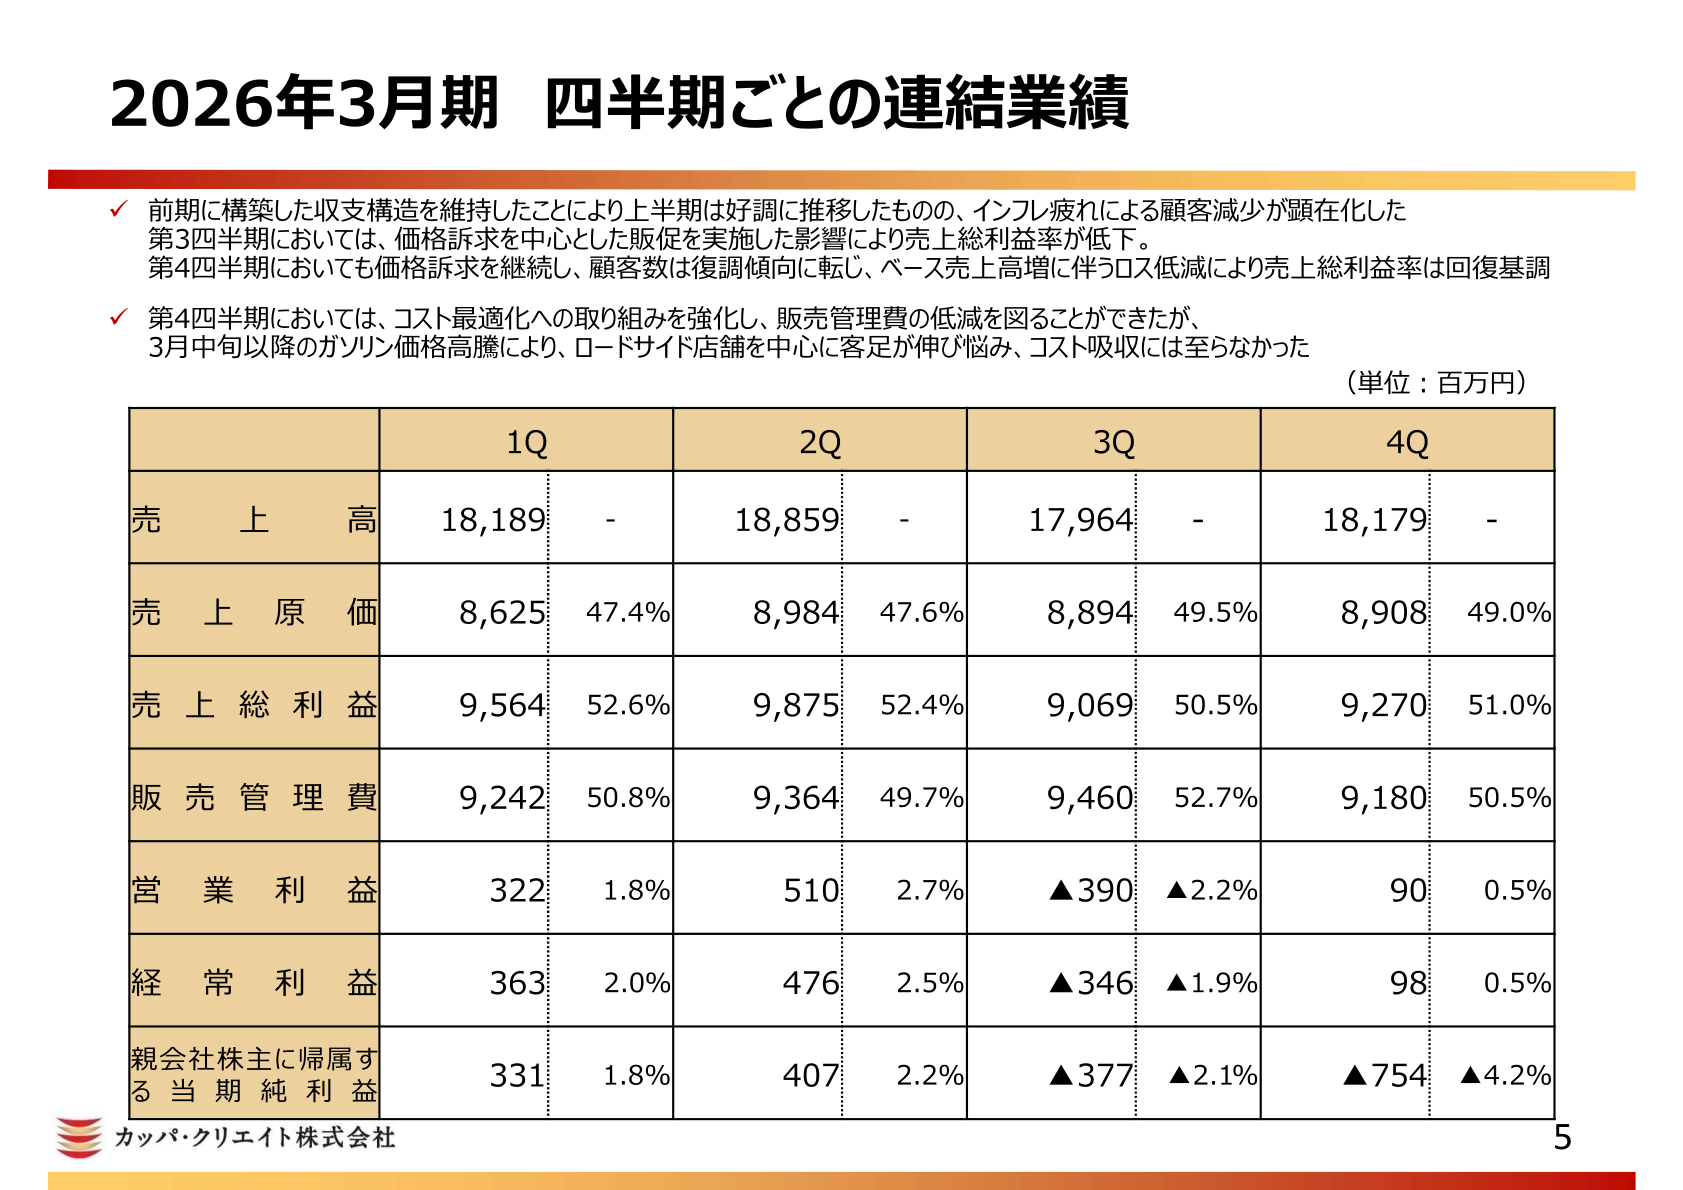
In the domestic conveyor-belt sushi business, effects of 1,840 million yen from productivity improvements, menu mix and other measures were applied against cost increases of 1,851 million yen arising from higher personnel expenses and soaring raw material prices, but this was not enough to offset the impact of lower same-store sales (▲827 million yen), and operating profit was 639 million yen, down ▲839 million yen year on year. Year-on-year net sales in the related businesses (overseas and delica) were 102.5% for the delica business, 82.1% for the Korean conveyor-belt sushi business, and 136.8% for the Indonesian conveyor-belt sushi business.
| Category | Metric | Current fiscal year | Previous fiscal year |
|---|---|---|---|
| Domestic conveyor-belt sushi business | Operating profit | 639 million yen | 1,478 million yen |
| Domestic conveyor-belt sushi business | Same-store sales, year on year | 95.3% | Not disclosed |
| Delica business | Net sales, year on year | 102.5% | Not disclosed |
| Korean conveyor-belt sushi business | Net sales, year on year | 82.1% | Not disclosed |
| Indonesian conveyor-belt sushi business | Net sales, year on year | 136.8% | Not disclosed |
Capital Efficiency and Financial Soundness
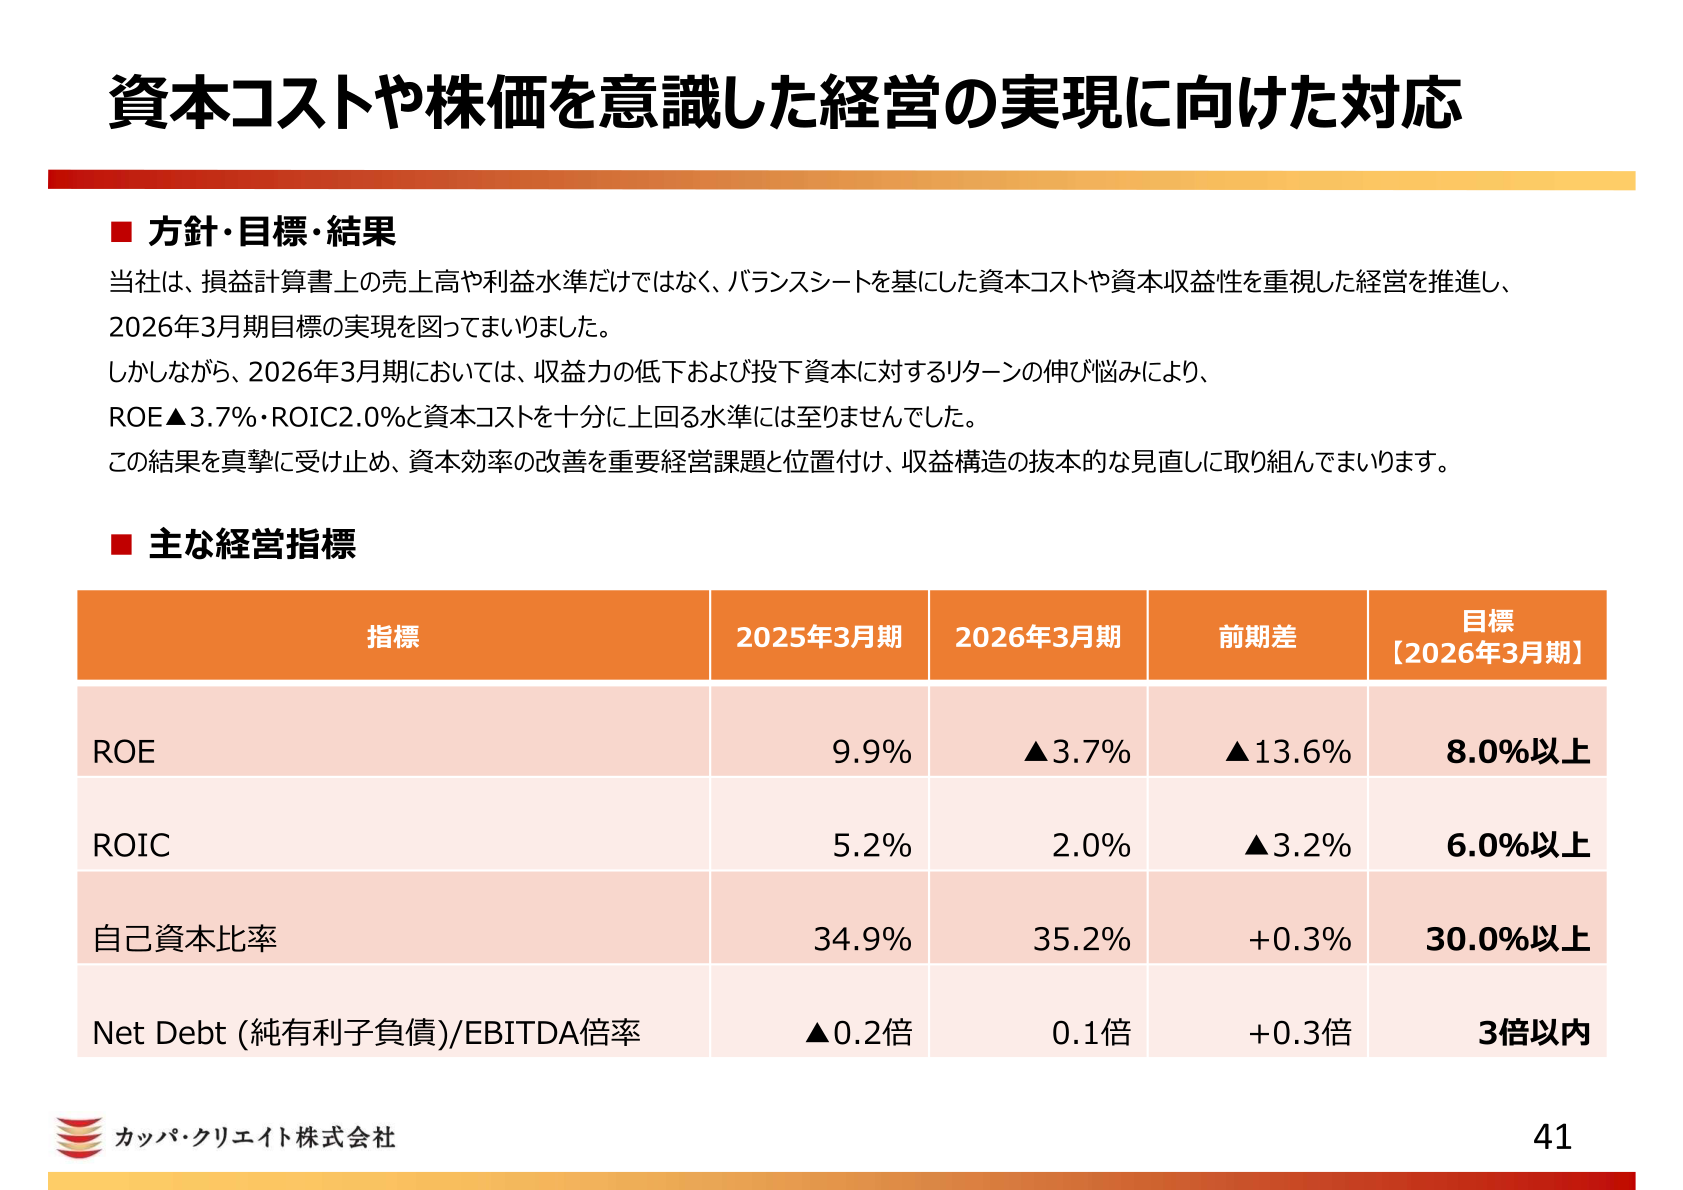
The company promotes management that emphasizes not only the level of revenue and profit in the income statement but also the cost of capital and return on capital based on the balance sheet. In FY3/2026, however, because of weaker earnings power and sluggish returns on invested capital, ROE of ▲3.7% and ROIC of 2.0% did not reach levels sufficiently above the cost of capital. The equity ratio was 35.2% (up +0.3% year on year), and the Net Debt (net interest-bearing debt) / EBITDA ratio was 0.1x (up +0.3x year on year). Taking these results seriously, the company positions improvement of capital efficiency as an important management issue and states that it will work on a fundamental review of its earnings structure.
| Metric | FY3/2026 | FY3/2025 | Change vs. previous year | FY3/2027 target |
|---|---|---|---|---|
| ROE | ▲3.7% | 9.9% | ▲13.6% | 8.0% or more |
| ROIC | 2.0% | 5.2% | ▲3.2% | 6.0% or more |
| Equity ratio | 35.2% | 34.9% | +0.3% | 30.0% or more |
| Net Debt/EBITDA ratio | 0.1x | ▲0.2x | +0.3x | Within 3x |
Key Policies for FY3/2027
As its measures and activity policies for FY3/2027, the company set out (1) improving the competitiveness of existing stores, (2) optimizing the store portfolio, (3) sustainability, and (4) expanding related businesses (the delica business and overseas business). For new stores, it indicated a policy of accelerating openings along three axes — station fronts and busy commercial districts, large commercial facilities, and new trade areas — and plans to open the Hisayaodori store in Sakae, Nagoya City, Aichi Prefecture in June 2026. In the overseas business, in March 2026 it opened the Summarecon Mall Bekasi store, its sixth store in Indonesia, and it has also established Kappa Create Vietnam as its third overseas country, with the first store scheduled to open in the first half of FY3/2027.
This article is an analysis based on publicly available information and is not a recommendation to buy or sell any specific securities. Investment decisions are your own responsibility.
















