
This article is based on publicly available IR materials and is not a recommendation to buy or sell any specific securities.
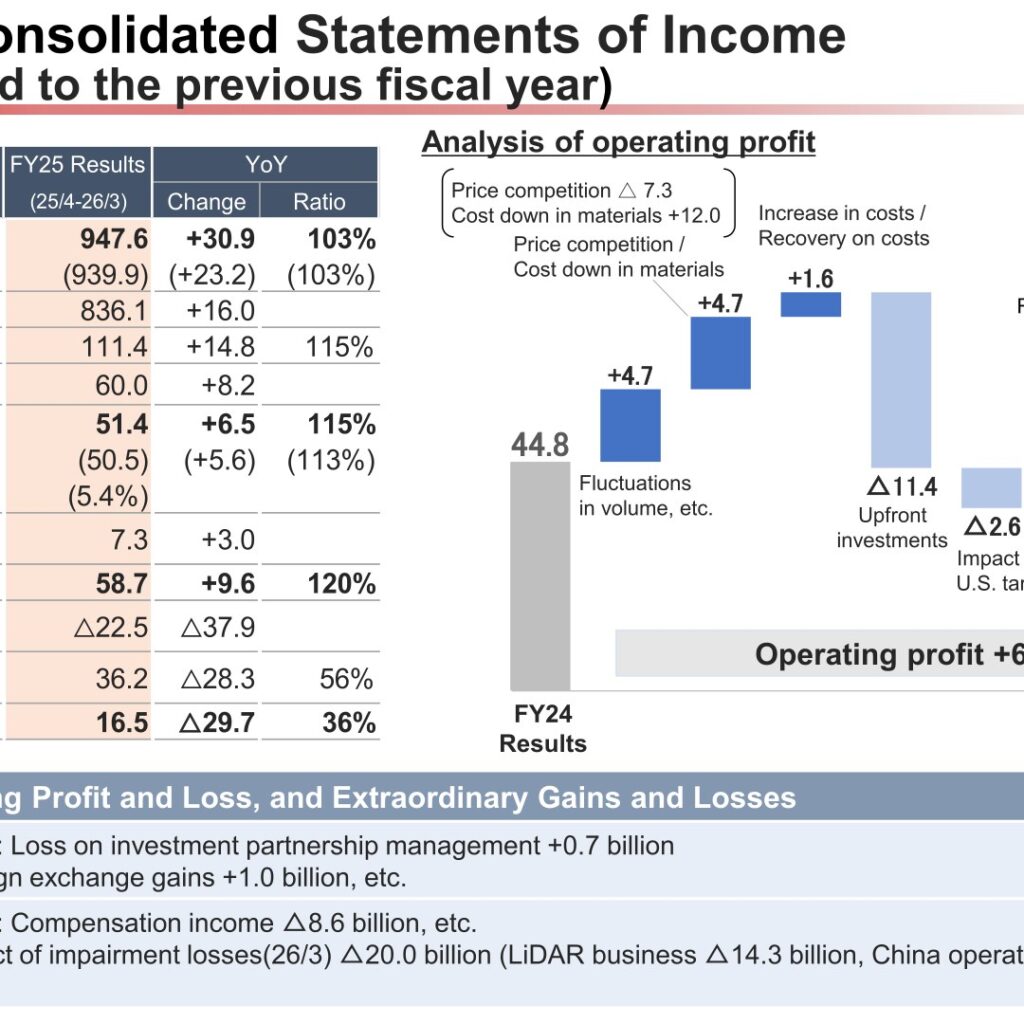
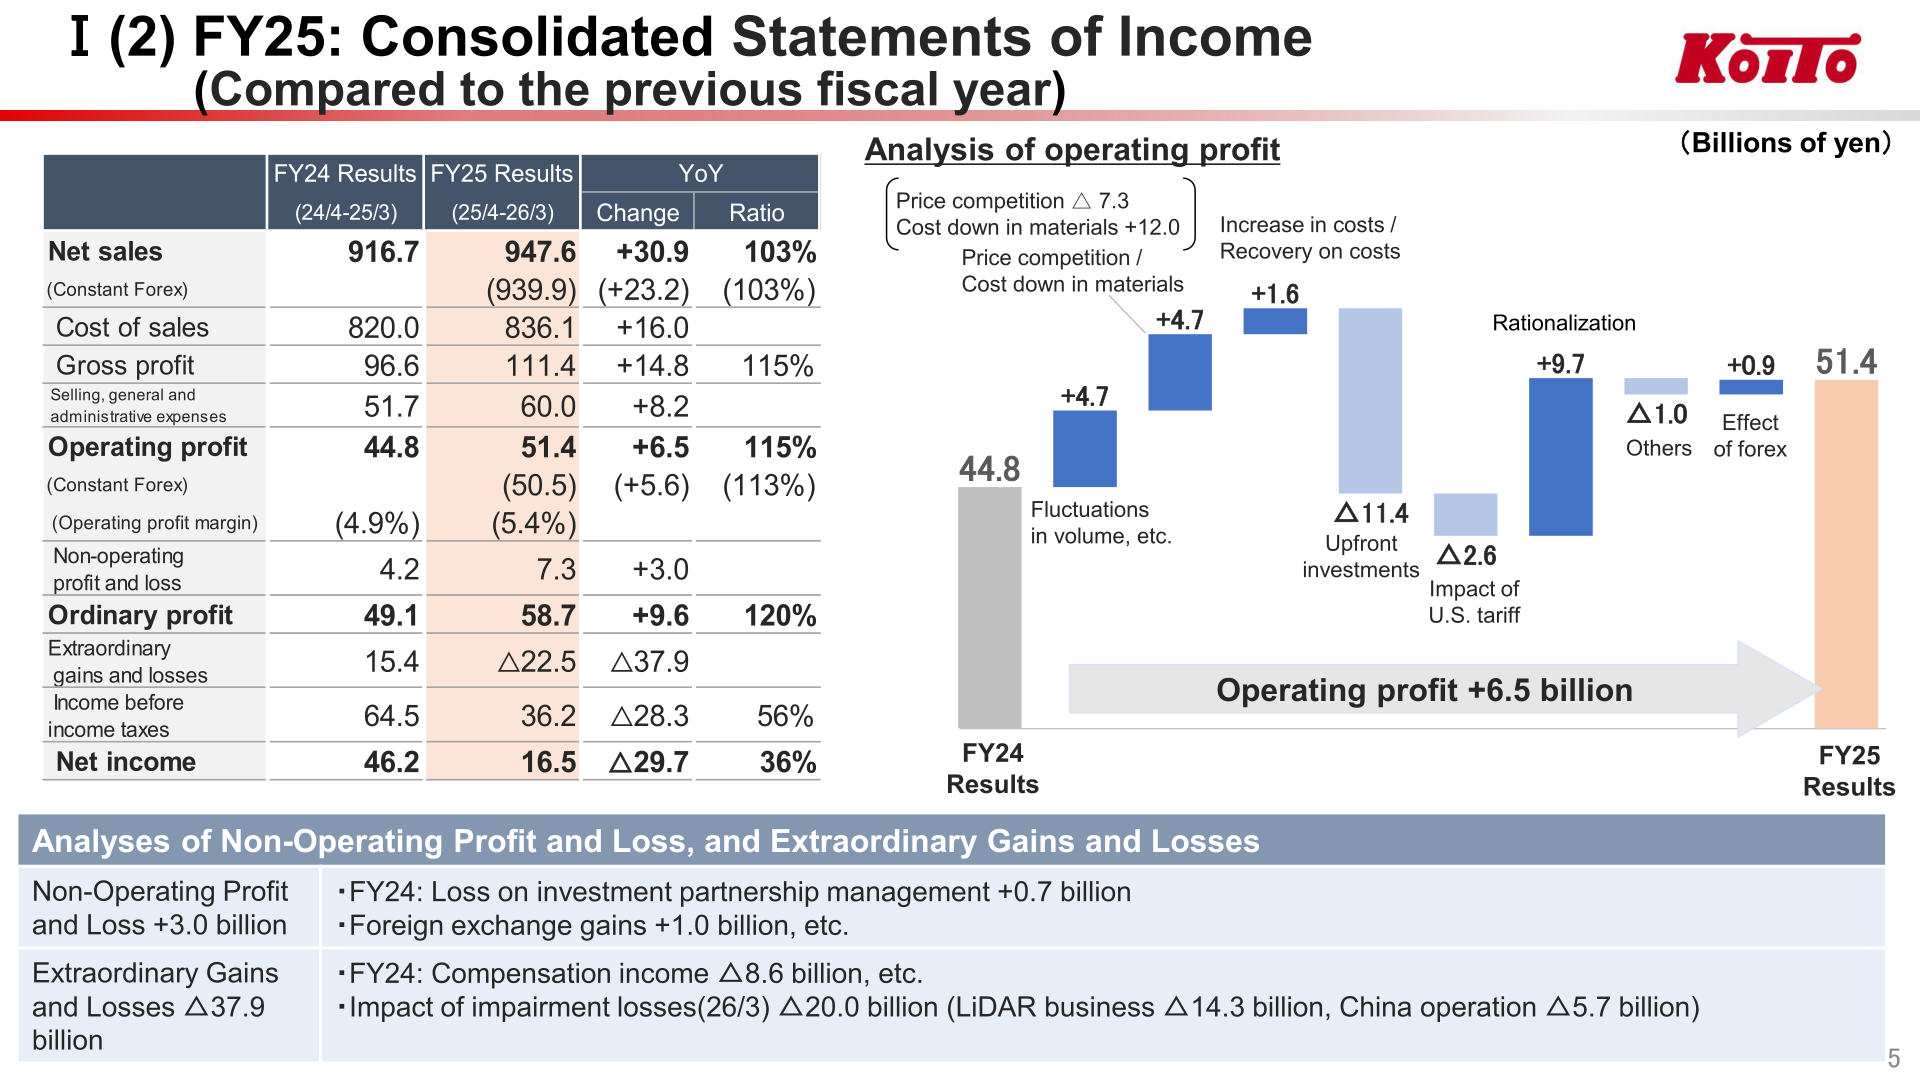
KOITO MANUFACTURING CO., LTD. reported FY2025 results (the fiscal year ended March 31, 2026) on May 13, 2026. Consolidated net sales rose to 947.6 billion yen, up 30.9 billion yen or 103% year on year, and operating profit rose to 51.4 billion yen, up 6.5 billion yen or 115%. Ordinary profit was 58.7 billion yen, up 9.6 billion yen or 120%. Net income, however, fell to 16.5 billion yen, down 29.7 billion yen or 36% year on year, because of impairment losses recognized in relation to the LiDAR business and the China operation.
Consolidated Results (Full-Year Actual)
The company attributes the increase in net sales to new orders received across global regions and to increased sales volumes of ordered vehicle models such as HEVs. Operating profit and ordinary profit increased year on year, driven by revenue growth and rationalization effects implemented mainly in the Americas and China. On a constant-forex basis, net sales were 939.9 billion yen (+23.2 billion yen, 103%) and operating profit was 50.5 billion yen (+5.6 billion yen, 113%). The operating profit margin improved from 4.9% to 5.4%.
| Item | FY25 Results (25/4-26/3) | FY24 Results (24/4-25/3) | Change | Ratio |
|---|---|---|---|---|
| Net sales | 947.6 | 916.7 | +30.9 | 103% |
| Net sales (Constant Forex) | (939.9) | – | (+23.2) | (103%) |
| Cost of sales | 836.1 | 820.0 | +16.0 | – |
| Gross profit | 111.4 | 96.6 | +14.8 | 115% |
| Selling, general and administrative expenses | 60.0 | 51.7 | +8.2 | – |
| Operating profit | 51.4 | 44.8 | +6.5 | 115% |
| Operating profit (Constant Forex) | (50.5) | – | (+5.6) | (113%) |
| Operating profit margin | (5.4%) | (4.9%) | – | – |
| Non-operating profit and loss | 7.3 | 4.2 | +3.0 | – |
| Ordinary profit | 58.7 | 49.1 | +9.6 | 120% |
| Extraordinary gains and losses | △22.5 | 15.4 | △37.9 | – |
| Income before income taxes | 36.2 | 64.5 | △28.3 | 56% |
| Net income | 16.5 | 46.2 | △29.7 | 36% |
Figures are in billions of yen. In the operating profit bridge from FY24 to FY25, the company shows fluctuations in volume, etc. of +4.7, price competition / cost down in materials of +4.7 (price competition △7.3 and cost down in materials +12.0), increase in costs / recovery on costs of +1.6, upfront investments of △11.4, impact of U.S. tariff of △2.6, rationalization of +9.7, others of △1.0 and effect of forex of +0.9, for a total increase of 6.5 billion yen. Non-operating profit and loss improved by 3.0 billion yen, including foreign exchange gains of +1.0 billion yen. Extraordinary gains and losses deteriorated by 37.9 billion yen, reflecting the impact of impairment losses at March 2026 of △20.0 billion yen (LiDAR business △14.3 billion yen, China operation △5.7 billion yen), against compensation income of △8.6 billion yen recorded in FY24. Assumed exchange rates moved from ¥152.6 to ¥151.1 per US dollar and from ¥21.1 to ¥21.3 per Chinese yuan, and global automobile production volume was 102% of the prior year.
Segment Results
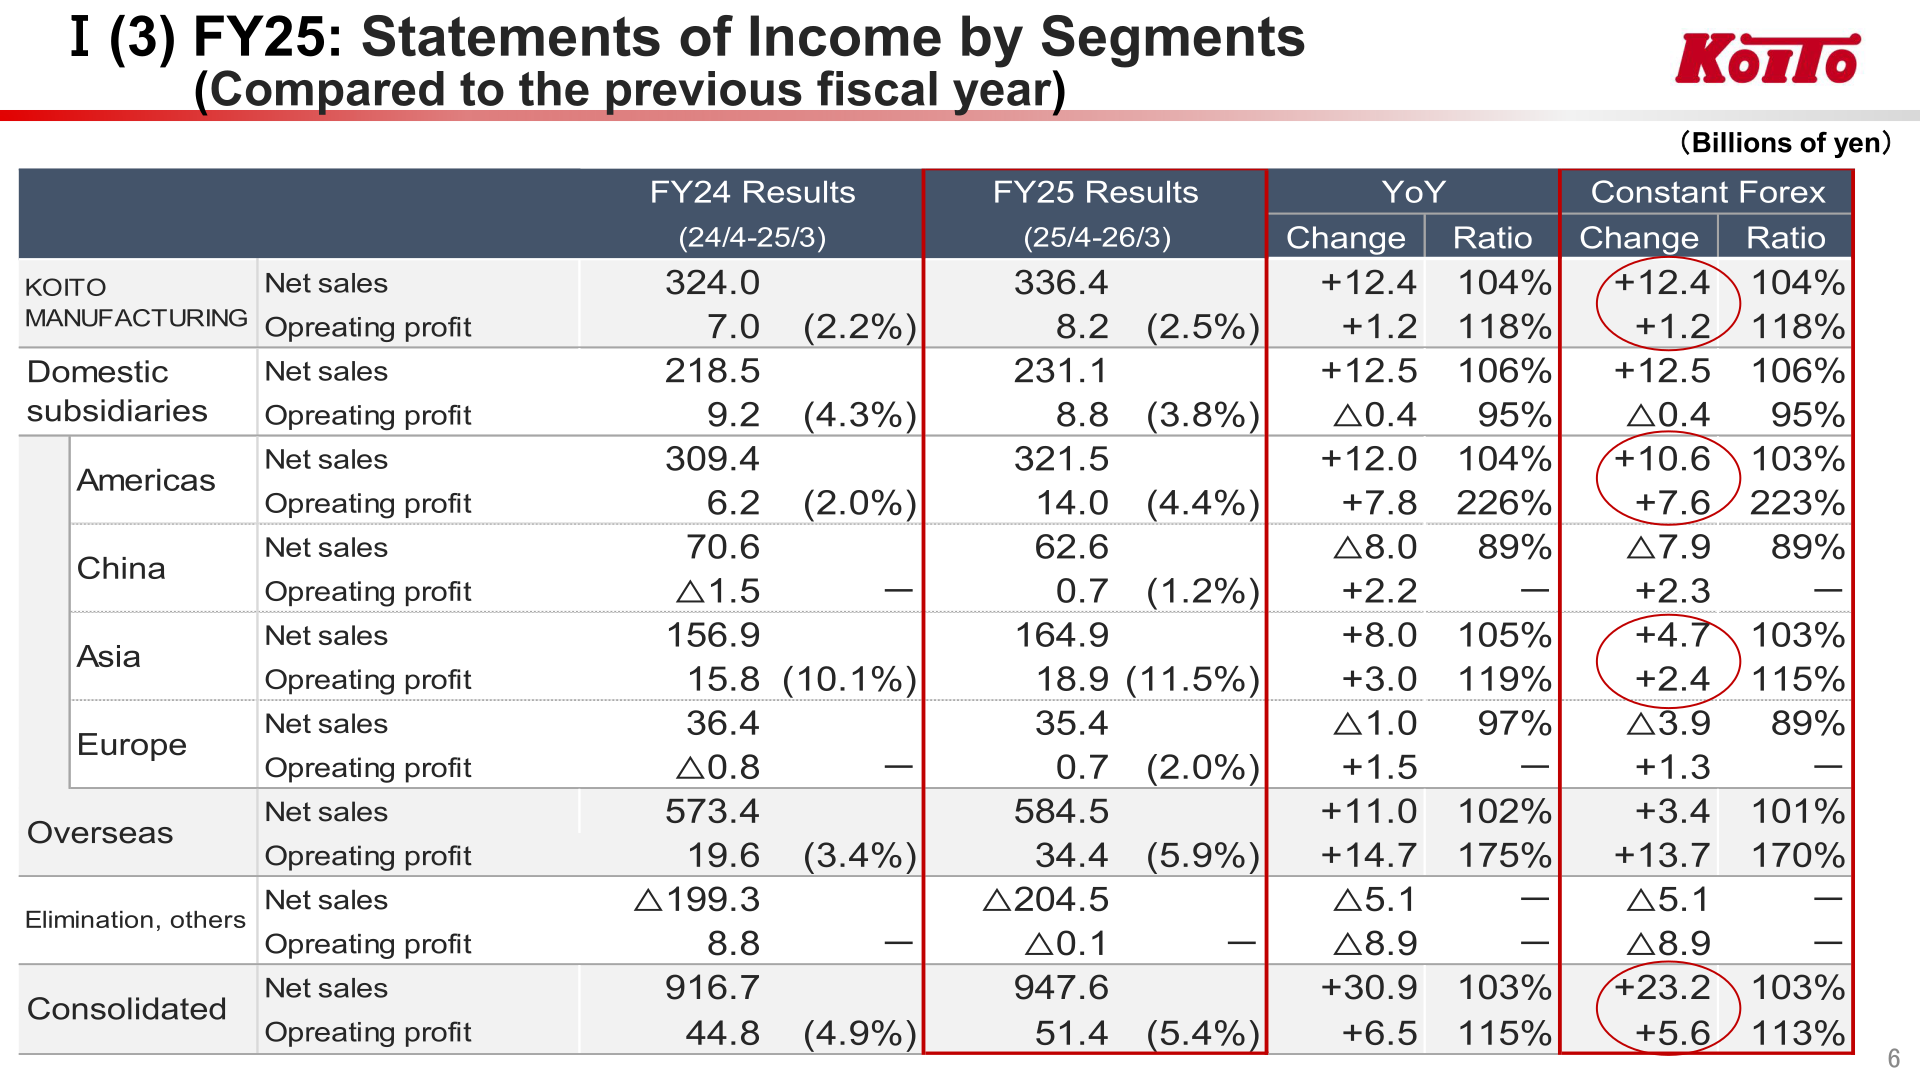
By region, the Americas was the largest driver of profit growth: net sales of 321.5 billion yen (+12.0, 104%) and operating profit of 14.0 billion yen (+7.8, 226%), lifting the margin from 2.0% to 4.4%. Asia posted net sales of 164.9 billion yen (+8.0, 105%) and operating profit of 18.9 billion yen (+3.0, 119%) at an 11.5% margin. China saw net sales decline to 62.6 billion yen (△8.0, 89%) but returned to an operating profit of 0.7 billion yen against a loss of △1.5 billion yen a year earlier, and Europe likewise moved to an operating profit of 0.7 billion yen from △0.8 billion yen. Overseas operations in aggregate delivered net sales of 584.5 billion yen (+11.0, 102%) and operating profit of 34.4 billion yen (+14.7, 175%).
| Segment | Metric | FY25 Results (25/4-26/3) | FY24 Results (24/4-25/3) | Change | Ratio |
|---|---|---|---|---|---|
| KOITO MANUFACTURING | Net sales | 336.4 | 324.0 | +12.4 | 104% |
| KOITO MANUFACTURING | Operating profit | 8.2 (2.5%) | 7.0 (2.2%) | +1.2 | 118% |
| Domestic subsidiaries | Net sales | 231.1 | 218.5 | +12.5 | 106% |
| Domestic subsidiaries | Operating profit | 8.8 (3.8%) | 9.2 (4.3%) | △0.4 | 95% |
| Americas | Net sales | 321.5 | 309.4 | +12.0 | 104% |
| Americas | Operating profit | 14.0 (4.4%) | 6.2 (2.0%) | +7.8 | 226% |
| China | Net sales | 62.6 | 70.6 | △8.0 | 89% |
| China | Operating profit | 0.7 (1.2%) | △1.5 | +2.2 | – |
| Asia | Net sales | 164.9 | 156.9 | +8.0 | 105% |
| Asia | Operating profit | 18.9 (11.5%) | 15.8 (10.1%) | +3.0 | 119% |
| Europe | Net sales | 35.4 | 36.4 | △1.0 | 97% |
| Europe | Operating profit | 0.7 (2.0%) | △0.8 | +1.5 | – |
| Overseas | Net sales | 584.5 | 573.4 | +11.0 | 102% |
| Overseas | Operating profit | 34.4 (5.9%) | 19.6 (3.4%) | +14.7 | 175% |
| Elimination, others | Net sales | △204.5 | △199.3 | △5.1 | – |
| Elimination, others | Operating profit | △0.1 | 8.8 | △8.9 | – |
| Consolidated | Net sales | 947.6 | 916.7 | +30.9 | 103% |
| Consolidated | Operating profit | 51.4 (5.4%) | 44.8 (4.9%) | +6.5 | 115% |
Within Japan, KOITO MANUFACTURING on a non-consolidated basis recorded net sales of 336.4 billion yen (+12.4, 104%) and operating profit of 8.2 billion yen (+1.2, 118%), with domestic automobile production volume at 99%. The Japanese subsidiaries subtotal of 231.1 billion yen comprises the KOITO Group companies at 180.6 billion yen (+8.9, 105%) and KOITO ELECTRIC and others at 50.4 billion yen (+3.6, 108%), the latter reflecting an increase in railway vehicle equipment and lighting equipment. Rationalization effects in FY25 totaled 9.7 billion yen on a consolidated basis: KOITO MANUFACTURING 2.7, Americas 3.2, China 2.7, Asia 0.4 and Europe 0.7 billion yen.
FY2026 Forecast
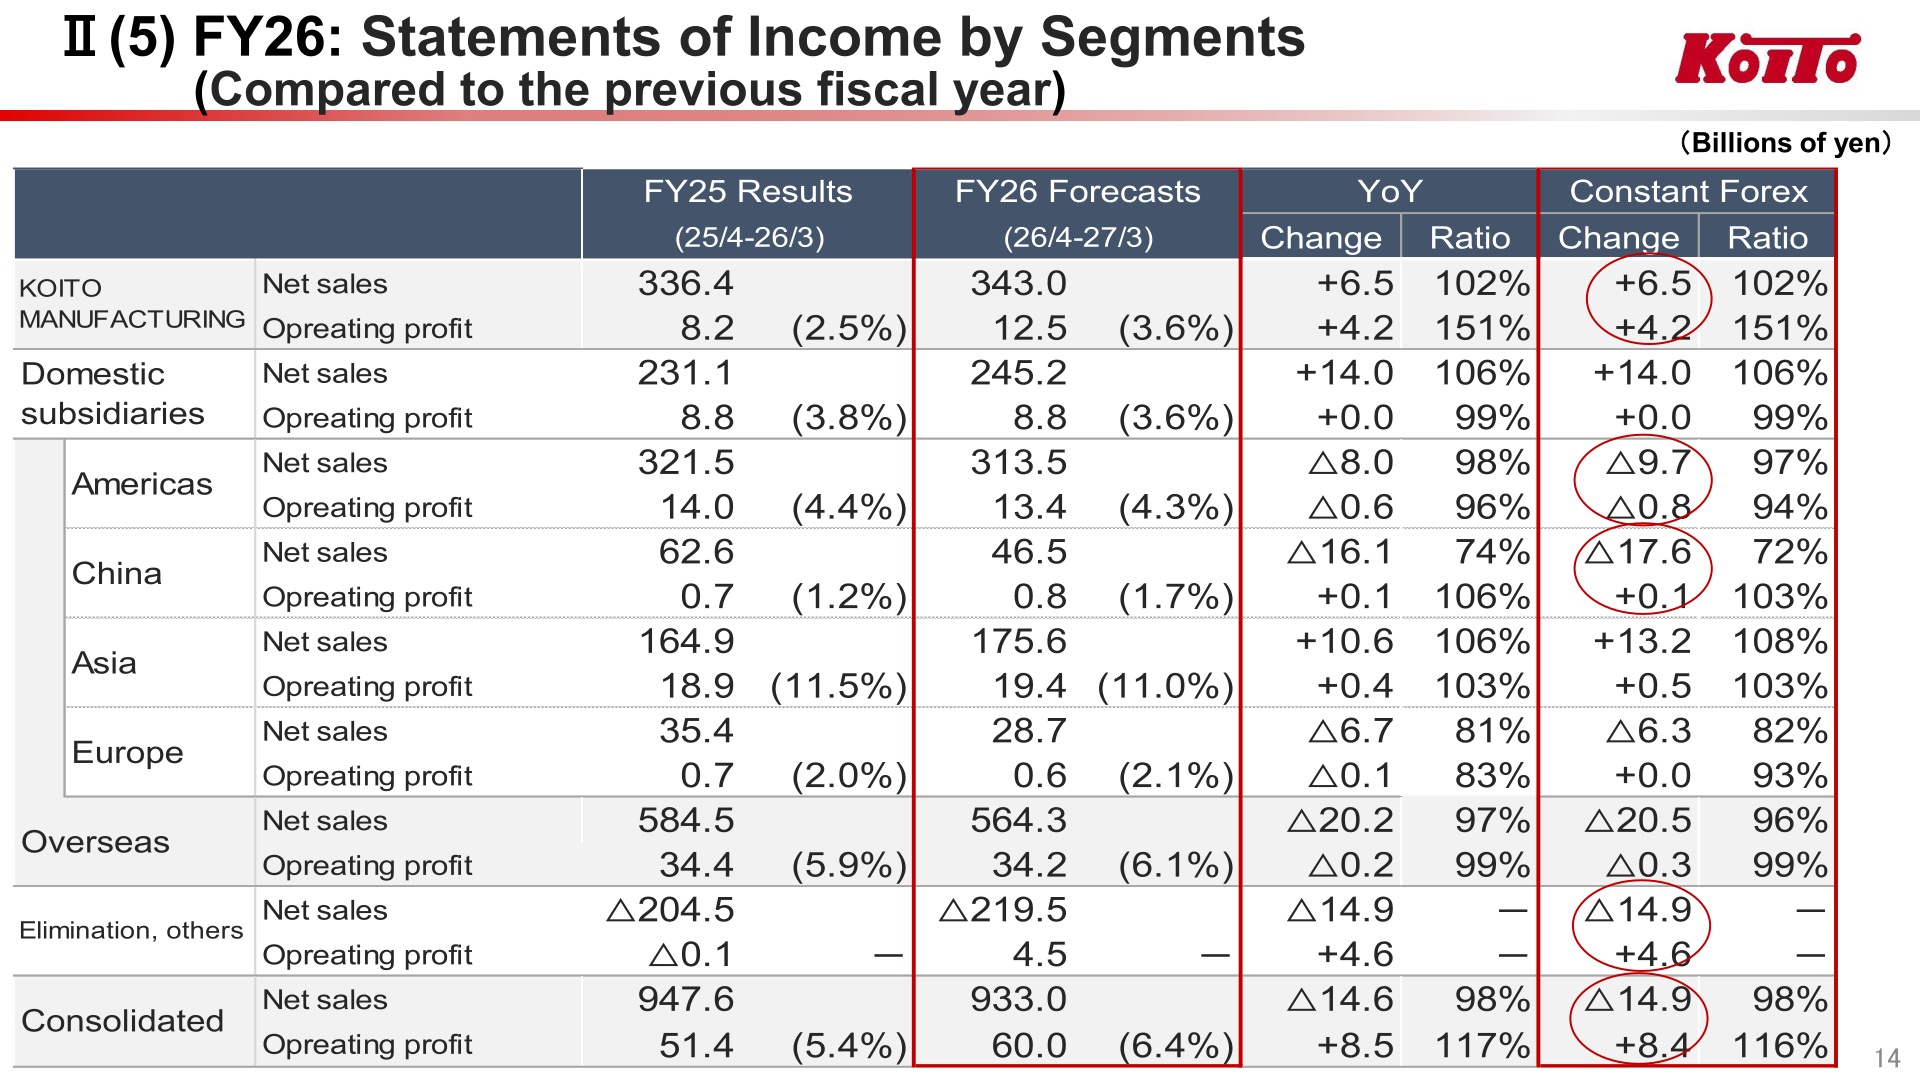
For FY2026 (the year ending March 31, 2027), the company forecasts consolidated net sales of 933.0 billion yen, down 14.6 billion yen or 98% year on year, because of reduced production volumes at major customers in the Americas and China. Operating profit is expected to rise to 60.0 billion yen, up 8.5 billion yen or 117%, supported by rationalization effects in each region and a reduction in LiDAR-related expenses; the operating profit margin is planned to be 6.4%, against the 6.0% target announced in October 2025. Ordinary profit is forecast at 65.5 billion yen (+6.7, 111%) and net income at 39.5 billion yen (+22.9, 239%).
| Item | FY26 Forecasts (26/4-27/3) | FY25 Results (25/4-26/3) | Change | Ratio |
|---|---|---|---|---|
| Net sales | 933.0 | 947.6 | △14.6 | 98% |
| Net sales (Constant Forex) | (932.6) | – | (△14.9) | (98%) |
| Cost of sales | 817.2 | 836.1 | △18.9 | – |
| Gross profit | 115.8 | 111.4 | +4.3 | 104% |
| Selling, general and administrative expenses | 55.8 | 60.0 | △4.2 | – |
| Operating profit | 60.0 | 51.4 | +8.5 | 117% |
| Operating profit (Constant Forex) | (59.8) | – | (+8.4) | (116%) |
| Operating profit margin | (6.4%) | (5.4%) | – | – |
| Non-operating profit and loss | 5.5 | 7.3 | △1.8 | – |
| Ordinary profit | 65.5 | 58.7 | +6.7 | 111% |
| Extraordinary gains and losses | △0.7 | △22.5 | +21.8 | – |
| Income before income taxes | 64.8 | 36.2 | +28.5 | 179% |
| Net income | 39.5 | 16.5 | +22.9 | 239% |
The forecast assumes an exchange rate of ¥150 per US dollar, against the ¥151 per US dollar recorded in FY25, and ¥22.0 per Chinese yuan against ¥21.3. The impact of the U.S. tariff is assumed at ±0.0 billion yen (payments △6.5 billion yen, recoveries +6.5 billion yen), an improvement of 2.6 billion yen versus FY25. Rationalization effects are assumed at +9.6 billion yen versus +9.7 billion yen in FY25, and LiDAR-related business expenses at △4.2 billion yen versus △9.6 billion yen, an improvement of 5.4 billion yen. The company also factors in △2.5 billion yen from the situation in the Middle East (reduction in vehicle production for the Middle East market △1.5 billion yen; impact of raw material costs △1.0 billion yen). Global automobile production volume is assumed at 89.30 million vehicles, or 99% of the FY25 level of 90.19 million vehicles.
| Segment | Metric | FY26 Forecasts (26/4-27/3) | FY25 Results (25/4-26/3) | Change | Ratio |
|---|---|---|---|---|---|
| KOITO MANUFACTURING | Net sales | 343.0 | 336.4 | +6.5 | 102% |
| KOITO MANUFACTURING | Operating profit | 12.5 (3.6%) | 8.2 (2.5%) | +4.2 | 151% |
| Domestic subsidiaries | Net sales | 245.2 | 231.1 | +14.0 | 106% |
| Domestic subsidiaries | Operating profit | 8.8 (3.6%) | 8.8 (3.8%) | +0.0 | 99% |
| Americas | Net sales | 313.5 | 321.5 | △8.0 | 98% |
| Americas | Operating profit | 13.4 (4.3%) | 14.0 (4.4%) | △0.6 | 96% |
| China | Net sales | 46.5 | 62.6 | △16.1 | 74% |
| China | Operating profit | 0.8 (1.7%) | 0.7 (1.2%) | +0.1 | 106% |
| Asia | Net sales | 175.6 | 164.9 | +10.6 | 106% |
| Asia | Operating profit | 19.4 (11.0%) | 18.9 (11.5%) | +0.4 | 103% |
| Europe | Net sales | 28.7 | 35.4 | △6.7 | 81% |
| Europe | Operating profit | 0.6 (2.1%) | 0.7 (2.0%) | △0.1 | 83% |
| Overseas | Net sales | 564.3 | 584.5 | △20.2 | 97% |
| Overseas | Operating profit | 34.2 (6.1%) | 34.4 (5.9%) | △0.2 | 99% |
| Elimination, others | Net sales | △219.5 | △204.5 | △14.9 | – |
| Elimination, others | Operating profit | 4.5 | △0.1 | +4.6 | – |
| Consolidated | Net sales | 933.0 | 947.6 | △14.6 | 98% |
| Consolidated | Operating profit | 60.0 (6.4%) | 51.4 (5.4%) | +8.5 | 117% |
Shareholder Returns
The presentation does not include a dividend, share buyback or shareholder return policy. This cannot be confirmed from the materials.
LiDAR Business Policy and Medium-Term Plan
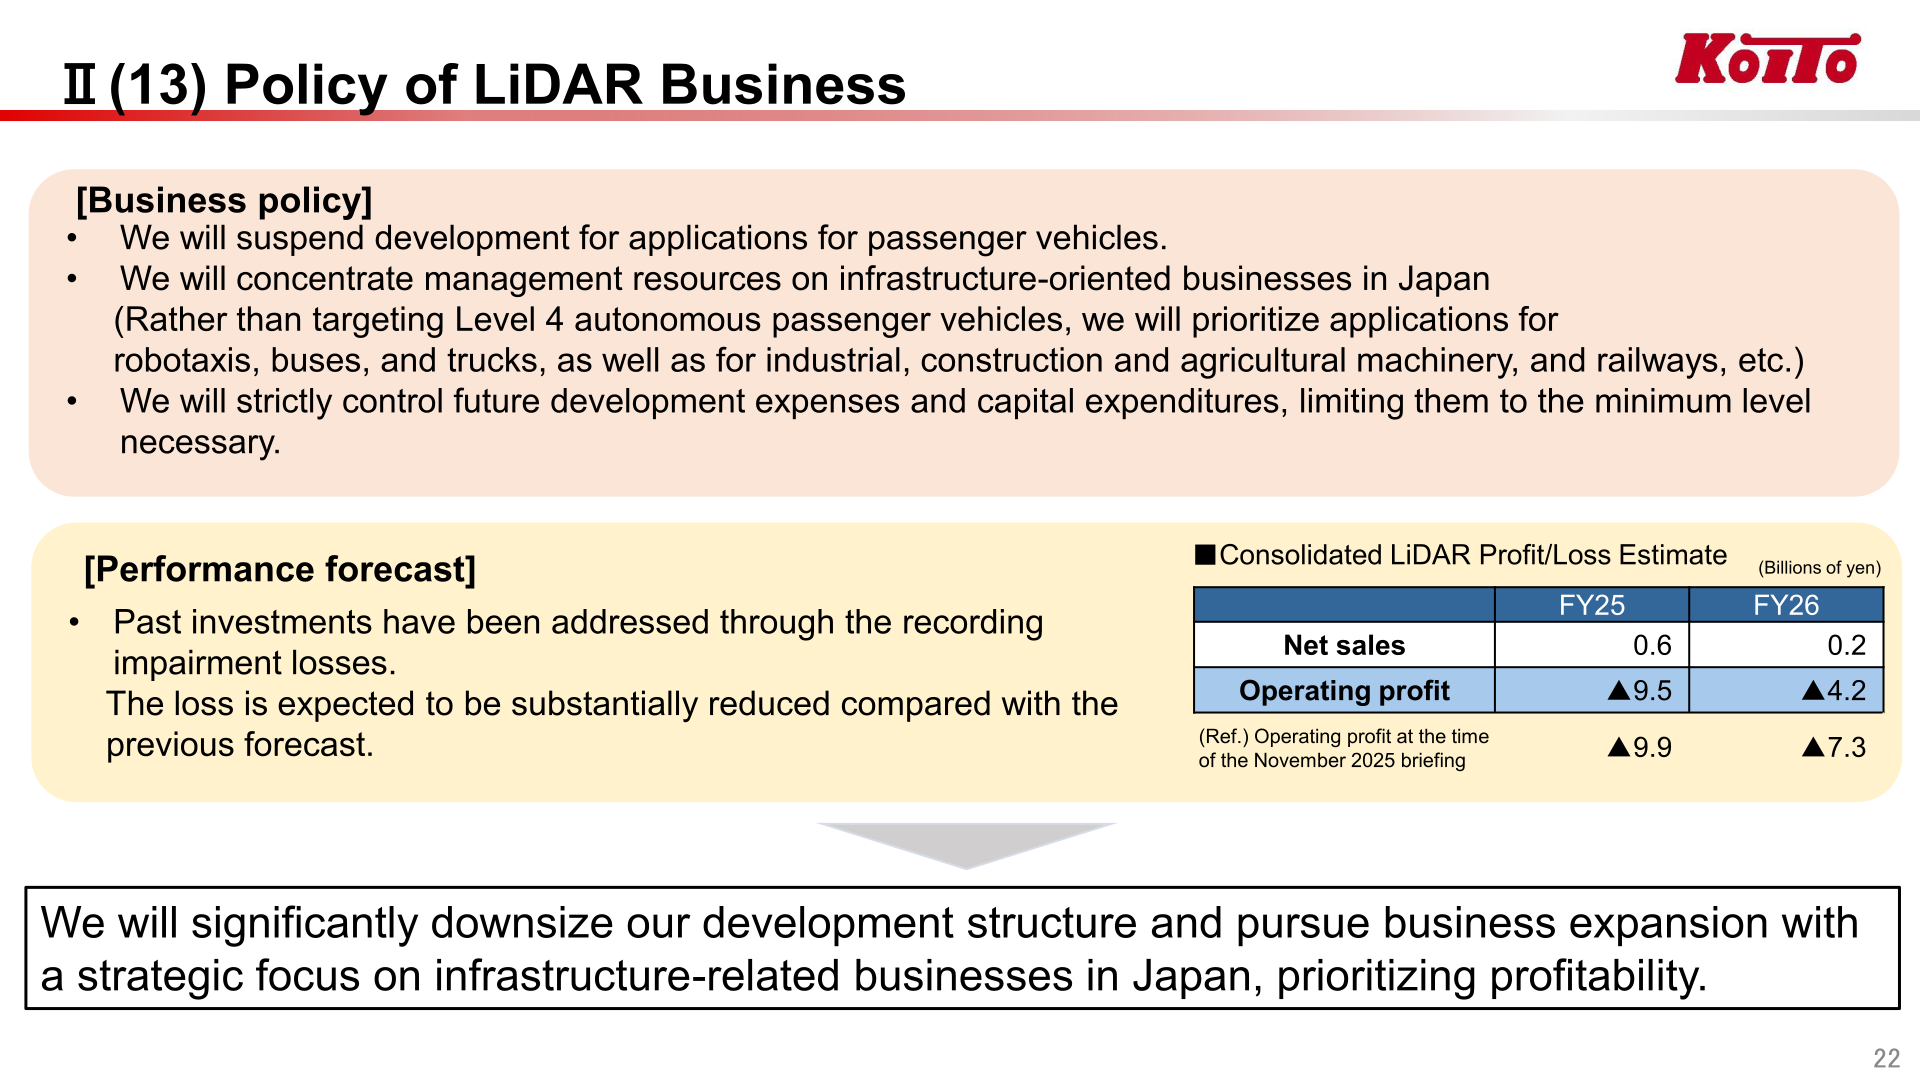
The company set out a revised policy for its LiDAR business. It will suspend development for applications for passenger vehicles and concentrate management resources on infrastructure-oriented businesses in Japan; rather than targeting Level 4 autonomous passenger vehicles, it will prioritize applications for robotaxis, buses and trucks, as well as for industrial, construction and agricultural machinery and railways. Future development expenses and capital expenditures will be strictly controlled and limited to the minimum level necessary. Past investments have been addressed through the recording of impairment losses, and the loss is expected to be substantially reduced compared with the previous forecast. The consolidated LiDAR profit/loss estimate shows net sales of 0.6 billion yen and an operating loss of ▲9.5 billion yen for FY25, and net sales of 0.2 billion yen with an operating loss of ▲4.2 billion yen for FY26, against reference operating profit figures at the time of the November 2025 briefing of ▲9.9 billion yen and ▲7.3 billion yen respectively.
FY26 marks the end of the first Medium-Term Management Plan. Compared with the October 2025 announcement of 930.0 billion yen in consolidated net sales and 56.0 billion yen in consolidated operating profit at a 6.0% margin, the current FY26 forecast is 933.0 billion yen in net sales and 60.0 billion yen in operating profit at a 6.4% margin. The company attributes the 4.0 billion yen difference in operating profit to cost reduction due to LiDAR business restructuring of +3.1, a period shift resulting from the delayed recovery of tariff impact amounts of +1.5, further rationalization and other items of +1.9, and the impact of the situation in the Middle East of △2.5.
This article is an analysis based on publicly available information and is not a recommendation to buy or sell any specific securities. Investment decisions are your own responsibility.
![[Obayashi] Investors’ Guide 2026 — The Complete 24-Article Breakdown](https://japan-equity.com/wp-content/uploads/2026/07/hub_cover-1024x1024.png)
![[Obayashi] IR & SR Policy — Feeding Dialogue Back into Management](https://japan-equity.com/wp-content/uploads/2026/07/p32_sq-1024x1024.jpg)
![[Obayashi] Real Estate Development — 18.7% Margin, ¥287.7bn Unrealized Gains](https://japan-equity.com/wp-content/uploads/2026/07/p20_sq-1024x1024.jpg)
![[Obayashi] Domestic Civil Engineering — Resilience Spending Supports 9.6% Margin](https://japan-equity.com/wp-content/uploads/2026/07/p11_sq-1024x1024.jpg)
![[Obayashi] Share Price & External Ratings — vs TOPIX, ESG Index Inclusion](https://japan-equity.com/wp-content/uploads/2026/07/p40_sq-1024x1024.jpg)
![[Construction] ¥75.5tn Investment, Shrinking Workforce — Big-5 Market Share](https://japan-equity.com/wp-content/uploads/2026/07/p12_sq-1024x1024.jpg)



![[Obayashi] Capital Policy & Shareholder Returns — ROE 10%+, DOE ~5%, ¥100bn Buyback](https://japan-equity.com/wp-content/uploads/2026/07/p27_sq-1024x1024.jpg)
![[Obayashi] Reducing Cross-Shareholdings — ¥285.2bn Sold in Five Years](https://japan-equity.com/wp-content/uploads/2026/07/p29_sq-1024x1024.jpg)
![[Obayashi] ¥750bn Investment Plan — ¥300bn to Development, ¥190bn to Tech/DX](https://japan-equity.com/wp-content/uploads/2026/07/p30_sq-1024x1024.jpg)
![[Obayashi] MTP2022 KPIs — Operating Profit ~2x Target, ROE 14.4%](https://japan-equity.com/wp-content/uploads/2026/07/p25_sq-1024x1024.jpg)
![[Obayashi] Cash Allocation — ¥420bn Investment CF Over Five Years](https://japan-equity.com/wp-content/uploads/2026/07/p26_sq-1024x1024.jpg)
![[Obayashi] Green Energy — 44 Plants, 344MW, and the Green Hydrogen Challenge](https://japan-equity.com/wp-content/uploads/2026/07/p21_sq-1024x1024.jpg)
![[Obayashi] Tackling the Labor Shortage — Robotics Construction®](https://japan-equity.com/wp-content/uploads/2026/07/p14_sq-1024x1024.jpg)
