
This article is based on publicly available IR materials and is not a recommendation to buy or sell any specific securities.
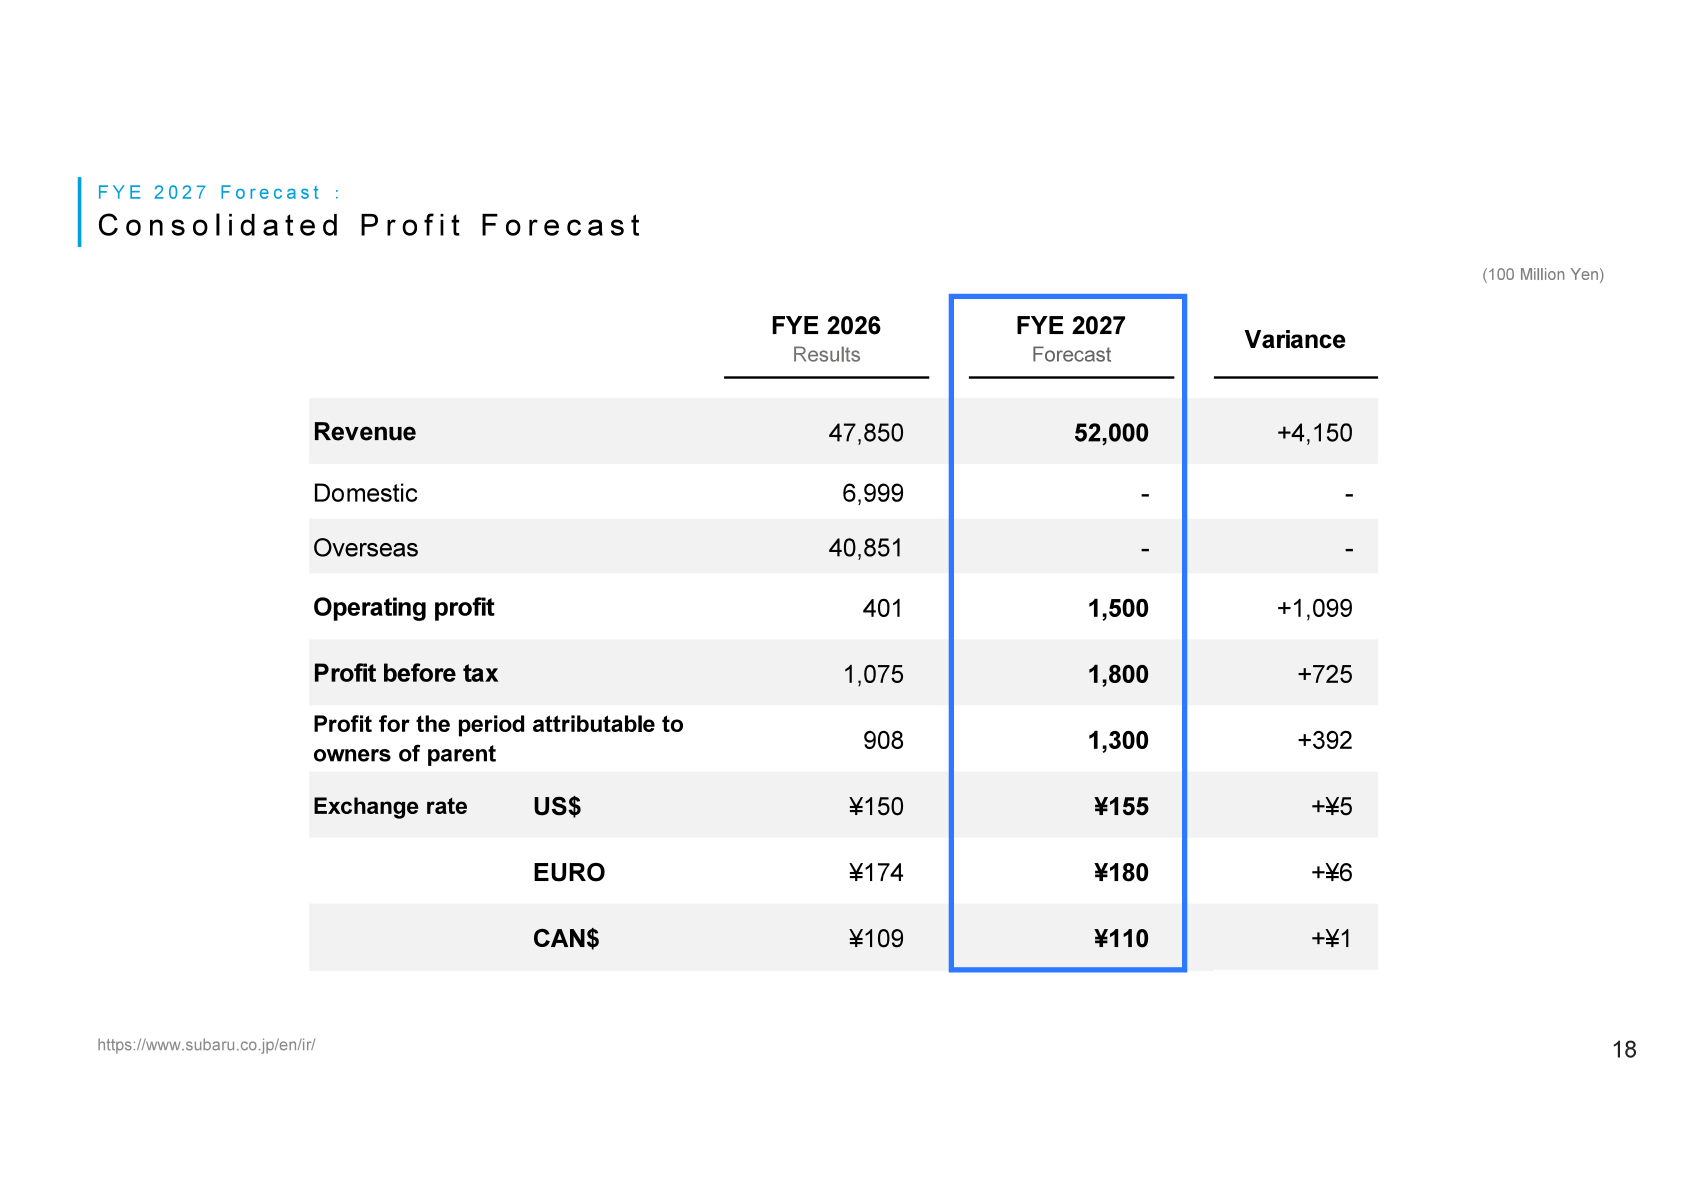
Note: SUBARU labels the fiscal year ended March 31, 2026 as ‘FYE 2026’ in its own materials; the tables and figures below follow the company’s labels. SUBARU CORPORATION posted revenue of 47,850 (100 million yen) for FYE 2026, an increase of 992 year on year, while operating profit fell 3,652 to 401. Profit for the period attributable to owners of parent was 908, down 2,472. The company describes a combined impact at the 300-billion-yen level from U.S. tariffs, foreign exchange effects, and higher raw material costs, and states that operating profit of 40.1 billion yen reflects the recognition of major expenses related to environmental regulatory credits and BEVs following significant changes in U.S. environmental regulations, with FYE 2026 as the peak year for those expenses. For FYE 2027, SUBARU forecasts revenue of 52,000 and operating profit of 1,500.
Consolidated Results (Full-Year Actual)
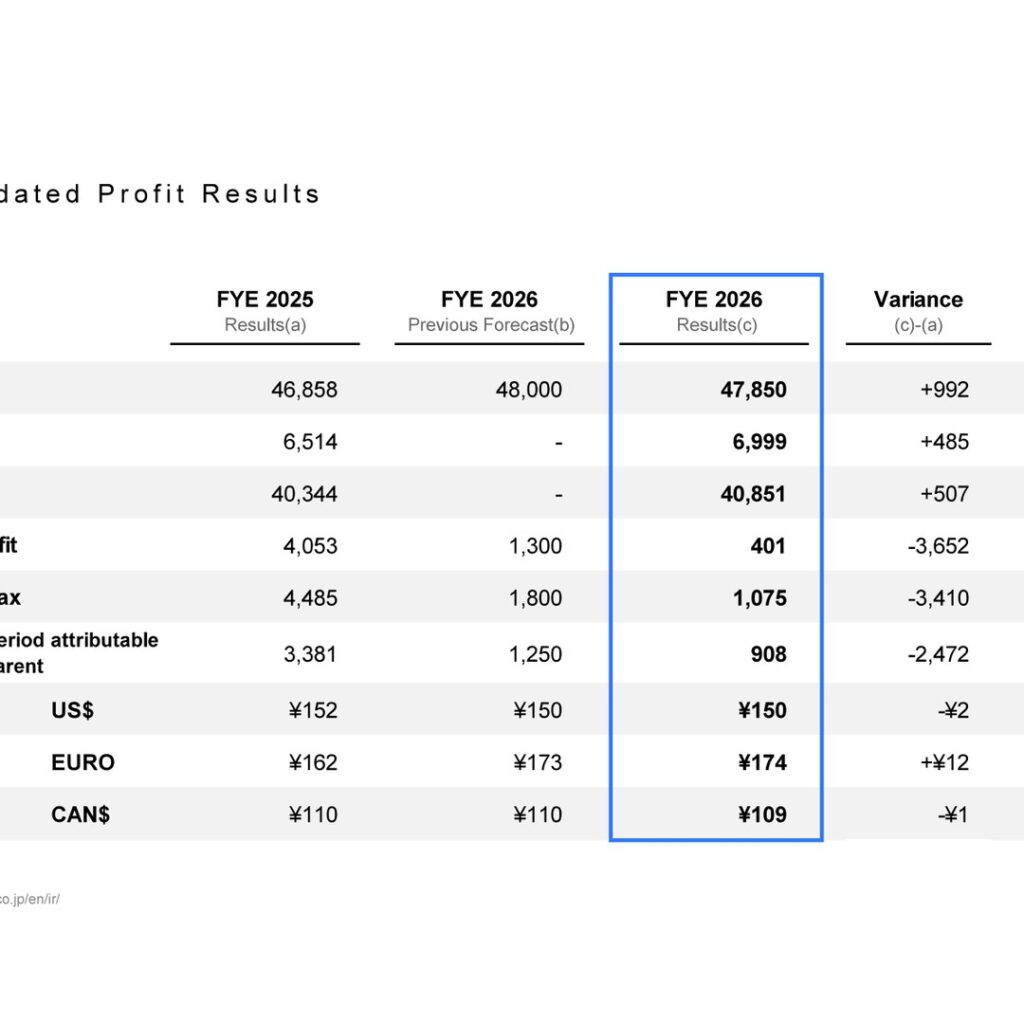
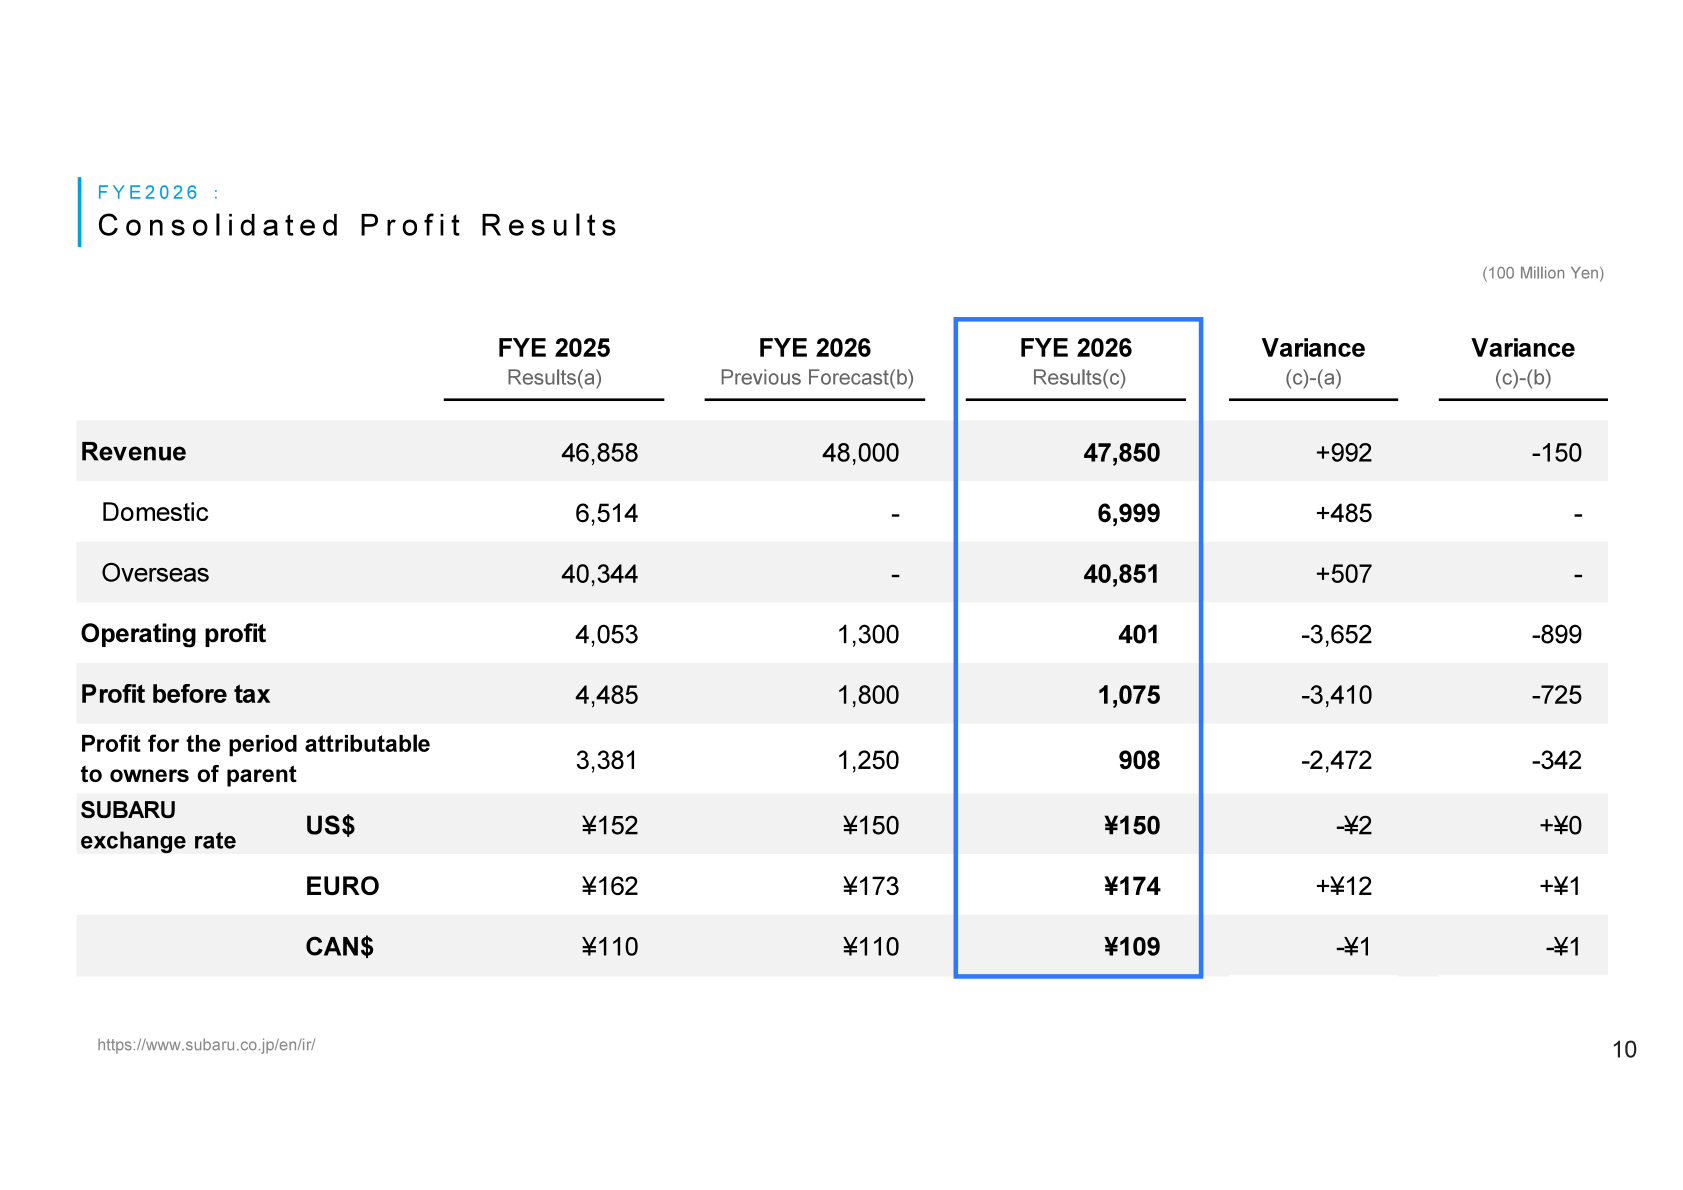
The following consolidated profit results are stated in 100 million yen, as presented in the materials. Revenue rose on both domestic and overseas contributions, but every profit line declined sharply from FYE 2025. Against the previous forecast announced on February 6th, 2026, revenue came in 150 lower and operating profit 899 lower.
| Item | FYE 2026 (Results) | FYE 2025 (Results) | Variance |
|---|---|---|---|
| Revenue | 47,850 | 46,858 | +992 |
| Revenue — Domestic | 6,999 | 6,514 | +485 |
| Revenue — Overseas | 40,851 | 40,344 | +507 |
| Operating profit | 401 | 4,053 | -3,652 |
| Profit before tax | 1,075 | 4,485 | -3,410 |
| Profit for the period attributable to owners of parent | 908 | 3,381 | -2,472 |
| SUBARU exchange rate — US$ | ¥150 | ¥152 | -¥2 |
| SUBARU exchange rate — EURO | ¥174 | ¥162 | +¥12 |
| SUBARU exchange rate — CAN$ | ¥109 | ¥110 | -¥1 |
On a volume basis, production and consolidated unit sales both declined. Production figures include Toyota GR86 and exclude jointly developed BEVs with Toyota Motor Corporation. Figures below are in thousand units.
| Item | FYE 2026 (Results) | FYE 2025 (Results) | Variance |
|---|---|---|---|
| Production in U.S. | 355 | 345 | +11 |
| Production in Japan | 525 | 602 | -77 |
| Production Total | 880 | 946 | -66 |
| Consolidated Unit Sales — Domestic total | 103 | 104 | -1 |
| Consolidated Unit Sales — North America total | 708 | 732 | -24 |
| Consolidated Unit Sales — Overseas total | 793 | 832 | -39 |
| Consolidated Unit Sales Total | 896 | 936 | -41 |
Factors Behind the Operating Profit Decline
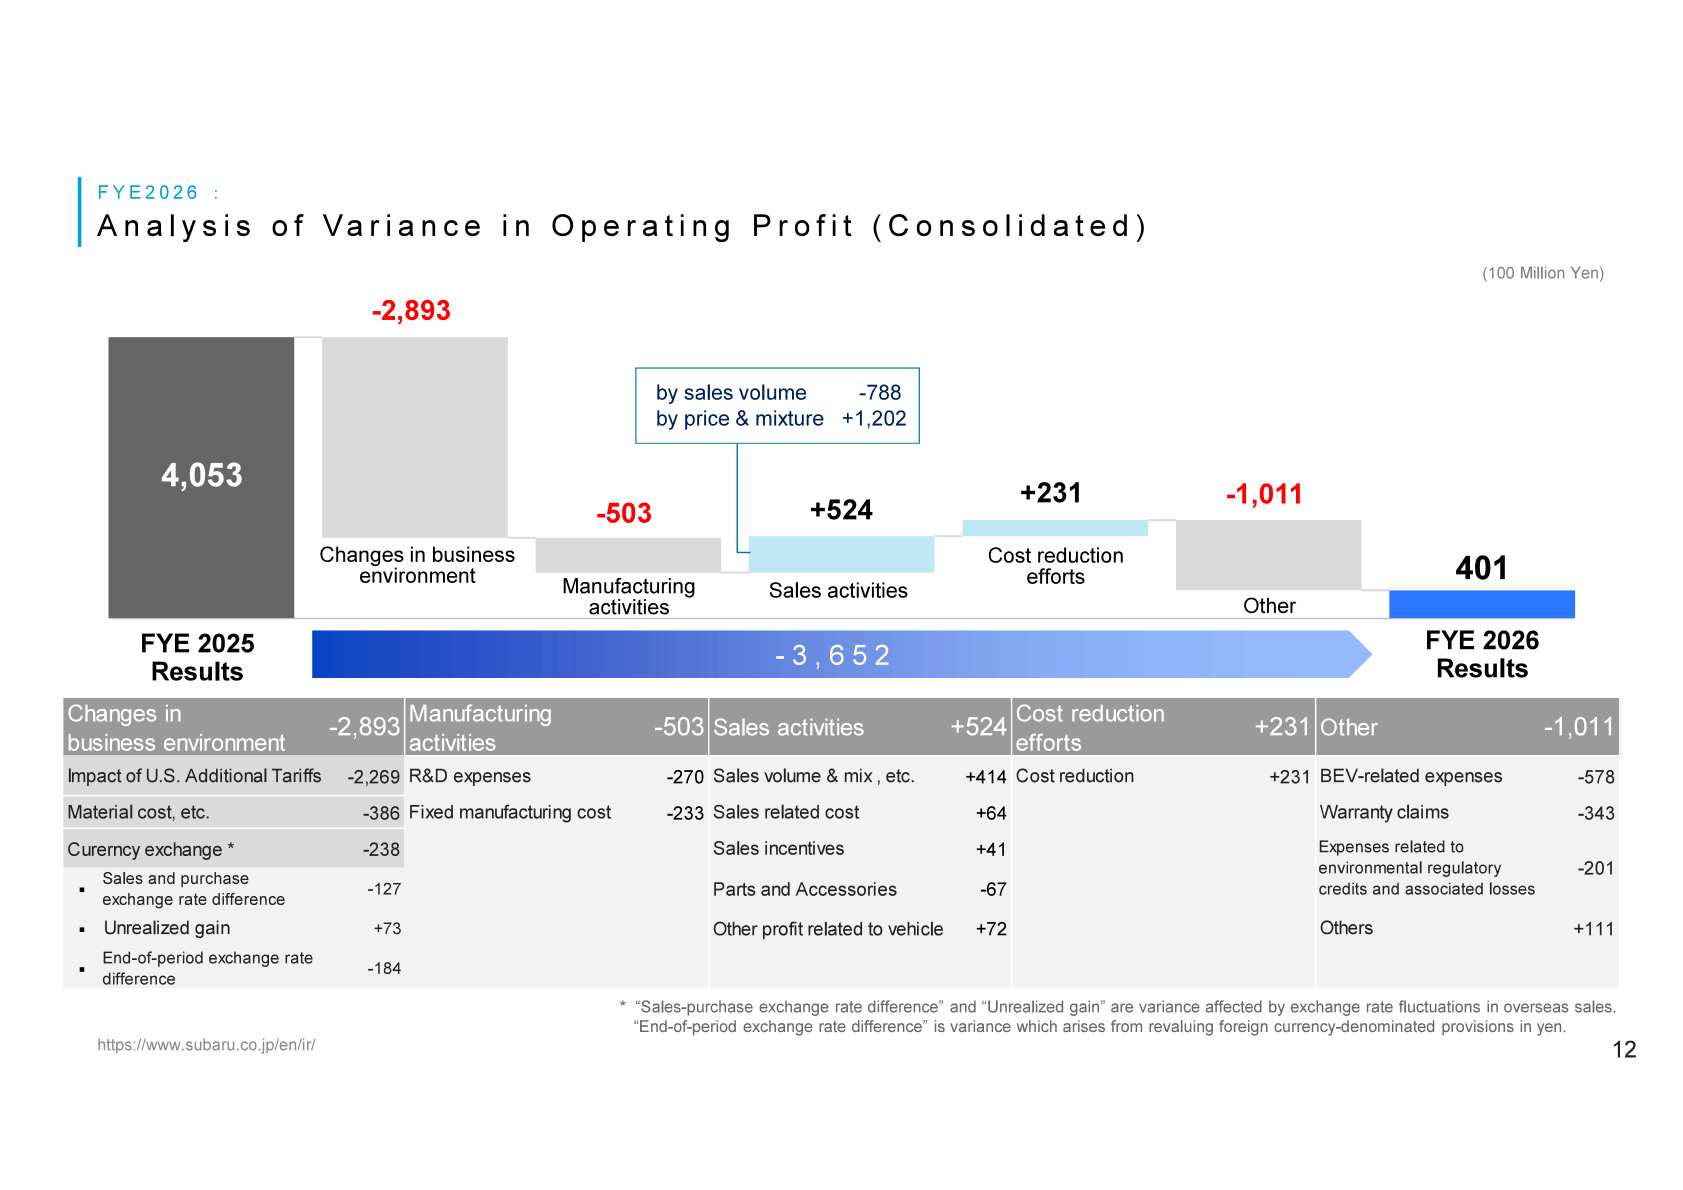
The materials break down the 3,652 decrease in operating profit (100 million yen) versus FYE 2025 into the following categories.
| Category | Amount | Main components |
|---|---|---|
| Changes in business environment | -2,893 | Impact of U.S. Additional Tariffs -2,269; Material cost, etc. -386; Currency exchange -238 |
| Manufacturing activities | -503 | R&D expenses -270; Fixed manufacturing cost -233 |
| Sales activities | +524 | Sales volume & mix, etc. +414; Sales related cost +64; Sales incentives +41; Parts and Accessories -67; Other profit related to vehicle +72 |
| Cost reduction efforts | +231 | Cost reduction +231 |
| Other | -1,011 | BEV-related expenses -578; Warranty claims -343; Expenses related to environmental regulatory credits and associated losses -201; Others +111 |
Segment Results
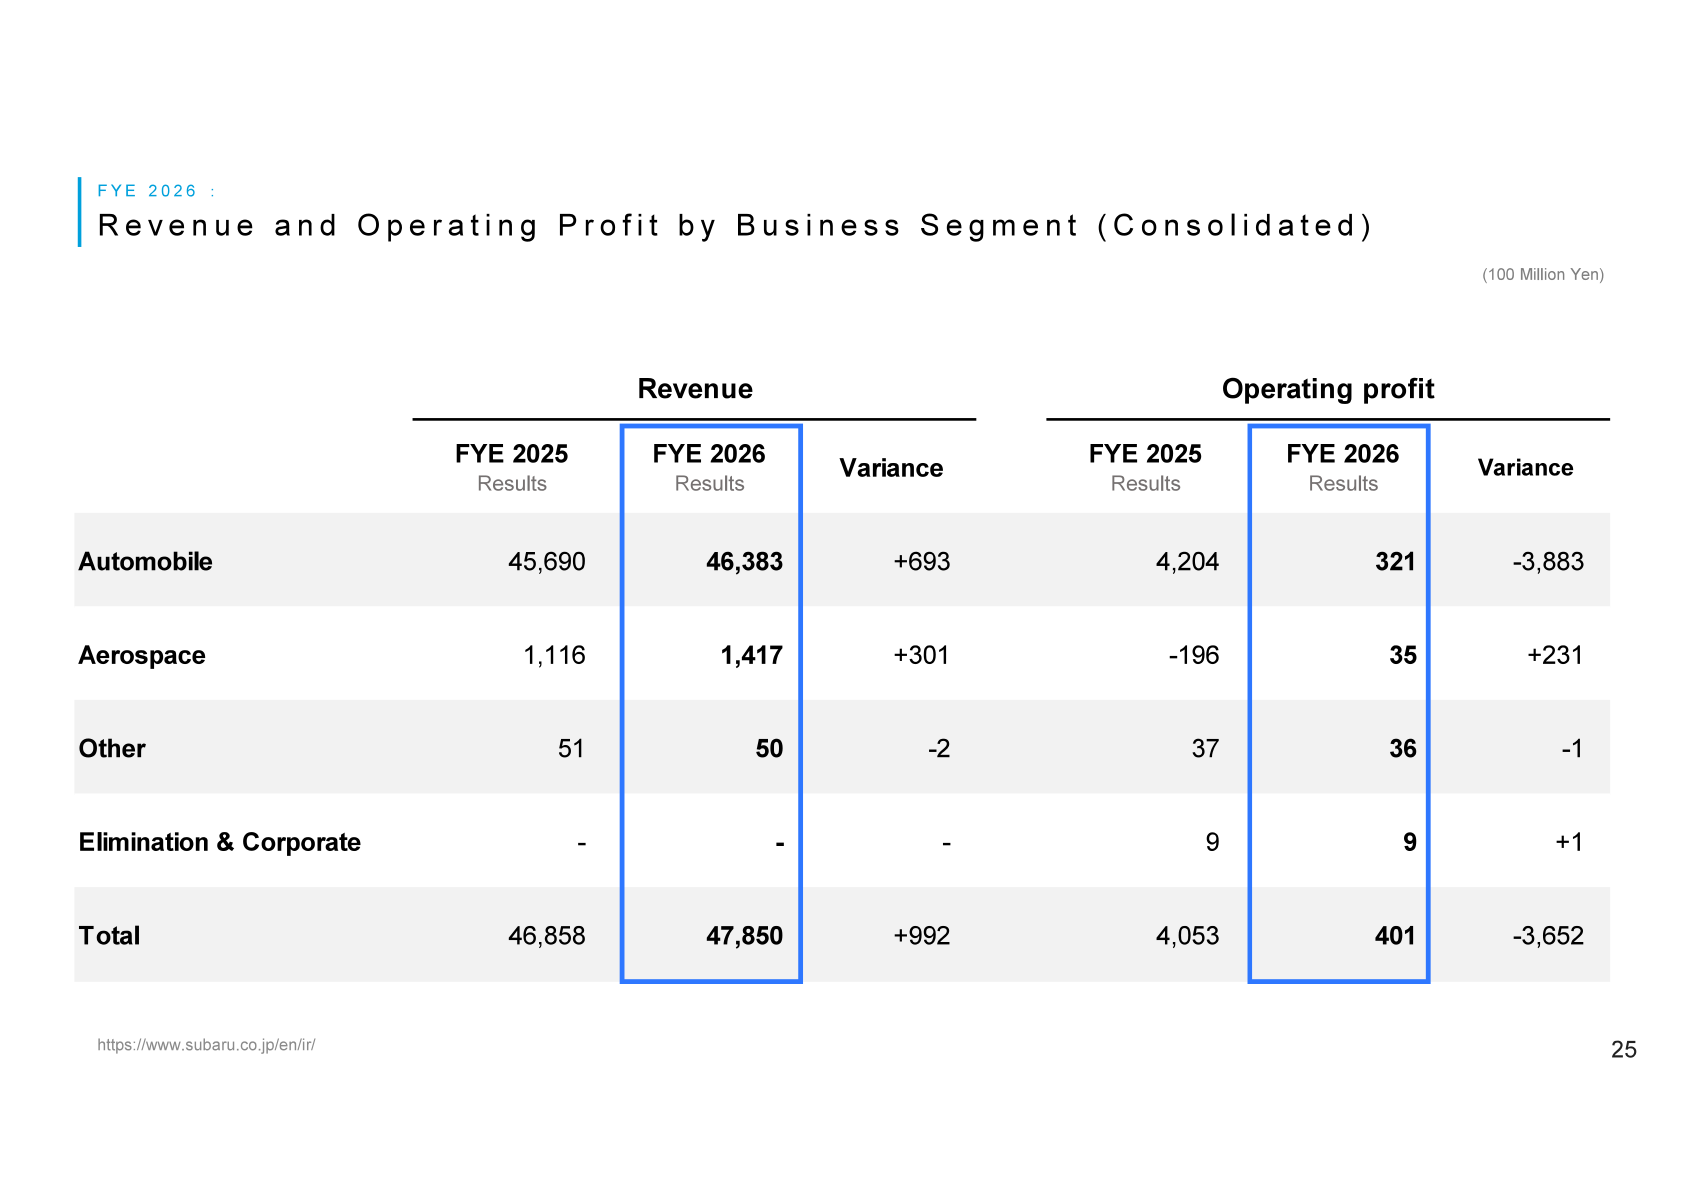
By business segment (100 million yen), Automobile revenue increased but its operating profit fell to 321. Aerospace revenue grew to 1,417 and the segment returned to an operating profit of 35 from an operating loss of -196 in FYE 2025.
| Segment | Revenue FYE 2026 | Revenue FYE 2025 | Operating profit FYE 2026 | Operating profit FYE 2025 |
|---|---|---|---|---|
| Automobile | 46,383 | 45,690 | 321 | 4,204 |
| Aerospace | 1,417 | 1,116 | 35 | -196 |
| Other | 50 | 51 | 36 | 37 |
| Elimination & Corporate | – | – | 9 | 9 |
| Total | 47,850 | 46,858 | 401 | 4,053 |
By geographic area (100 million yen), Japan recorded an operating loss of -1,107 against an operating profit of 3,127 in FYE 2025, while North America operating profit rose to 1,081.
| Geographic area | Revenue FYE 2026 | Revenue FYE 2025 | Operating profit FYE 2026 | Operating profit FYE 2025 |
|---|---|---|---|---|
| Japan | 9,804 | 9,438 | -1,107 | 3,127 |
| North America | 36,927 | 36,278 | 1,081 | 1,009 |
| Other | 1,119 | 1,141 | 49 | 5 |
| Elimination & Corporate | – | – | 378 | -89 |
| Total | 47,850 | 46,858 | 401 | 4,053 |
Within the Automotive business unit (management figures, 100 million yen), New vehicle swung to -1,482 from 2,388, Parts and accessories was 1,503 versus 1,544, and Others — which includes profit from Sales Finance, Connected Services, Used Vehicle Sales, and Maintenance — was 300 versus 272.
FYE 2027 Forecast
SUBARU forecasts a recovery in profits for FYE 2027. Amounts are in 100 million yen and exchange rates in yen. Consolidated unit sales are forecast at 940 thousand units (+44 versus FYE 2026) and complete cars production total at 900 thousand units (+20). By market, the unit sales forecast is 108 thousand units domestic (+5), 736 thousand units in North America (+28), and 832 thousand units overseas total (+39).
| Item | FYE 2027 (Forecast) | FYE 2026 (Results) | Variance |
|---|---|---|---|
| Revenue | 52,000 | 47,850 | +4,150 |
| Operating profit | 1,500 | 401 | +1,099 |
| Profit before tax | 1,800 | 1,075 | +725 |
| Profit for the period attributable to owners of parent | 1,300 | 908 | +392 |
| Exchange rate — US$ | ¥155 | ¥150 | +¥5 |
| Exchange rate — EURO | ¥180 | ¥174 | +¥6 |
| Exchange rate — CAN$ | ¥110 | ¥109 | +¥1 |
| Capex | 1,600 | 2,102 | -502 |
| Depreciation | 1,250 | 1,036 | +214 |
| R&D expenditures | 1,450 | 1,580 | -130 |
The forecast bridge from the FYE 2026 operating profit of 401 to the FYE 2027 forecast of 1,500 comprises a decrease in major expenses of +1,500, foreign exchange impacts of +400, sales volume & mixture of -200, improvements in vehicle sales profit of +300, cost innovation of +300, value chain profit and others of +100, and raw material costs and market conditions of -1,300. For the FYE 2027 outlook, the company anticipates downside risks of over 130 billion yen to earnings due to higher raw material costs and adverse precious metals market conditions, as well as the impact of the Middle East situation, and is aiming for operating profit of 150 billion yen.
Shareholder Returns
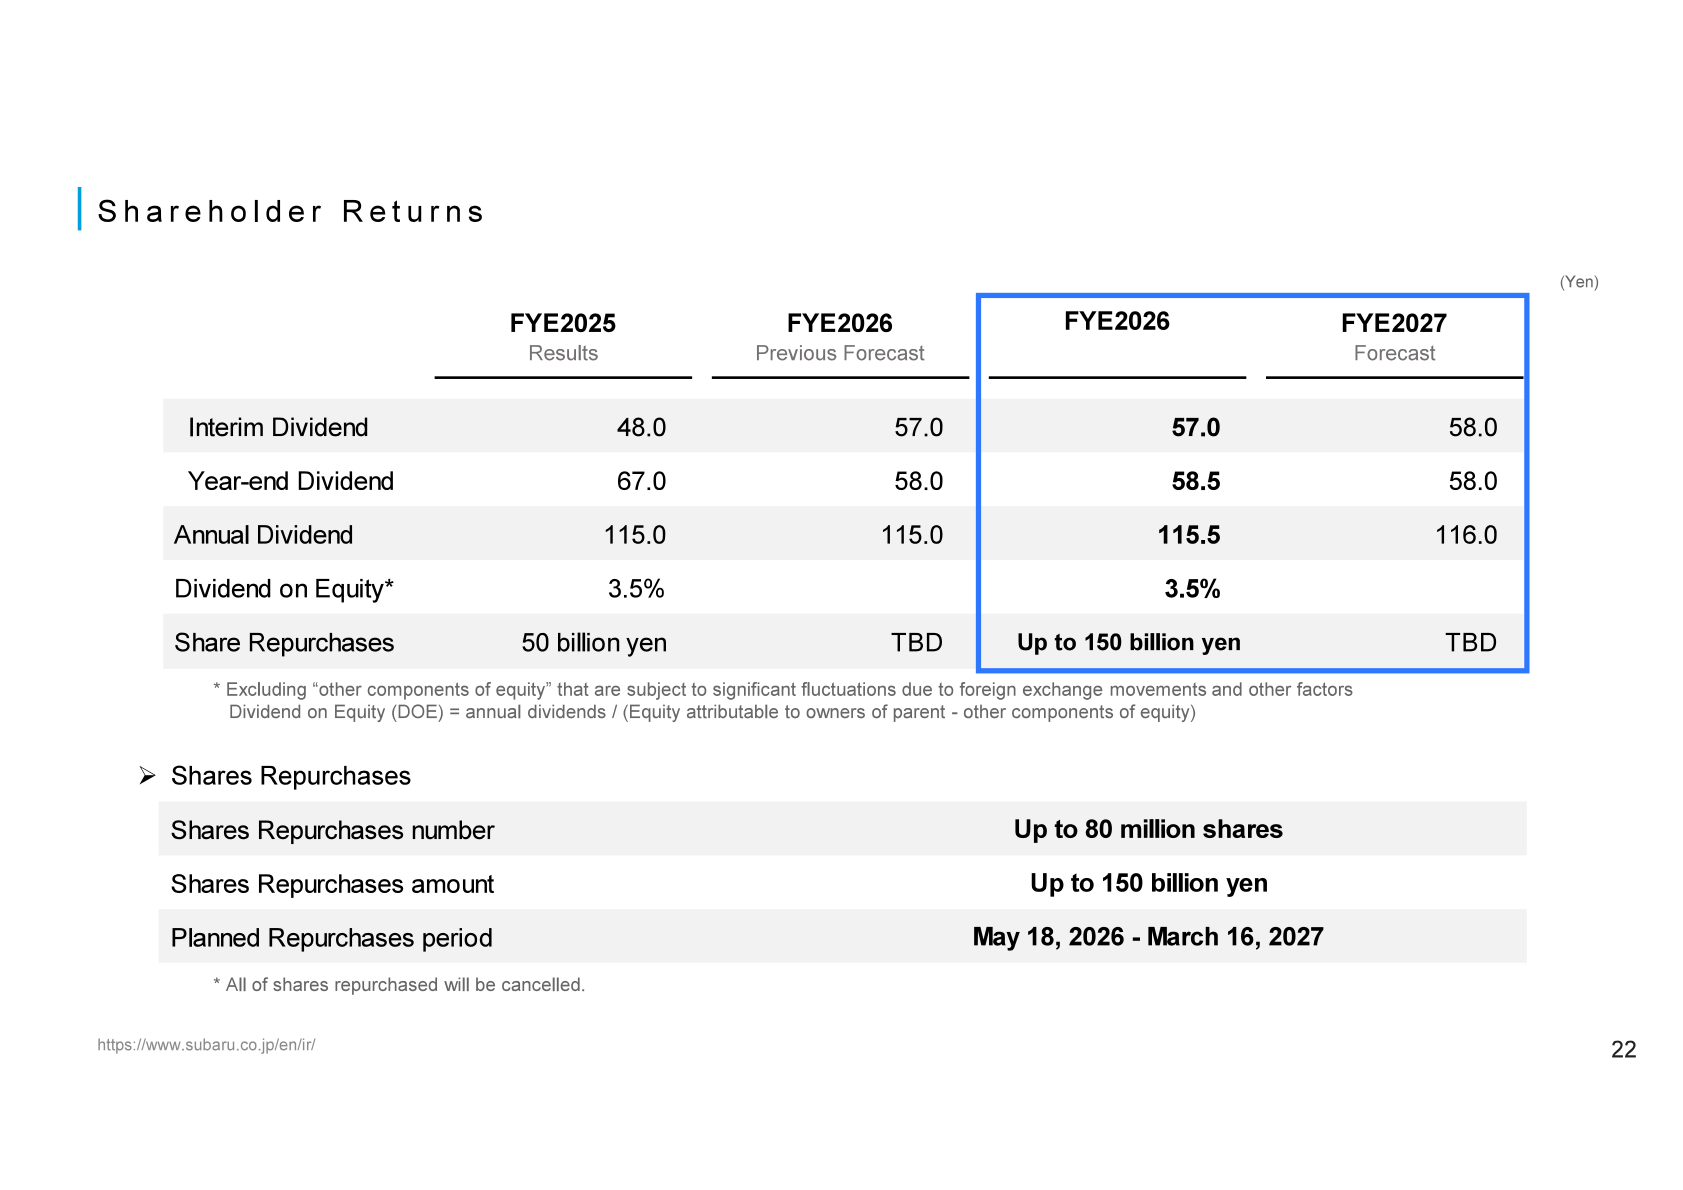
Dividends, which constitute the basis of shareholder returns, are implemented based on 3.5% DOE (Dividend on Equity), defined as annual dividends divided by equity attributable to owners of parent less other components of equity, excluding “other components of equity” that are subject to significant fluctuations due to foreign exchange movements and other factors. The annual dividend for FYE 2026 is 115.5 yen, and the FYE 2027 forecast is 116.0 yen. On May 15th the company resolved to conduct share repurchases of up to 150 billion yen.
| Item | FYE 2025 (Results) | FYE 2026 | FYE 2027 (Forecast) |
|---|---|---|---|
| Interim Dividend | 48.0 | 57.0 | 58.0 |
| Year-end Dividend | 67.0 | 58.5 | 58.0 |
| Annual Dividend | 115.0 | 115.5 | 116.0 |
| Dividend on Equity | 3.5% | 3.5% | – |
| Share Repurchases | 50 billion yen | Up to 150 billion yen | TBD |
For the announced share repurchase programme, the number of shares to be repurchased is up to 80 million shares, the amount is up to 150 billion yen, and the planned repurchase period is May 18, 2026 – March 16, 2027. All of the shares repurchased will be cancelled.
Financial and Capital Policy / Topics
SUBARU states that it aims to achieve industry-leading profitability and pursue an ROE of 10% or higher as a long-term target toward 2030, and to execute growth investments and shareholder returns, both of which lead to improving medium- to long-term capital efficiency. Its financial and capital policy calls for balanced capital allocation among “Financial Soundness and Stability,” “Growth Investments,” and “Shareholder Returns,” including controlling cash holdings through setting an upper guideline for net cash equivalent to 2.5 months of revenue. The shareholder return policy was revised: the previous policy set dividends as the basis for shareholder returns, aiming for progressive dividends at 3.5% DOE, targeted a total returns ratio of 40% or more, and implemented share repurchases according to business performance and market conditions; the revised policy keeps dividends as the basis with progressive dividends at 3.5% DOE and adds increases in dividends and flexible share repurchases in line with business performance and market conditions.
On growth investments, the materials state that of the total growth investment of JPY 1.5 trillion, the remaining JPY 1.2 trillion will be reallocated from in-house BEV to next-generation ICE/HEV models, while R&D continues towards the future full-scale introduction of BEVs. Growth investments announced on November 10, 2025 of 1.2 trillion yen are reallocated with no change in the total investment amount. Under the “SUBARU Management Policy 2025,” the company cites progress in digitally enabled, agile development processes with shortened lead time established through BEV development efforts, and mixed-model production of BEVs and ICE/HEV models being established as a foundation for flexible manufacturing. Key areas of focus going forward are products (shifting development resources toward expanding the ICE/HEV product lineup, with the introduction of in-house developed BEVs postponed), value chain, and cost reform through the “Cost Innovation 20–30” initiative.
Cash Flows
Net cash provided by operating activities was 3,582 (100 million yen) versus 4,921 in FYE 2025, net cash used in investing activities was -1,147 versus -4,041, and free cash flows were 2,436 versus 881. Net cash provided by (used in) financing activities was -2,178. As of March 2026, cash and cash equivalents including time deposits stood at 14,534 and net cash including time deposits at 10,689, against 15,897 and 11,902 respectively as of March 2025.
This article is an analysis based on publicly available information and is not a recommendation to buy or sell any specific securities. Investment decisions are your own responsibility.
![[Obayashi] Investors’ Guide 2026 — The Complete 24-Article Breakdown](https://japan-equity.com/wp-content/uploads/2026/07/hub_cover-1024x1024.png)
![[Obayashi] IR & SR Policy — Feeding Dialogue Back into Management](https://japan-equity.com/wp-content/uploads/2026/07/p32_sq-1024x1024.jpg)
![[Obayashi] Real Estate Development — 18.7% Margin, ¥287.7bn Unrealized Gains](https://japan-equity.com/wp-content/uploads/2026/07/p20_sq-1024x1024.jpg)
![[Obayashi] Domestic Civil Engineering — Resilience Spending Supports 9.6% Margin](https://japan-equity.com/wp-content/uploads/2026/07/p11_sq-1024x1024.jpg)
![[Obayashi] Share Price & External Ratings — vs TOPIX, ESG Index Inclusion](https://japan-equity.com/wp-content/uploads/2026/07/p40_sq-1024x1024.jpg)
![[Construction] ¥75.5tn Investment, Shrinking Workforce — Big-5 Market Share](https://japan-equity.com/wp-content/uploads/2026/07/p12_sq-1024x1024.jpg)



![[Obayashi] Capital Policy & Shareholder Returns — ROE 10%+, DOE ~5%, ¥100bn Buyback](https://japan-equity.com/wp-content/uploads/2026/07/p27_sq-1024x1024.jpg)
![[Obayashi] Reducing Cross-Shareholdings — ¥285.2bn Sold in Five Years](https://japan-equity.com/wp-content/uploads/2026/07/p29_sq-1024x1024.jpg)
![[Obayashi] ¥750bn Investment Plan — ¥300bn to Development, ¥190bn to Tech/DX](https://japan-equity.com/wp-content/uploads/2026/07/p30_sq-1024x1024.jpg)
![[Obayashi] MTP2022 KPIs — Operating Profit ~2x Target, ROE 14.4%](https://japan-equity.com/wp-content/uploads/2026/07/p25_sq-1024x1024.jpg)
![[Obayashi] Cash Allocation — ¥420bn Investment CF Over Five Years](https://japan-equity.com/wp-content/uploads/2026/07/p26_sq-1024x1024.jpg)
![[Obayashi] Green Energy — 44 Plants, 344MW, and the Green Hydrogen Challenge](https://japan-equity.com/wp-content/uploads/2026/07/p21_sq-1024x1024.jpg)
![[Obayashi] Tackling the Labor Shortage — Robotics Construction®](https://japan-equity.com/wp-content/uploads/2026/07/p14_sq-1024x1024.jpg)
