
This article is based on publicly available IR materials and is not a recommendation to buy or sell any specific securities.
Note: Premium Group’s presentation labels the fiscal year ended March 31, 2026 as FY2026 (abbreviated FY26 in tables); this site classifies the most recent completed fiscal year as FY2025 in the title, while all labels in the body below follow the source material.
Premium Group Co., Ltd. (TSE Prime, 7199), an auto mobility company operating finance (auto credit), automobile warranty, and auto mobility services businesses, reported results for the fiscal year ended March 31, 2026 on May 11, 2026. Operating revenue, operating profit, and profit before tax all grew over 20% year on year, setting new record highs, and the company achieved its 9th consecutive year of increased revenue and profit since listing. Costs associated with the system failure totaled ¥1.13 billion and converged in FY2026. On the same day as these results, the company announced its new medium-term management plan, “Change & Prove 2030.”
Consolidated Results (Full-Year Actual)
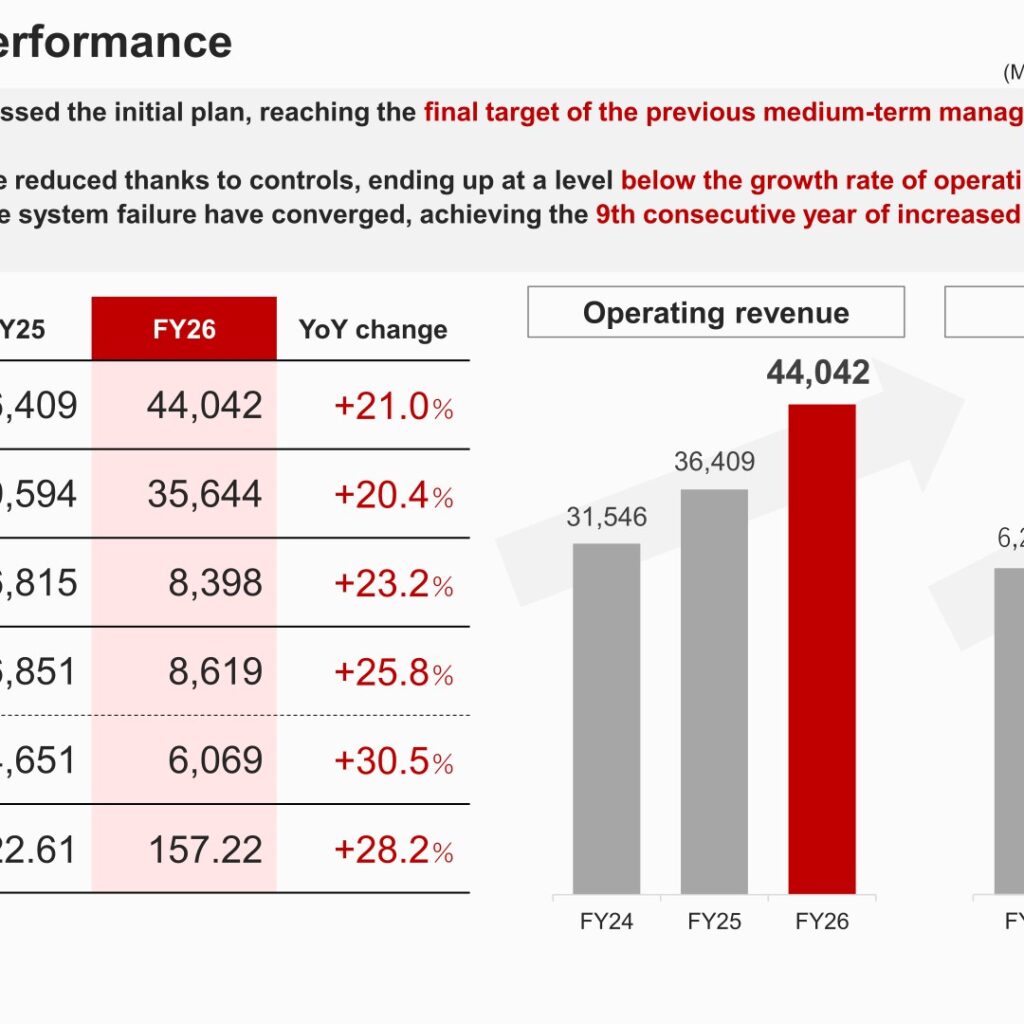
Operating revenue reached ¥44,042 million, up 21.0% year on year, surpassing the initial plan and reaching the final target of the previous medium-term management plan of ¥44.0 billion. Operating expenses were reduced thanks to controls, ending up at a level below the growth rate of operating revenue. Profit before tax rose 25.8% to ¥8,619 million, and profit attributable to owners of parent rose 30.5% to ¥6,069 million.
| Item (Millions of yen) | FY25 | FY26 | YoY change |
|---|---|---|---|
| Operating revenue | 36,409 | 44,042 | +21.0% |
| Operating expenses | 29,594 | 35,644 | +20.4% |
| Operating profit | 6,815 | 8,398 | +23.2% |
| Profit before tax | 6,851 | 8,619 | +25.8% |
| Profit attributable to owners of parent | 4,651 | 6,069 | +30.5% |
| Basic earnings per share (yen) | 122.61 | 157.22 | +28.2% |
Segment Results
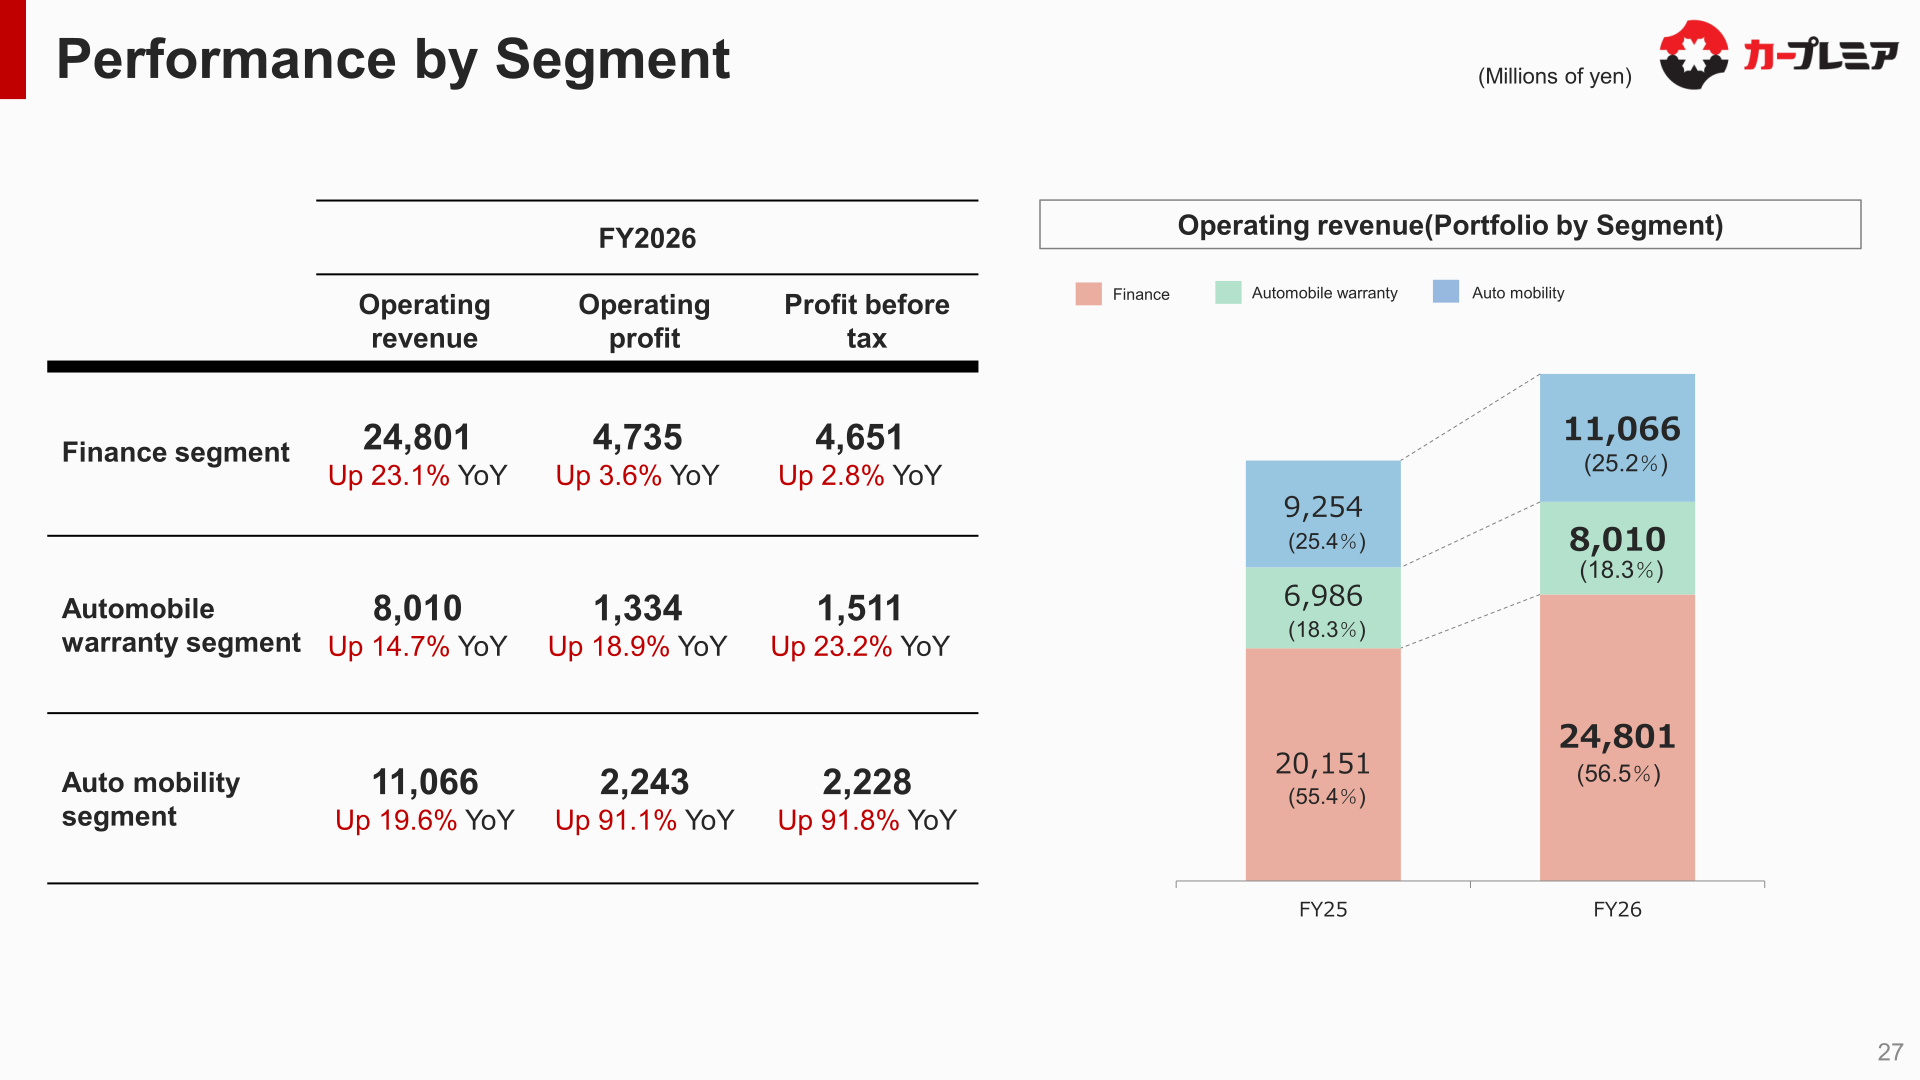
In the Finance segment, operating revenue grew 23.1% year on year, and profit before tax returned to positive year-on-year growth following the elimination of costs due to the system failure (from -34.7% YoY in 2Q to +2.8% YoY in 4Q); software disposal (approximately -¥0.6 billion), etc. impacted profits. The Automobile warranty segment continued to see double-digit growth in operating revenue, operating profit, and profit before tax, with profit growth exceeding revenue growth driven by an increasing ratio of proprietary warranties. In the Auto mobility services segment, profit before tax jumped 91.8% year on year, with membership fee revenue from Car Premium Club—a pillar of the new medium-term management plan—increasing steadily.
| Segment | Metric (Millions of yen) | FY25 | FY26 | YoY change |
|---|---|---|---|---|
| Finance | Operating revenue | 20,151 | 24,801 | +23.1% |
| Finance | Operating profit | 4,570 | 4,735 | +3.6% |
| Finance | Profit before tax | 4,526 | 4,651 | +2.8% |
| Automobile warranty | Operating revenue | 6,986 | 8,010 | +14.7% |
| Automobile warranty | Operating profit | 1,122 | 1,334 | +18.9% |
| Automobile warranty | Profit before tax | 1,227 | 1,511 | +23.2% |
| Auto mobility | Operating revenue | 9,254 | 11,066 | +19.6% |
| Auto mobility | Operating profit | 1,174 | 2,243 | +91.1% |
| Auto mobility | Profit before tax | 1,161 | 2,228 | +91.8% |
Business KPIs and Car Premium Club
The total volume of new loans was ¥355.4 billion, up 0.3% year on year, steadily recovering driven by the increase in Car Premium Club members (from -4.8% YoY in 3Q to -2.1% YoY in 4Q). Loan receivables grew 13.9% year on year to ¥887.1 billion. The delinquency rate stood at 2.73% at fiscal year-end (FY25: 1.83%); per the trend chart it declined from 4.2% in September 2025 to 2.7% in March 2026, and the company states it has recovered from the deterioration caused by the system failure and is expected to normalize during the current fiscal year. The total volume of new automobile warranties grew 16.8% year on year to ¥8.79 billion, with proprietary warranties up 34.8% year on year.
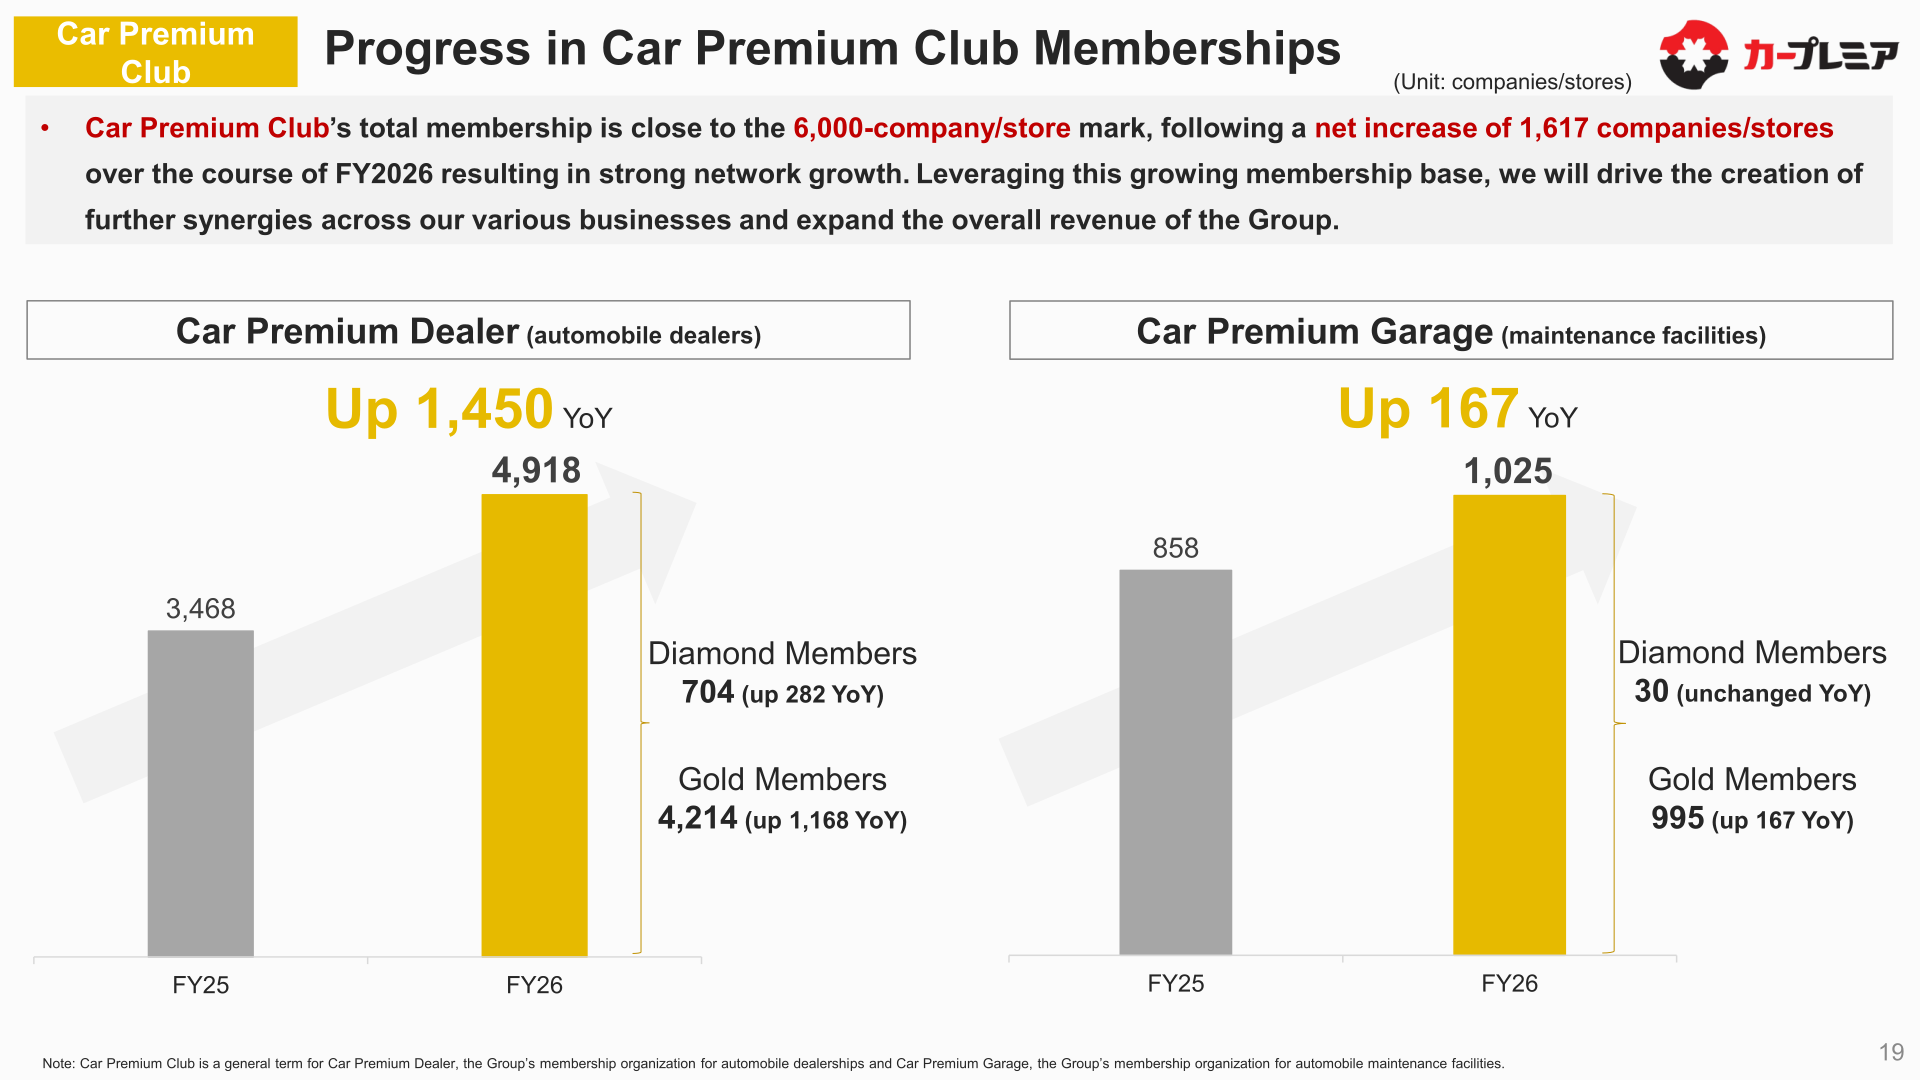
Car Premium Club’s total membership is close to the 6,000-company/store mark, following a net increase of 1,617 companies/stores over the course of FY2026. Car Premium Dealer (automobile dealers) membership rose to 4,918 (up 1,450 YoY), comprising 704 Diamond Members (up 282 YoY) and 4,214 Gold Members (up 1,168 YoY). Car Premium Garage (maintenance facilities) membership rose to 1,025 (up 167 YoY), comprising 30 Diamond Members (unchanged YoY) and 995 Gold Members (up 167 YoY).
Forecast for FY Ending March 31, 2027
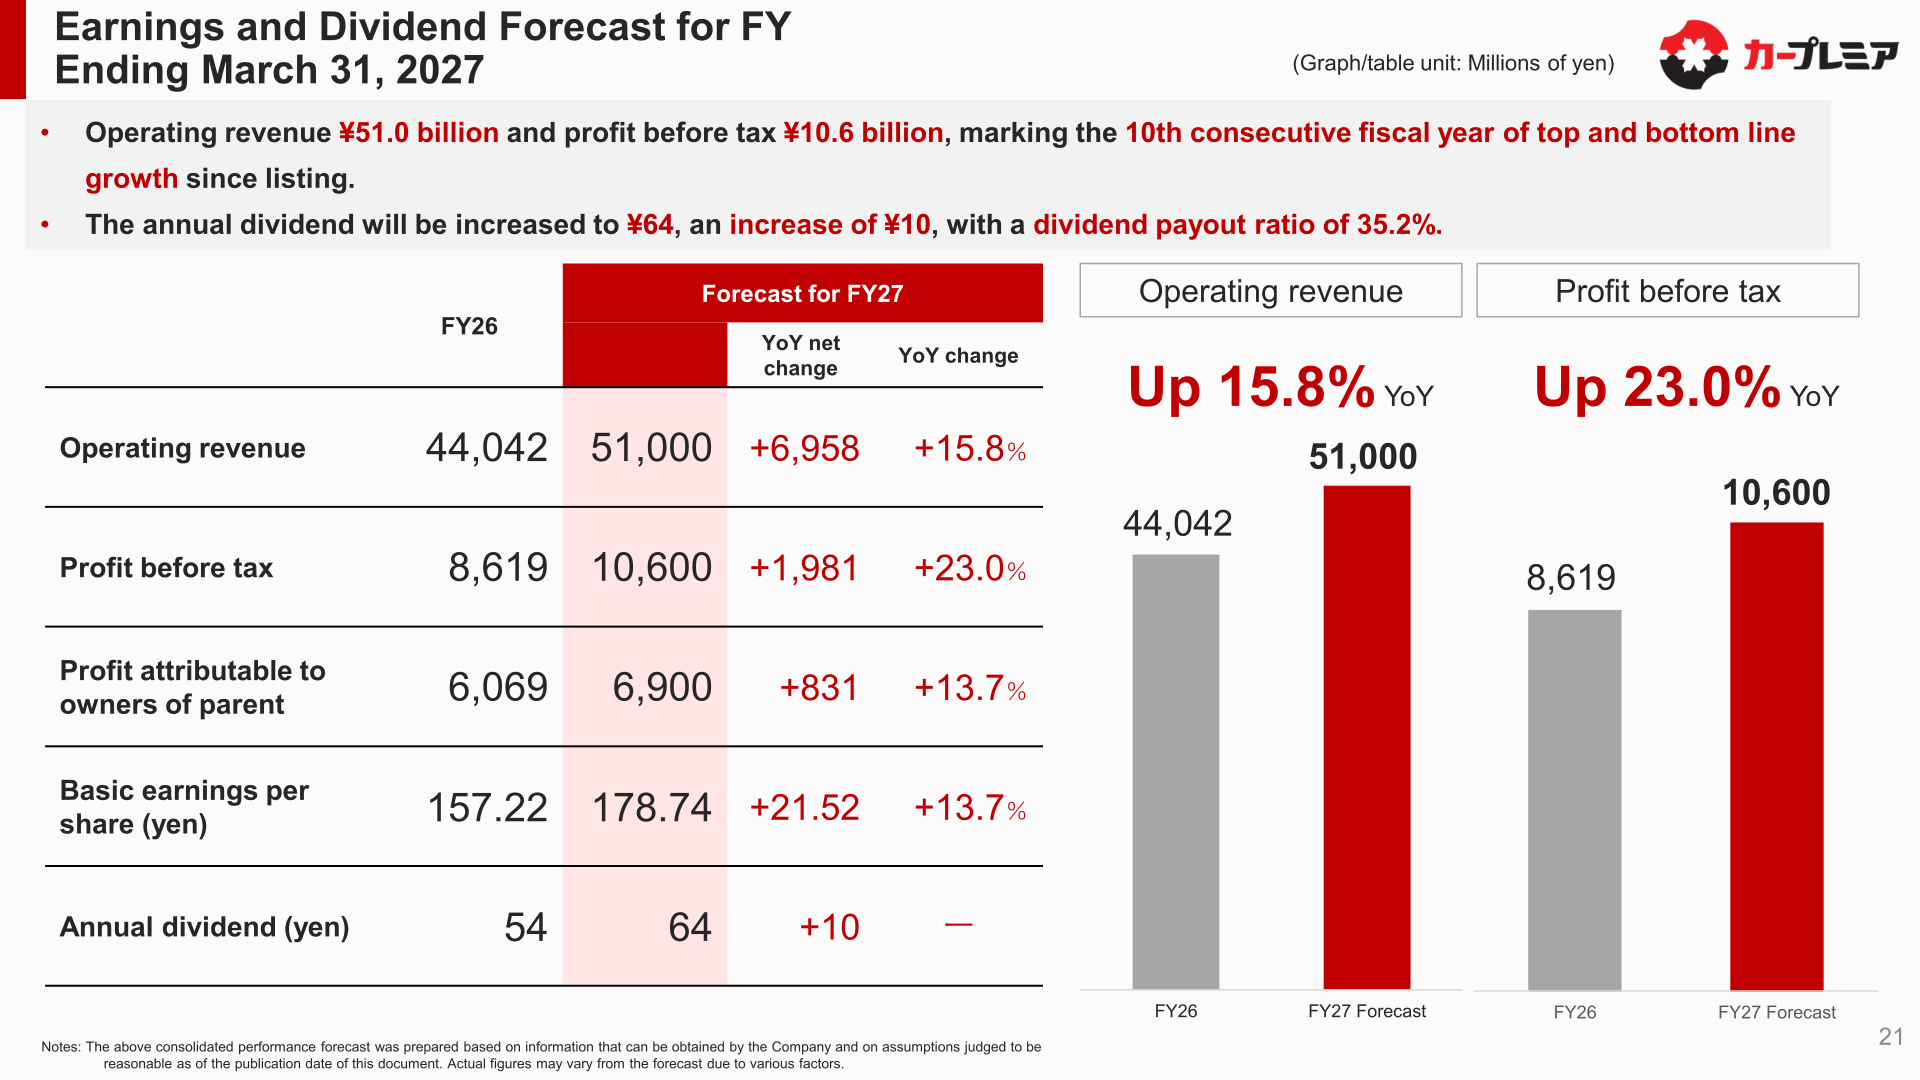
For the fiscal year ending March 31, 2027, the company forecasts operating revenue of ¥51.0 billion and profit before tax of ¥10.6 billion, marking the 10th consecutive fiscal year of top and bottom line growth since listing.
| Item (Millions of yen) | FY26 | Forecast for FY27 | YoY net change | YoY change |
|---|---|---|---|---|
| Operating revenue | 44,042 | 51,000 | +6,958 | +15.8% |
| Profit before tax | 8,619 | 10,600 | +1,981 | +23.0% |
| Profit attributable to owners of parent | 6,069 | 6,900 | +831 | +13.7% |
| Basic earnings per share (yen) | 157.22 | 178.74 | +21.52 | +13.7% |
| Annual dividend (yen) | 54 | 64 | +10 | — |
Shareholder Returns
The annual dividend for FY26 was ¥54 per share. For the fiscal year ending March 31, 2027, the annual dividend will be increased to ¥64, an increase of ¥10, with a dividend payout ratio of 35.2%.
New Medium-Term Management Plan: Change & Prove 2030
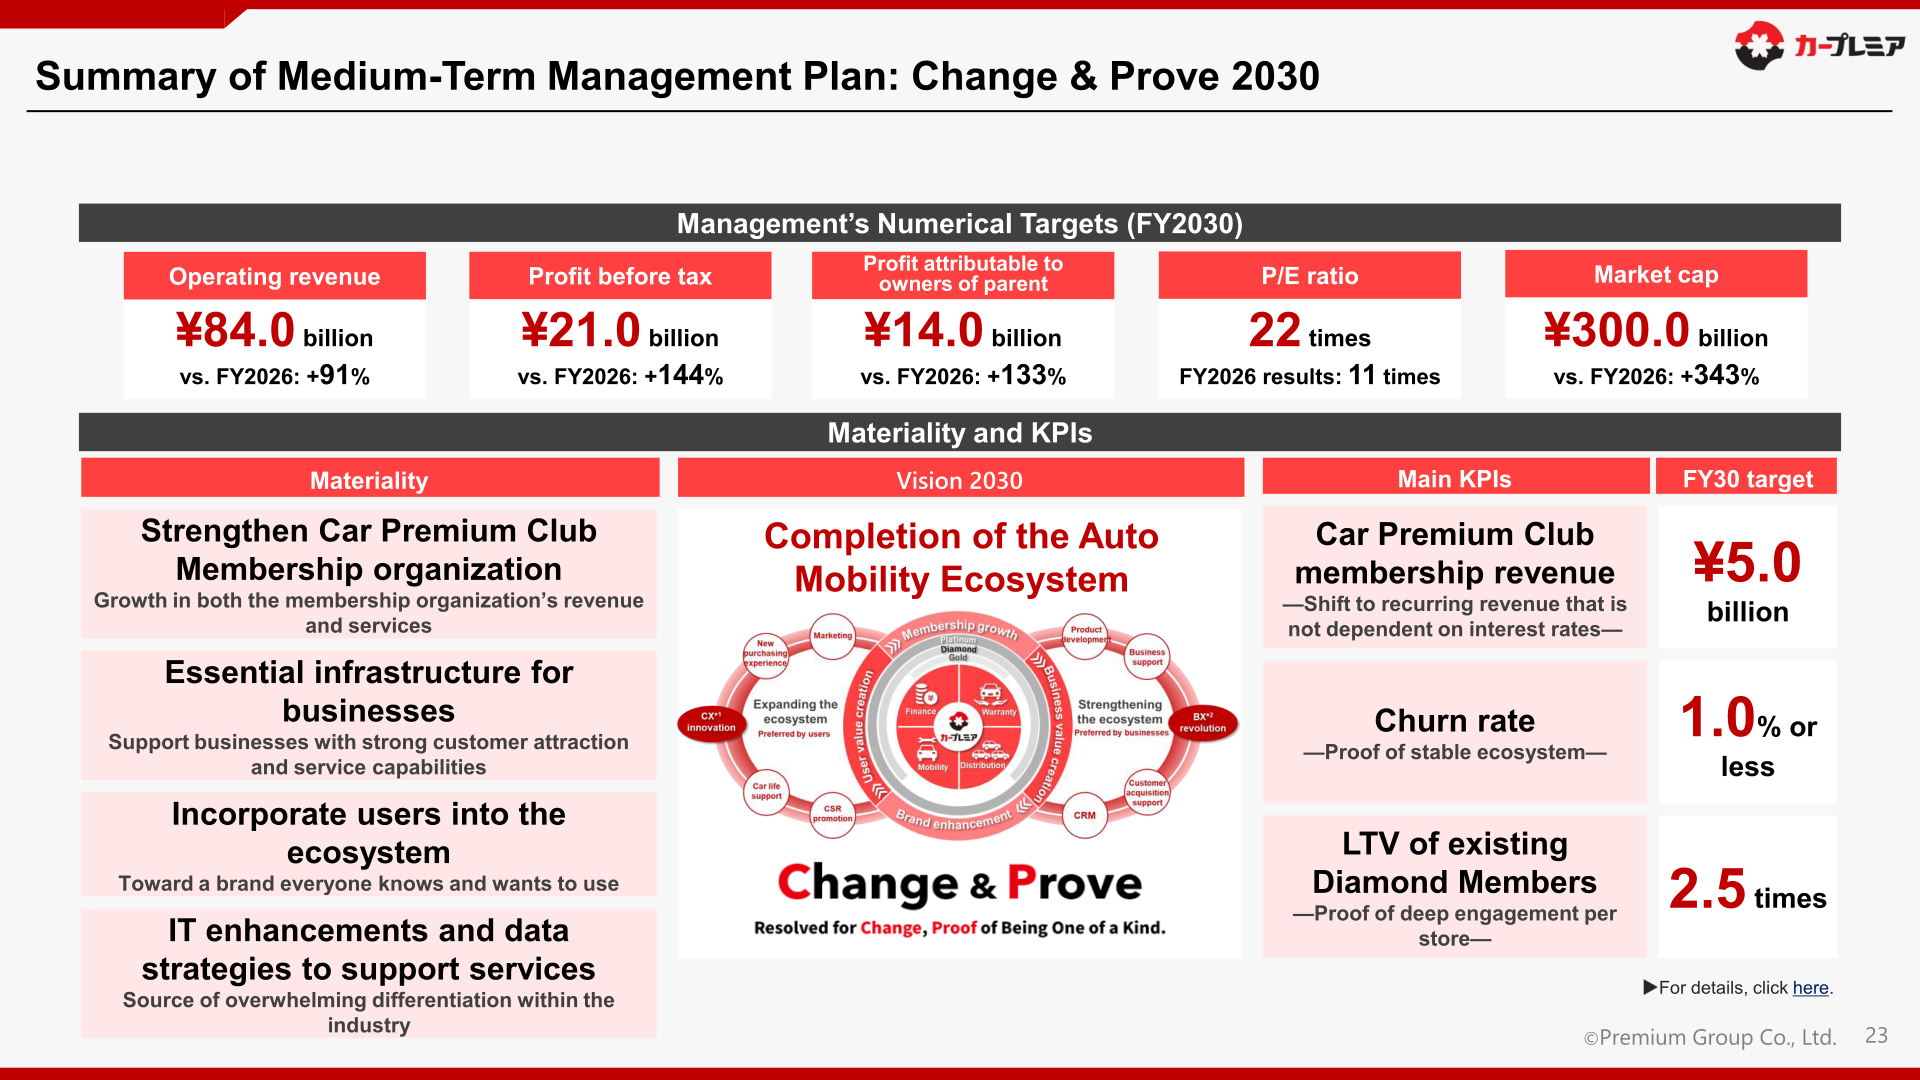
Announced on May 11, 2026, the new medium-term management plan “Change & Prove 2030” sets out the Vision 2030 of “Completion of the Auto Mobility Ecosystem.” Management’s numerical targets for FY2030 are operating revenue of ¥84.0 billion (vs. FY2026: +91%), profit before tax of ¥21.0 billion (vs. FY2026: +144%), profit attributable to owners of parent of ¥14.0 billion (vs. FY2026: +133%), a P/E ratio of 22 times (FY2026 results: 11 times), and a market cap of ¥300.0 billion (vs. FY2026: +343%).
| Main KPIs | FY30 target |
|---|---|
| Car Premium Club membership revenue — Shift to recurring revenue that is not dependent on interest rates | ¥5.0 billion |
| Churn rate — Proof of stable ecosystem | 1.0% or less |
| LTV of existing Diamond Members — Proof of deep engagement per store | 2.5 times |
This article is an analysis based on publicly available information and is not a recommendation to buy or sell any specific securities. Investment decisions are your own responsibility.
![[Obayashi] Investors’ Guide 2026 — The Complete 24-Article Breakdown](https://japan-equity.com/wp-content/uploads/2026/07/hub_cover-1024x1024.png)
![[Obayashi] IR & SR Policy — Feeding Dialogue Back into Management](https://japan-equity.com/wp-content/uploads/2026/07/p32_sq-1024x1024.jpg)
![[Obayashi] Domestic Civil Engineering — Resilience Spending Supports 9.6% Margin](https://japan-equity.com/wp-content/uploads/2026/07/p11_sq-1024x1024.jpg)
![[Obayashi] Overseas Construction — Orders Reach ¥1.2tn](https://japan-equity.com/wp-content/uploads/2026/07/p15_sq-1024x1024.jpg)
![[Obayashi] Share Price & External Ratings — vs TOPIX, ESG Index Inclusion](https://japan-equity.com/wp-content/uploads/2026/07/p40_sq-1024x1024.jpg)
![[Construction] ¥75.5tn Investment, Shrinking Workforce — Big-5 Market Share](https://japan-equity.com/wp-content/uploads/2026/07/p12_sq-1024x1024.jpg)



![[Obayashi] Capital Policy & Shareholder Returns — ROE 10%+, DOE ~5%, ¥100bn Buyback](https://japan-equity.com/wp-content/uploads/2026/07/p27_sq-1024x1024.jpg)
![[Obayashi] Reducing Cross-Shareholdings — ¥285.2bn Sold in Five Years](https://japan-equity.com/wp-content/uploads/2026/07/p29_sq-1024x1024.jpg)
![[Obayashi] ¥750bn Investment Plan — ¥300bn to Development, ¥190bn to Tech/DX](https://japan-equity.com/wp-content/uploads/2026/07/p30_sq-1024x1024.jpg)
![[Obayashi] MTP2022 KPIs — Operating Profit ~2x Target, ROE 14.4%](https://japan-equity.com/wp-content/uploads/2026/07/p25_sq-1024x1024.jpg)
![[Obayashi] Cash Allocation — ¥420bn Investment CF Over Five Years](https://japan-equity.com/wp-content/uploads/2026/07/p26_sq-1024x1024.jpg)
![[Obayashi] Green Energy — 44 Plants, 344MW, and the Green Hydrogen Challenge](https://japan-equity.com/wp-content/uploads/2026/07/p21_sq-1024x1024.jpg)
![[Obayashi] Tackling the Labor Shortage — Robotics Construction®](https://japan-equity.com/wp-content/uploads/2026/07/p14_sq-1024x1024.jpg)
