
This article is based on publicly available IR materials and is not a recommendation to buy or sell any specific securities.
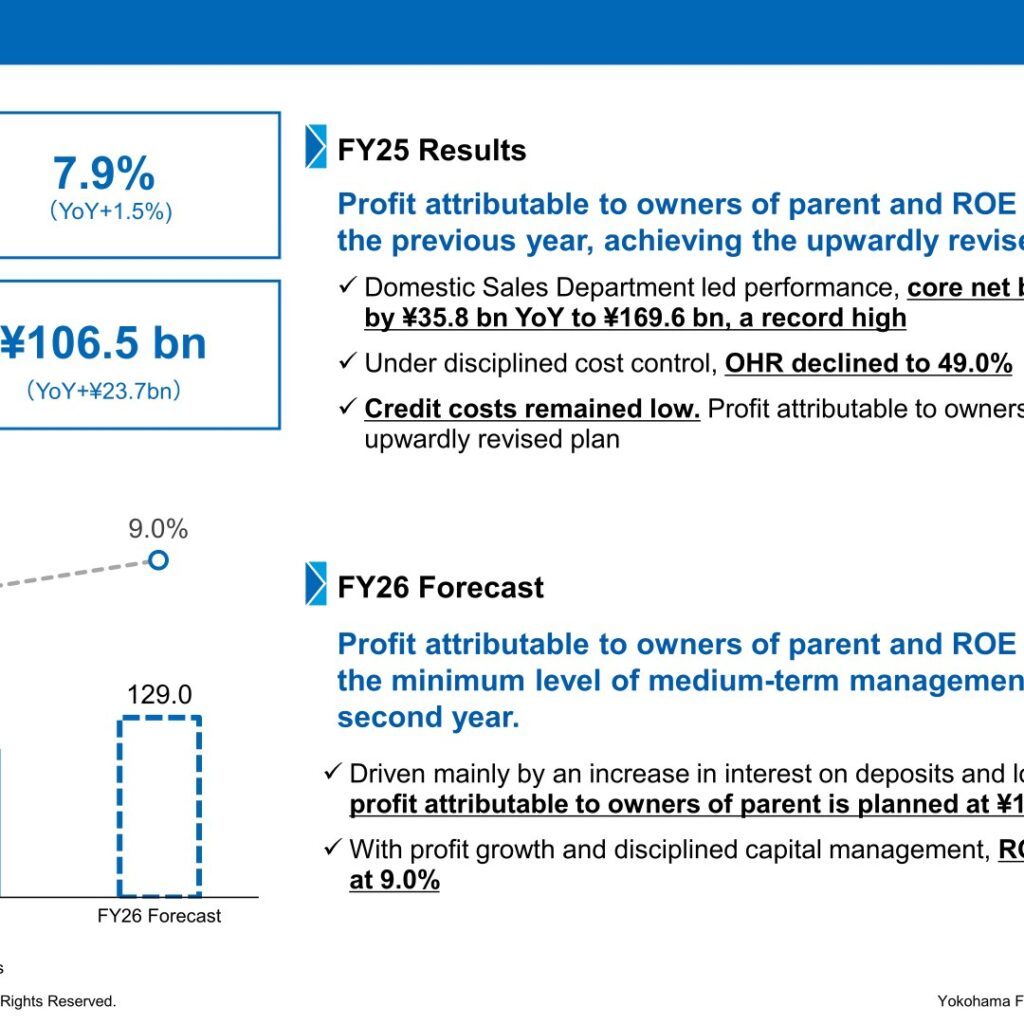
Yokohama Financial Group, Inc. released its FY2025 Investor Presentation on May 12, 2026, covering the fiscal year ended March 2026. Profit attributable to owners of parent came to ¥106.5 bn, up ¥23.7 bn year on year, and ROE (TSE standards) rose 1.5pt to 7.9%, both exceeding the upwardly revised plan. Core net business profit excluding gains (losses) on bonds and cancellation of investment trusts for the three banks combined increased ¥35.8 bn to ¥169.6 bn, described in the materials as a record high. For FY2026 the group plans profit attributable to owners of parent of ¥129.0 bn and ROE of 9.0%.
Consolidated Results (Full-Year Actual)
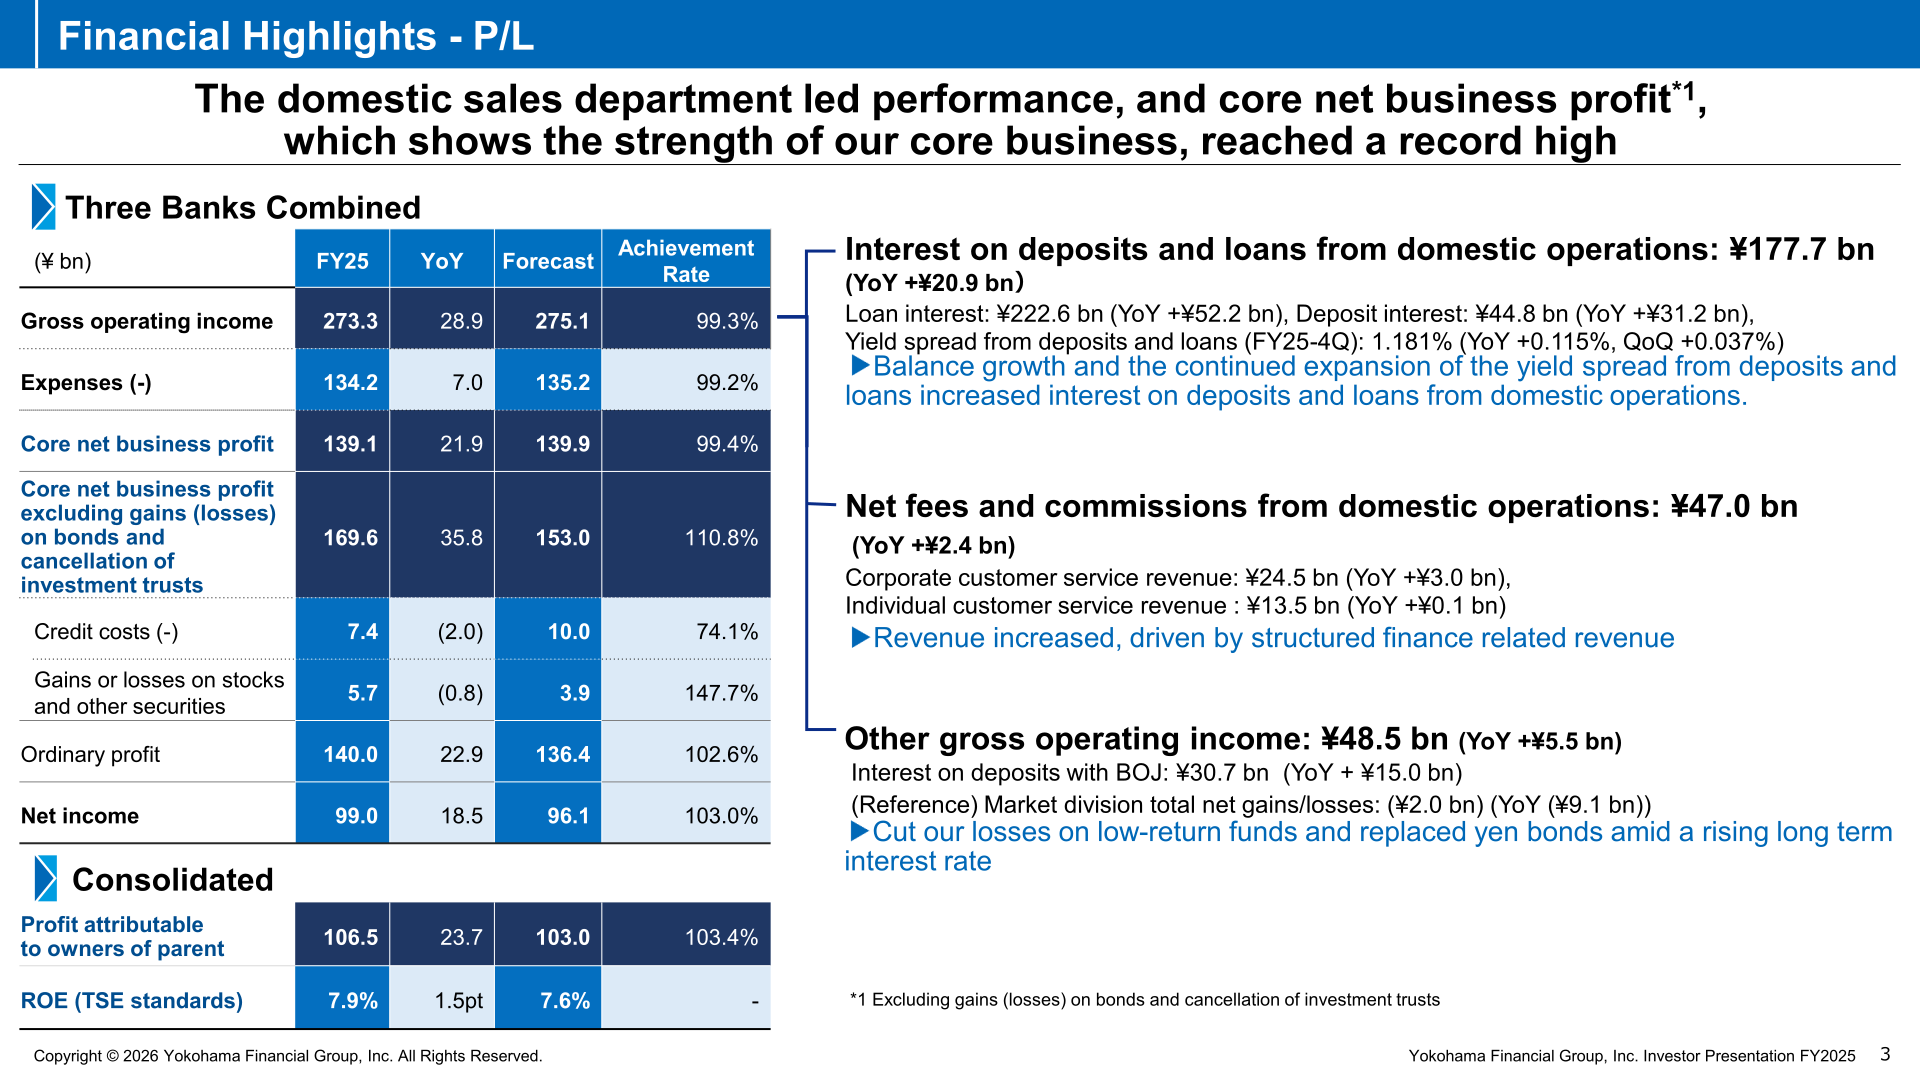
The materials present the profit and loss statement on a “Three Banks Combined” basis (The Bank of Yokohama, The Higashi-Nippon Bank and THE KANAGAWA BANK) alongside consolidated figures. Gross operating income for the three banks combined was ¥273.3 bn (YoY +¥28.9 bn) and expenses were ¥134.2 bn (YoY +¥7.0 bn), bringing OHR down 3.0pt to 49.0%. Ordinary profit for the three banks combined was ¥140.0 bn and net income ¥99.0 bn. On a consolidated basis, ordinary profit was ¥155.0 bn (YoY +¥32.2 bn) and profit attributable to owners of parent ¥106.5 bn (YoY +¥23.7 bn), against a plan of ¥103.0 bn, an achievement rate of 103.4%.
| Item (¥ bn) | FY2025 | YoY | FY2025 Plan | Achievement Rate |
|---|---|---|---|---|
| Gross operating income (Three Banks Combined) | 273.3 | 28.9 | 275.1 | 99.3% |
| Expenses (-) | 134.2 | 7.0 | 135.2 | 99.2% |
| Core net business profit | 139.1 | 21.9 | 139.9 | 99.4% |
| Core net business profit excluding gains (losses) on bonds and cancellation of investment trusts | 169.6 | 35.8 | 153.0 | 110.8% |
| Credit costs (-) | 7.4 | (2.0) | 10.0 | 74.1% |
| Gains or losses on stocks and other securities | 5.7 | (0.8) | 3.9 | 147.7% |
| Ordinary profit (Three Banks Combined) | 140.0 | 22.9 | 136.4 | 102.6% |
| Net income (Three Banks Combined) | 99.0 | 18.5 | 96.1 | 103.0% |
| Ordinary profit (Consolidated) | 155.0 | 32.2 | 151.0 | 102.6% |
| Profit attributable to owners of parent (Consolidated) | 106.5 | 23.7 | 103.0 | 103.4% |
| ROE (TSE standards) | 7.9% | 1.5pt | 7.6% | – |
The main driver was domestic lending income. Interest on deposits and loans from domestic operations was ¥177.7 bn (YoY +¥20.9 bn), with loan interest of ¥222.6 bn (YoY +¥52.2 bn) against deposit interest of ¥44.8 bn (YoY +¥31.2 bn). The yield spread from deposits and loans in FY25-4Q was 1.181% (YoY +0.115%, QoQ +0.037%). For the three banks combined the average loan balance rose ¥589.8 bn to ¥16,466.7 bn at a yield of 1.351% (+0.278pt), while the average deposit balance rose ¥550.4 bn to ¥20,269.2 bn at a yield of 0.221% (+0.153pt). Interest on deposits with the BOJ was ¥30.7 bn (YoY +¥15.0 bn). Net fees and commissions from domestic operations were ¥47.0 bn (YoY +¥2.4 bn), with corporate customer service revenue of ¥24.5 bn (YoY +¥3.0 bn) led by structured finance related revenue and individual customer service revenue of ¥13.5 bn (YoY +¥0.1 bn). Market division total net gains/losses were (¥2.0 bn), a year-on-year swing of (¥9.1 bn), as the group cut its losses on low-return funds and replaced yen bonds amid rising long-term interest rates.
Credit costs stayed low at ¥7.4 bn for the three banks combined, down ¥2.0 bn year on year, with the credit cost ratio at 0.04% (YoY (0.01pt)). The materials note only few new defaults. The balance of non-performing loans disclosed under the Financial Reconstruction Law for the three banks combined was ¥224.5 bn at Mar-26 with an NPL ratio of 1.2%, and the non-performing loan coverage ratio remained high.
Results by Bank
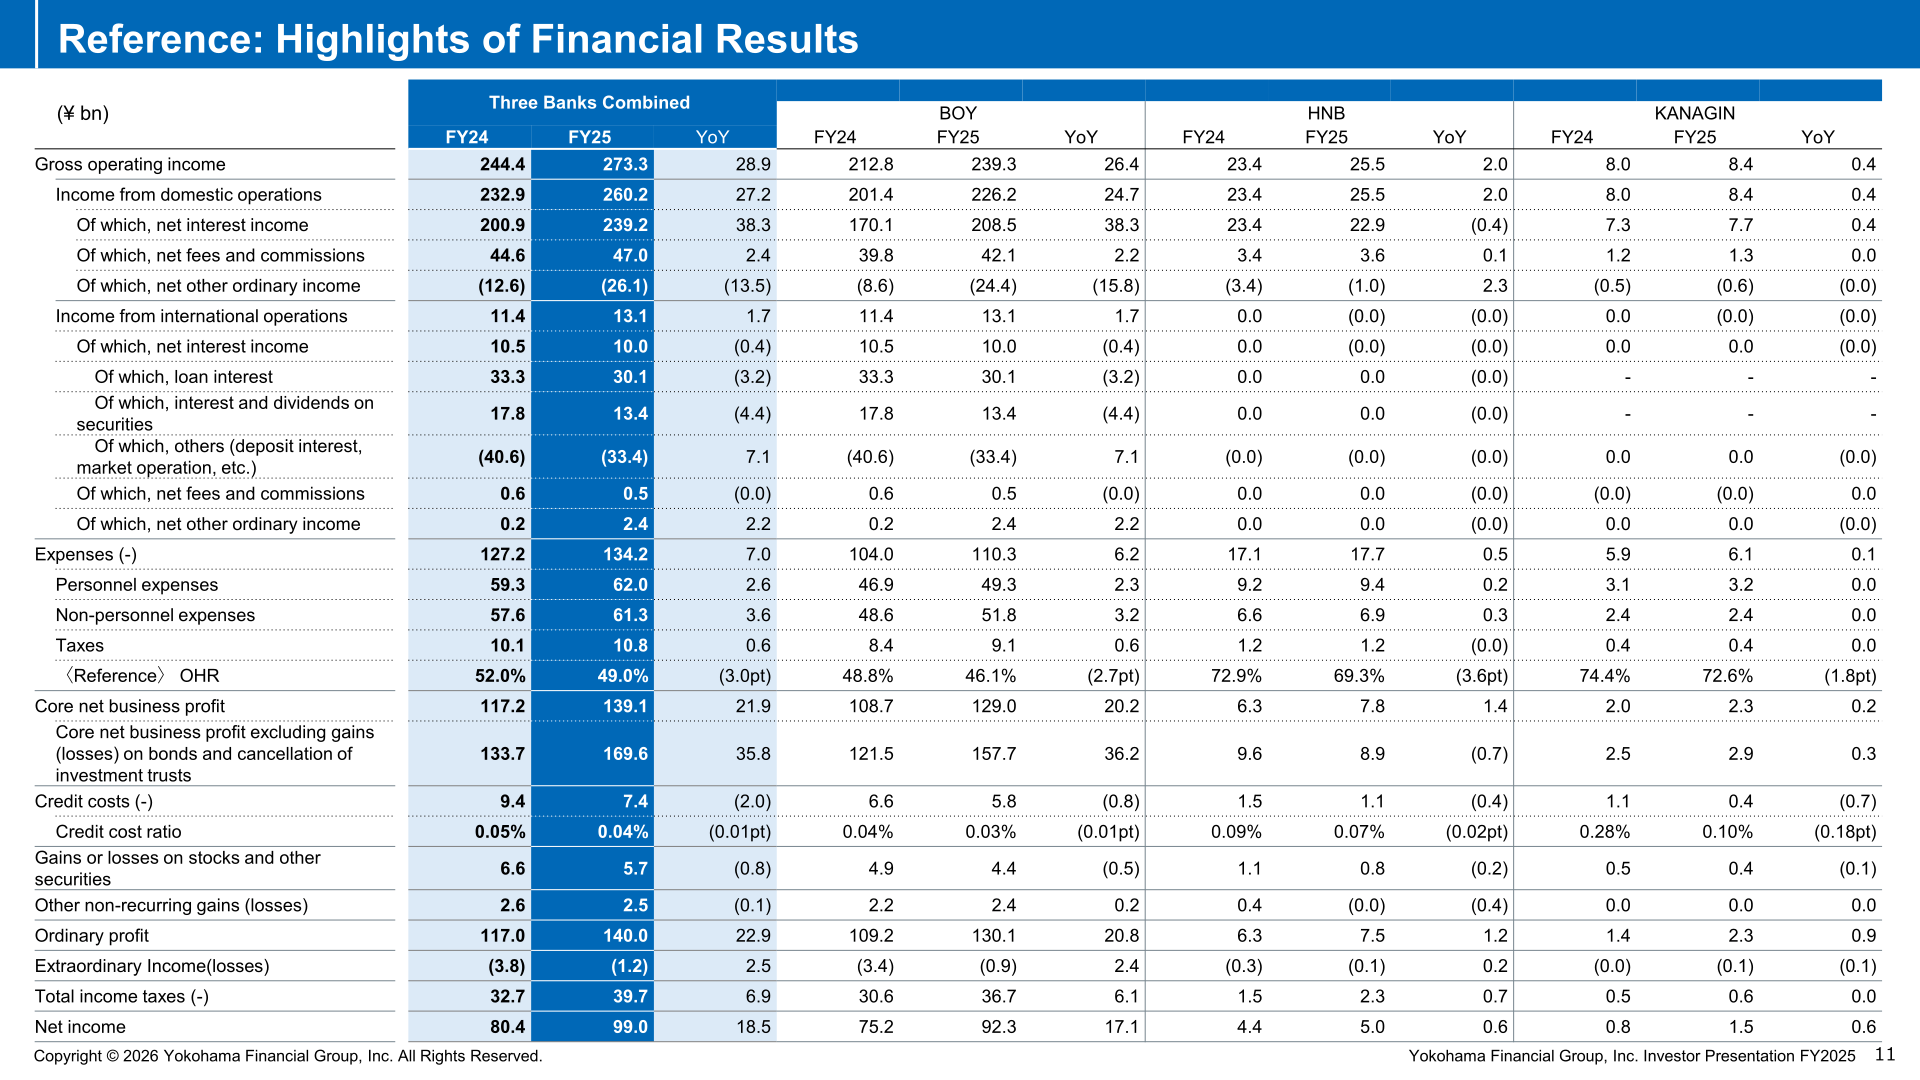
The Bank of Yokohama (BOY) accounted for the bulk of the increase, with gross operating income of ¥239.3 bn (YoY +¥26.4 bn) and net income of ¥92.3 bn (YoY +¥17.1 bn). The Higashi-Nippon Bank (HNB) posted net income of ¥5.0 bn (YoY +¥0.6 bn) and THE KANAGAWA BANK (KANAGIN) ¥1.5 bn (YoY +¥0.6 bn). OHR improved at all three banks.
| Item (¥ bn) | Three Banks Combined | BOY | HNB | KANAGIN |
|---|---|---|---|---|
| Gross operating income | 273.3 | 239.3 | 25.5 | 8.4 |
| Net interest income | 249.3 | 218.5 | 22.9 | 7.7 |
| Net fees and commissions | 47.6 | 42.7 | 3.6 | 1.3 |
| Expenses (-) | 134.2 | 110.3 | 17.7 | 6.1 |
| OHR | 49.0% | 46.1% | 69.3% | 72.6% |
| Core net business profit | 139.1 | 129.0 | 7.8 | 2.3 |
| Core net business profit excluding gains (losses) on bonds and cancellation of investment trusts | 169.6 | 157.7 | 8.9 | 2.9 |
| Credit costs (-) | 7.4 | 5.8 | 1.1 | 0.4 |
| Ordinary profit | 140.0 | 130.1 | 7.5 | 2.3 |
| Net income | 99.0 | 92.3 | 5.0 | 1.5 |
Group Companies
The materials state that the financial results of consolidated subsidiaries remained at the same level as the previous year, excluding intra-group dividends. Subsidiaries excluding L&F Asset Finance recorded gross operating income of ¥32.4 bn (YoY +¥4.4 bn), core net business profit of ¥16.5 bn (YoY +¥3.8 bn) and net income of ¥12.1 bn (YoY +¥3.7 bn). L&F Asset Finance, treated separately, generated gross operating income of ¥18.1 bn and net income of ¥6.8 bn, with income attributable to the group from L&F of ¥4.9 bn based on 85% ownership and after goodwill amortization; its loan balance at Mar-26 was ¥494.1 bn. At Hamagin Tokai Tokyo Securities, the balance of assets in custody exceeded ¥1 trillion at fiscal year-end, supported by record highs in Japan and US equities. On a consolidated basis gross operating income was ¥307.1 bn and core net business profit ¥156.6 bn.
Balance Sheet and Capital
At Mar-26 total assets were ¥25.6 tn, liabilities ¥24.2 tn and net assets ¥1.4 tn. For the three banks combined, deposits were ¥21.0 tn (YoY +¥0.3 tn, +1.7%) and loans ¥17.3 tn (YoY +¥0.7 tn, +4.2%), with corporate loans up 7.6% to ¥9.5 tn and individual loans up 2.1% to ¥7.1 tn. Consolidated loans were ¥17.6 tn (YoY +¥0.9 tn). Securities stood at ¥3.0 tn (YoY +¥0.1 tn), with yen bonds (available-for-sale) at ¥1.1 tn as the group increased yen bonds under interest rate risk control while diversified investment decreased on the cutting of losses on investment trusts.
On a consolidated preliminary basis at Mar-26, total capital was ¥1,343.9 bn, common equity Tier 1 capital ¥1,297.3 bn (¥1,174.0 bn excluding valuation difference on available-for-sale securities) and risk assets ¥8,990.8 bn. On a finalized and fully implemented Basel III basis the common equity Tier 1 ratio excluding valuation differences was approximately 11.4%, down from approximately 11.9% at Mar-25 and moving toward the medium-term management plan target of about 11%; including valuation differences the ratio was approximately 12.6% versus approximately 12.4% a year earlier, with risk assets of approximately ¥10.2 tn.
FY2026 Forecast
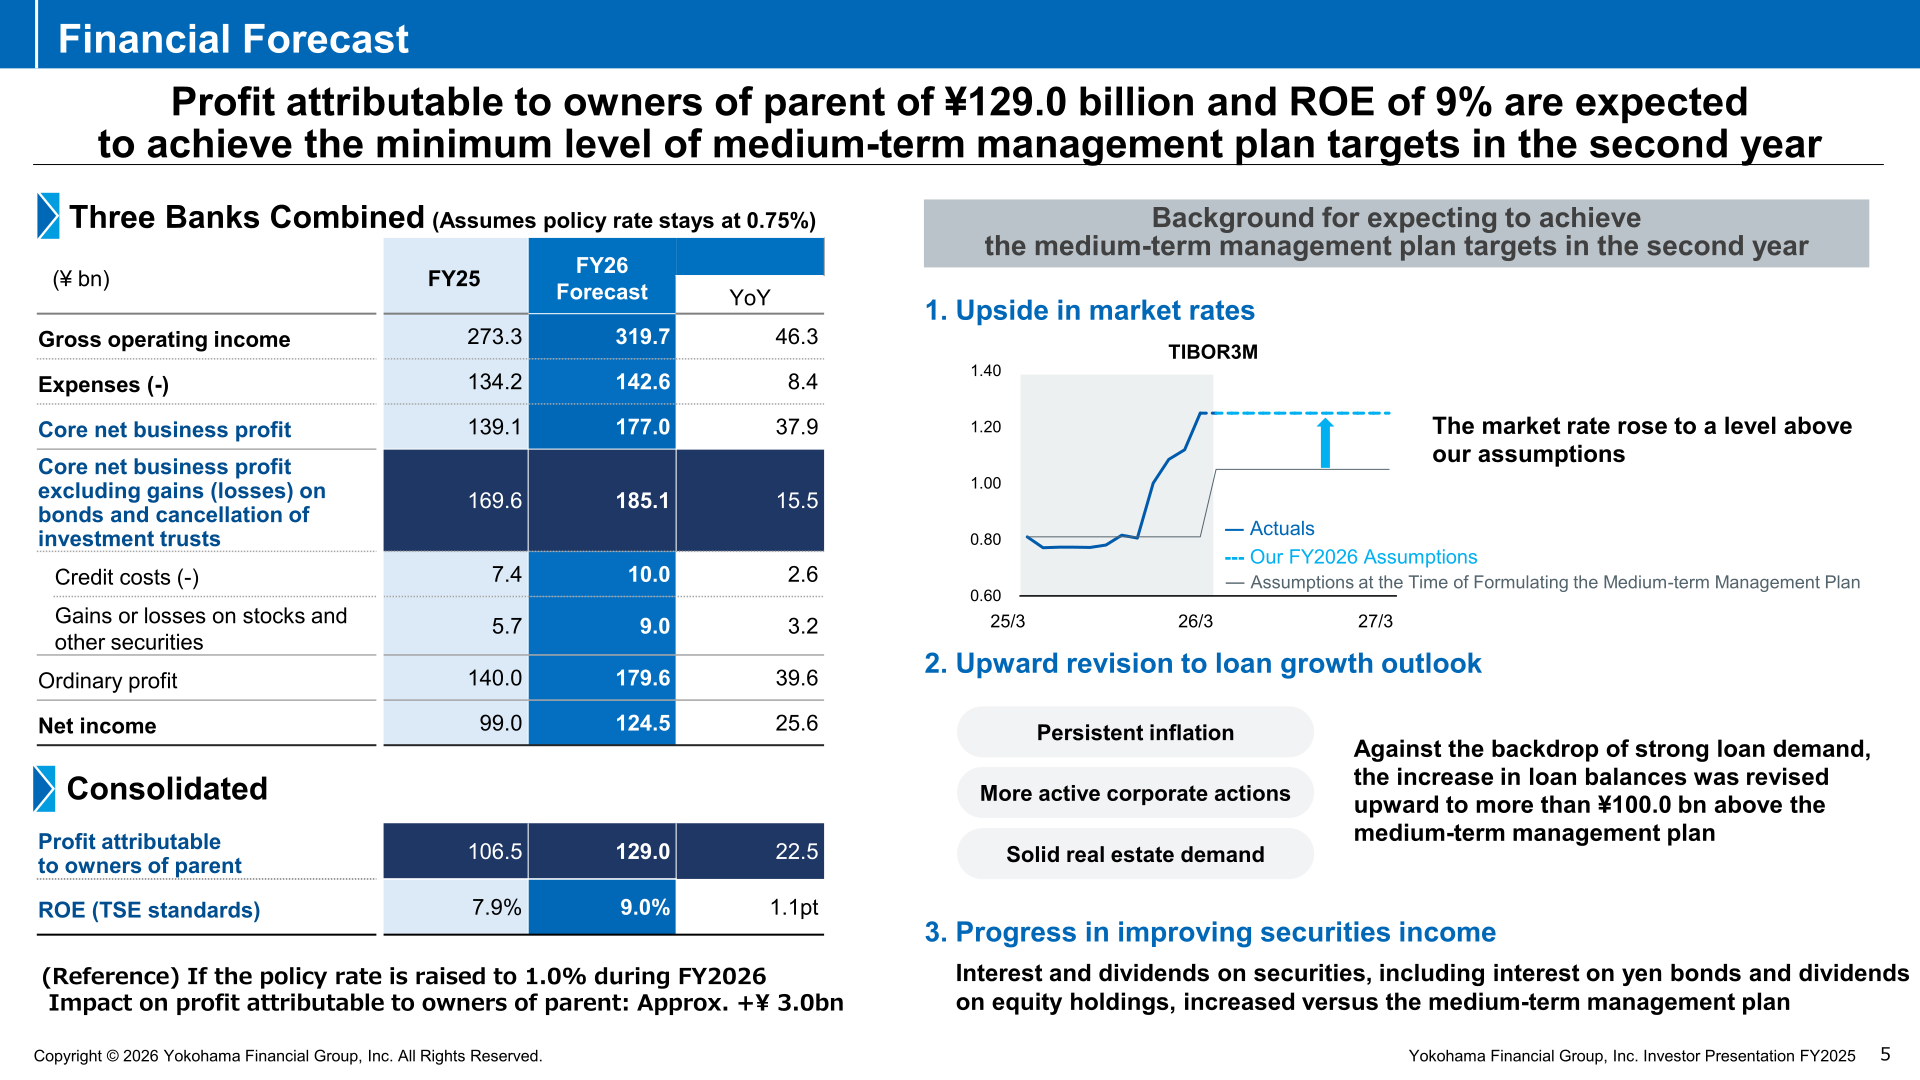
For FY2026 the group forecasts consolidated profit attributable to owners of parent of ¥129.0 bn (YoY +¥22.5 bn) and ROE (TSE standards) of 9.0% (+1.1pt), which the materials state would achieve the minimum level of the medium-term management plan targets in the second year. The plan assumes a policy rate of 0.75% and a 10-year JGB yield of approximately 2.15%, and the company notes that if the policy rate is raised to 1.0% during FY2026 the impact on profit attributable to owners of parent would be approximately +¥3.0 bn. The three reasons cited for the improved outlook are upside in market rates, an upward revision to the loan growth outlook of more than ¥100.0 bn above the medium-term management plan, and progress in improving securities income.
| Item (¥ bn) | FY2025 | FY2026 Forecast | YoY |
|---|---|---|---|
| Gross operating income (Three Banks Combined) | 273.3 | 319.7 | 46.3 |
| Expenses (-) | 134.2 | 142.6 | 8.4 |
| OHR | 49.0% | 44.6% | (4.4pt) |
| Core net business profit | 139.1 | 177.0 | 37.9 |
| Core net business profit excluding gains (losses) on bonds and cancellation of investment trusts | 169.6 | 185.1 | 15.5 |
| Credit costs (-) | 7.4 | 10.0 | 2.6 |
| Gains or losses on stocks and other securities | 5.7 | 9.0 | 3.2 |
| Ordinary profit (Three Banks Combined) | 140.0 | 179.6 | 39.6 |
| Net income (Three Banks Combined) | 99.0 | 124.5 | 25.6 |
| Ordinary profit (Consolidated) | 155.0 | 191.5 | 36.5 |
| Profit attributable to owners of parent (Consolidated) | 106.5 | 129.0 | 22.5 |
| ROE (TSE standards) | 7.9% | 9.0% | 1.1pt |
Shareholder Returns
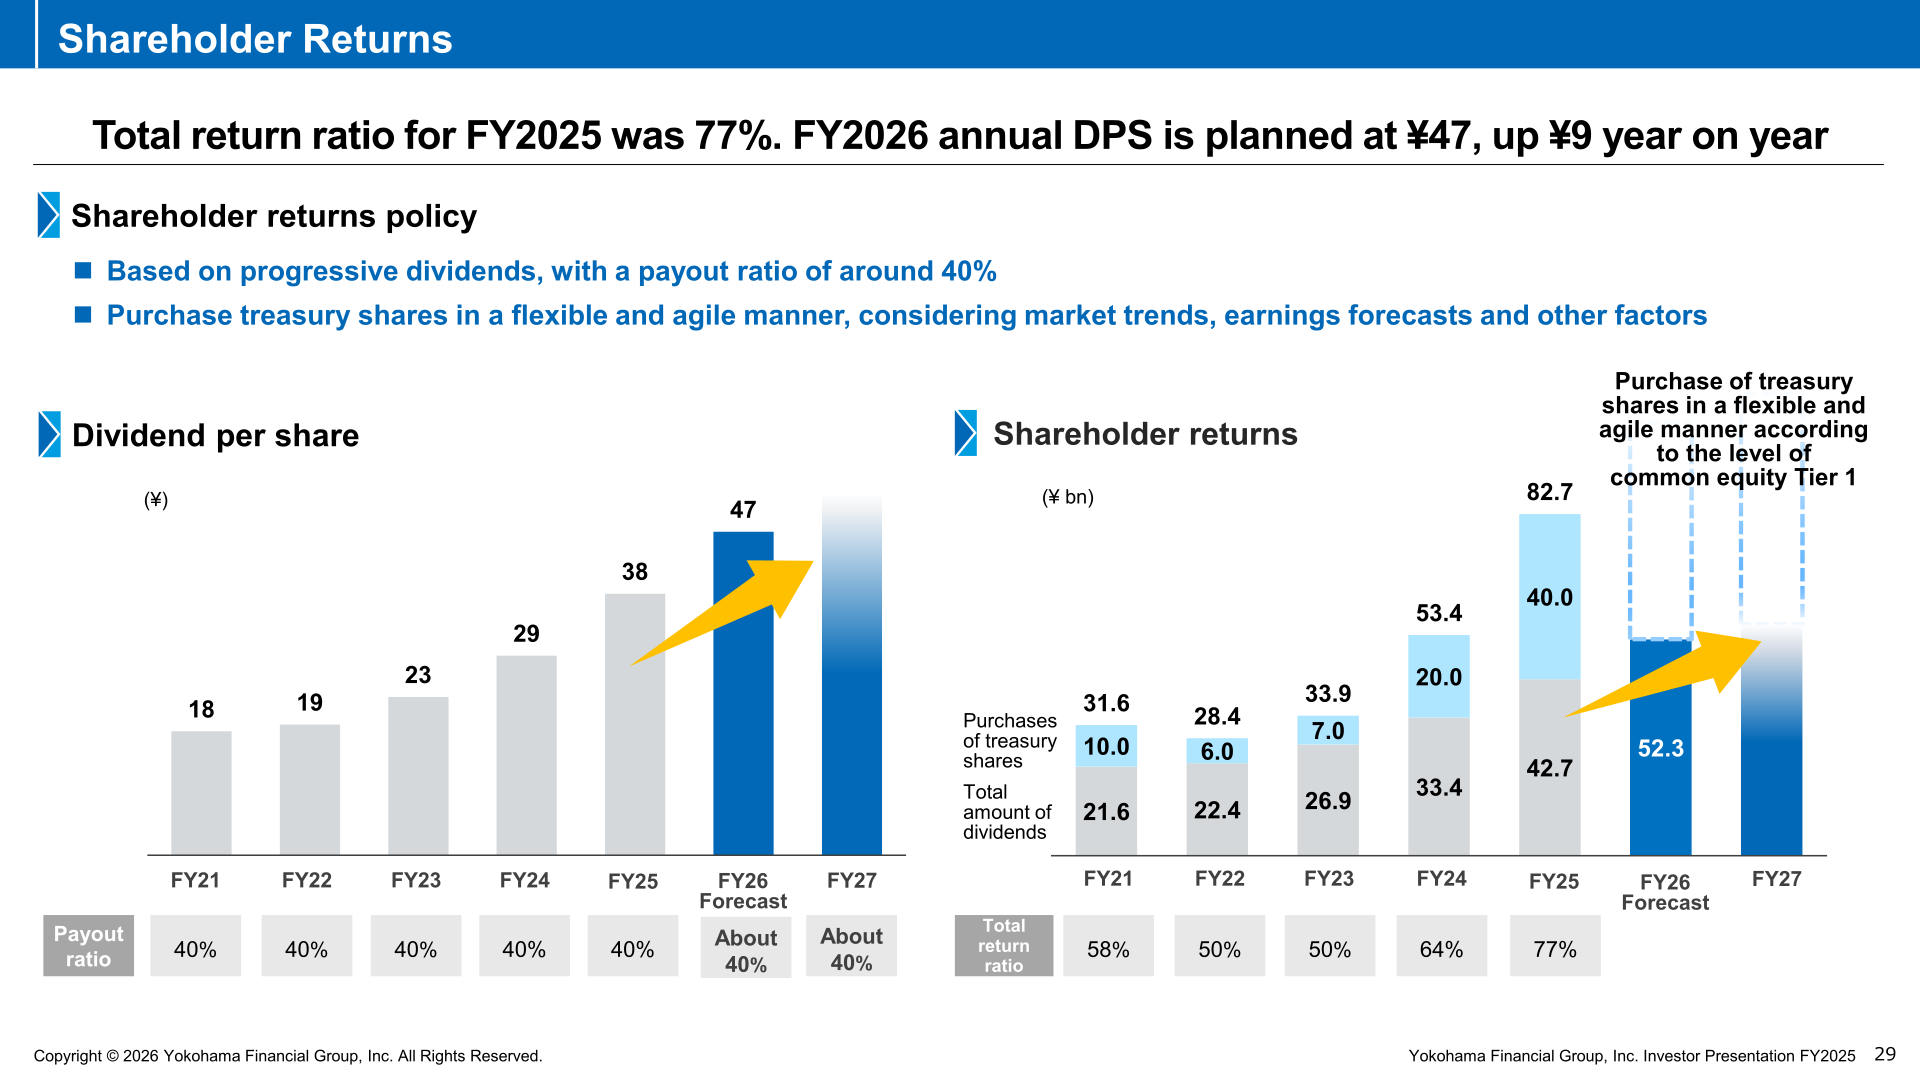
The shareholder returns policy is based on progressive dividends with a payout ratio of around 40%, combined with purchases of treasury shares in a flexible and agile manner according to the level of common equity Tier 1, taking into account market trends and earnings forecasts. The total return ratio for FY2025 was 77%. The FY2026 annual dividend per share is planned at ¥47, up ¥9 year on year.
| Item | FY2024 | FY2025 | FY2026 Forecast |
|---|---|---|---|
| Dividend per share (¥) | 29 | 38 | 47 |
| Total amount of dividends (¥ bn) | 33.4 | 42.7 | 52.3 |
| Purchases of treasury shares (¥ bn) | 20.0 | 40.0 | – |
| Shareholder returns total (¥ bn) | 53.4 | 82.7 | – |
| Payout ratio | 40% | 40% | About 40% |
| Total return ratio | 64% | 77% | – |
Medium-term Management Plan Targets
The medium-term management plan targets for FY2027 are ROE (TSE standards) of over 9.0%, profit attributable to owners of parent of over ¥120.0 bn and a common equity Tier 1 ratio of about 11%, on an interest-rate scenario assuming the Bank of Japan’s policy rate remains at 0.75% from April 2026 onward. Against those targets, FY2024 results were ROE of 6.4% and profit attributable to owners of parent of ¥82.8 bn, FY2025 results were 7.9% and ¥106.5 bn, and the FY2026 plan is 9.0% and ¥129.0 bn. The common equity Tier 1 ratio was approximately 11.9% for FY2024 (approximately 11.6% after reflecting the impact of consolidating L&F Asset Finance as a subsidiary) and approximately 11.4% for FY2025.
This article is an analysis based on publicly available information and is not a recommendation to buy or sell any specific securities. Investment decisions are your own responsibility.
![[Obayashi] Investors’ Guide 2026 — The Complete 24-Article Breakdown](https://japan-equity.com/wp-content/uploads/2026/07/hub_cover-1024x1024.png)
![[Obayashi] IR & SR Policy — Feeding Dialogue Back into Management](https://japan-equity.com/wp-content/uploads/2026/07/p32_sq-1024x1024.jpg)
![[Obayashi] Real Estate Development — 18.7% Margin, ¥287.7bn Unrealized Gains](https://japan-equity.com/wp-content/uploads/2026/07/p20_sq-1024x1024.jpg)
![[Obayashi] Domestic Civil Engineering — Resilience Spending Supports 9.6% Margin](https://japan-equity.com/wp-content/uploads/2026/07/p11_sq-1024x1024.jpg)
![[Obayashi] Share Price & External Ratings — vs TOPIX, ESG Index Inclusion](https://japan-equity.com/wp-content/uploads/2026/07/p40_sq-1024x1024.jpg)
![[Construction] ¥75.5tn Investment, Shrinking Workforce — Big-5 Market Share](https://japan-equity.com/wp-content/uploads/2026/07/p12_sq-1024x1024.jpg)



![[Obayashi] Capital Policy & Shareholder Returns — ROE 10%+, DOE ~5%, ¥100bn Buyback](https://japan-equity.com/wp-content/uploads/2026/07/p27_sq-1024x1024.jpg)
![[Obayashi] Reducing Cross-Shareholdings — ¥285.2bn Sold in Five Years](https://japan-equity.com/wp-content/uploads/2026/07/p29_sq-1024x1024.jpg)
![[Obayashi] ¥750bn Investment Plan — ¥300bn to Development, ¥190bn to Tech/DX](https://japan-equity.com/wp-content/uploads/2026/07/p30_sq-1024x1024.jpg)
![[Obayashi] MTP2022 KPIs — Operating Profit ~2x Target, ROE 14.4%](https://japan-equity.com/wp-content/uploads/2026/07/p25_sq-1024x1024.jpg)
![[Obayashi] Cash Allocation — ¥420bn Investment CF Over Five Years](https://japan-equity.com/wp-content/uploads/2026/07/p26_sq-1024x1024.jpg)
![[Obayashi] Green Energy — 44 Plants, 344MW, and the Green Hydrogen Challenge](https://japan-equity.com/wp-content/uploads/2026/07/p21_sq-1024x1024.jpg)
![[Obayashi] Tackling the Labor Shortage — Robotics Construction®](https://japan-equity.com/wp-content/uploads/2026/07/p14_sq-1024x1024.jpg)
