
This article is based on publicly available IR materials and is not a recommendation to buy or sell any specific securities.
Note: Namura Shipbuilding does not publish an English results presentation; this article is an English translation of the Japanese-language article on our sister site Investalk, which is based on the company’s Japanese-language IR materials, with figures transcribed as reported. In line with this site’s fiscal-year naming convention, “FY2025” in the title refers to the company’s most recently completed fiscal year; the source materials label this period as the fiscal year ended March 2026, and the body and tables below follow the source labels.
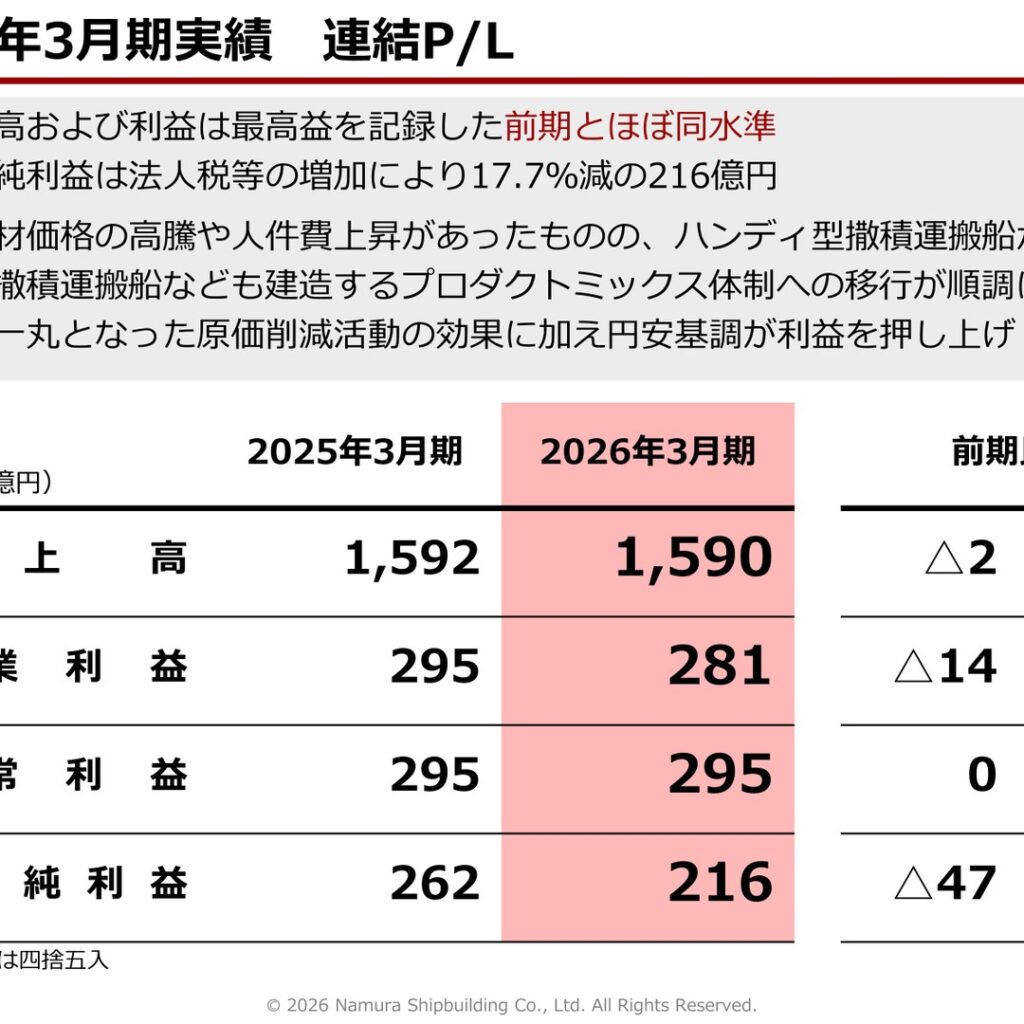
Namura Shipbuilding released its financial results presentation for the fiscal year ended March 2026 (published in June 2026). Consolidated net sales were ¥159.0 billion (down 0.1% year on year), operating profit was ¥28.1 billion (down 4.7%), and ordinary profit was ¥29.5 billion (up 0.1%). In the previous fiscal year (ended March 2025) the company recorded its highest-ever sales and profits, and results for the fiscal year ended March 2026 were at roughly the same level. Net income was ¥21.6 billion (down 17.7%) due to an increase in income taxes. Despite soaring prices of materials and equipment and rising labor costs, the company states that the transition to a product-mix construction structure — building large bulk carriers and other vessels in addition to Handy-size bulk carriers — progressed smoothly, and that the effects of company-wide cost-reduction activities, together with the yen’s continued depreciation, pushed up profits.
Consolidated Results (Fiscal Year Ended March 2026)
The average exchange rate applied to sales for the fiscal year ended March 2026 was ¥151.80 per U.S. dollar, a further yen depreciation of ¥1.80 versus the same period of the previous year. The rate at the fiscal year-end was ¥159.88 per U.S. dollar (a depreciation of ¥10.36 from the previous fiscal year-end). Total assets were ¥266.1 billion (up ¥57.1 billion from the previous fiscal year-end), the equity ratio was 51.3% (up 1.3 percentage points), and the interest-bearing debt ratio was 15.4% (down 1.6 percentage points).
| Item | FYE March 2026 (Current) | FYE March 2025 (Previous) | Change | % Change |
|---|---|---|---|---|
| Net sales | ¥159.0 billion | ¥159.2 billion | △¥0.2 billion | △0.1% |
| Operating profit | ¥28.1 billion | ¥29.5 billion | △¥1.4 billion | △4.7% |
| Ordinary profit | ¥29.5 billion | ¥29.5 billion | ¥0.0 billion | 0.1% |
| Net income | ¥21.6 billion | ¥26.2 billion | △¥4.7 billion | △17.7% |
Segment Results
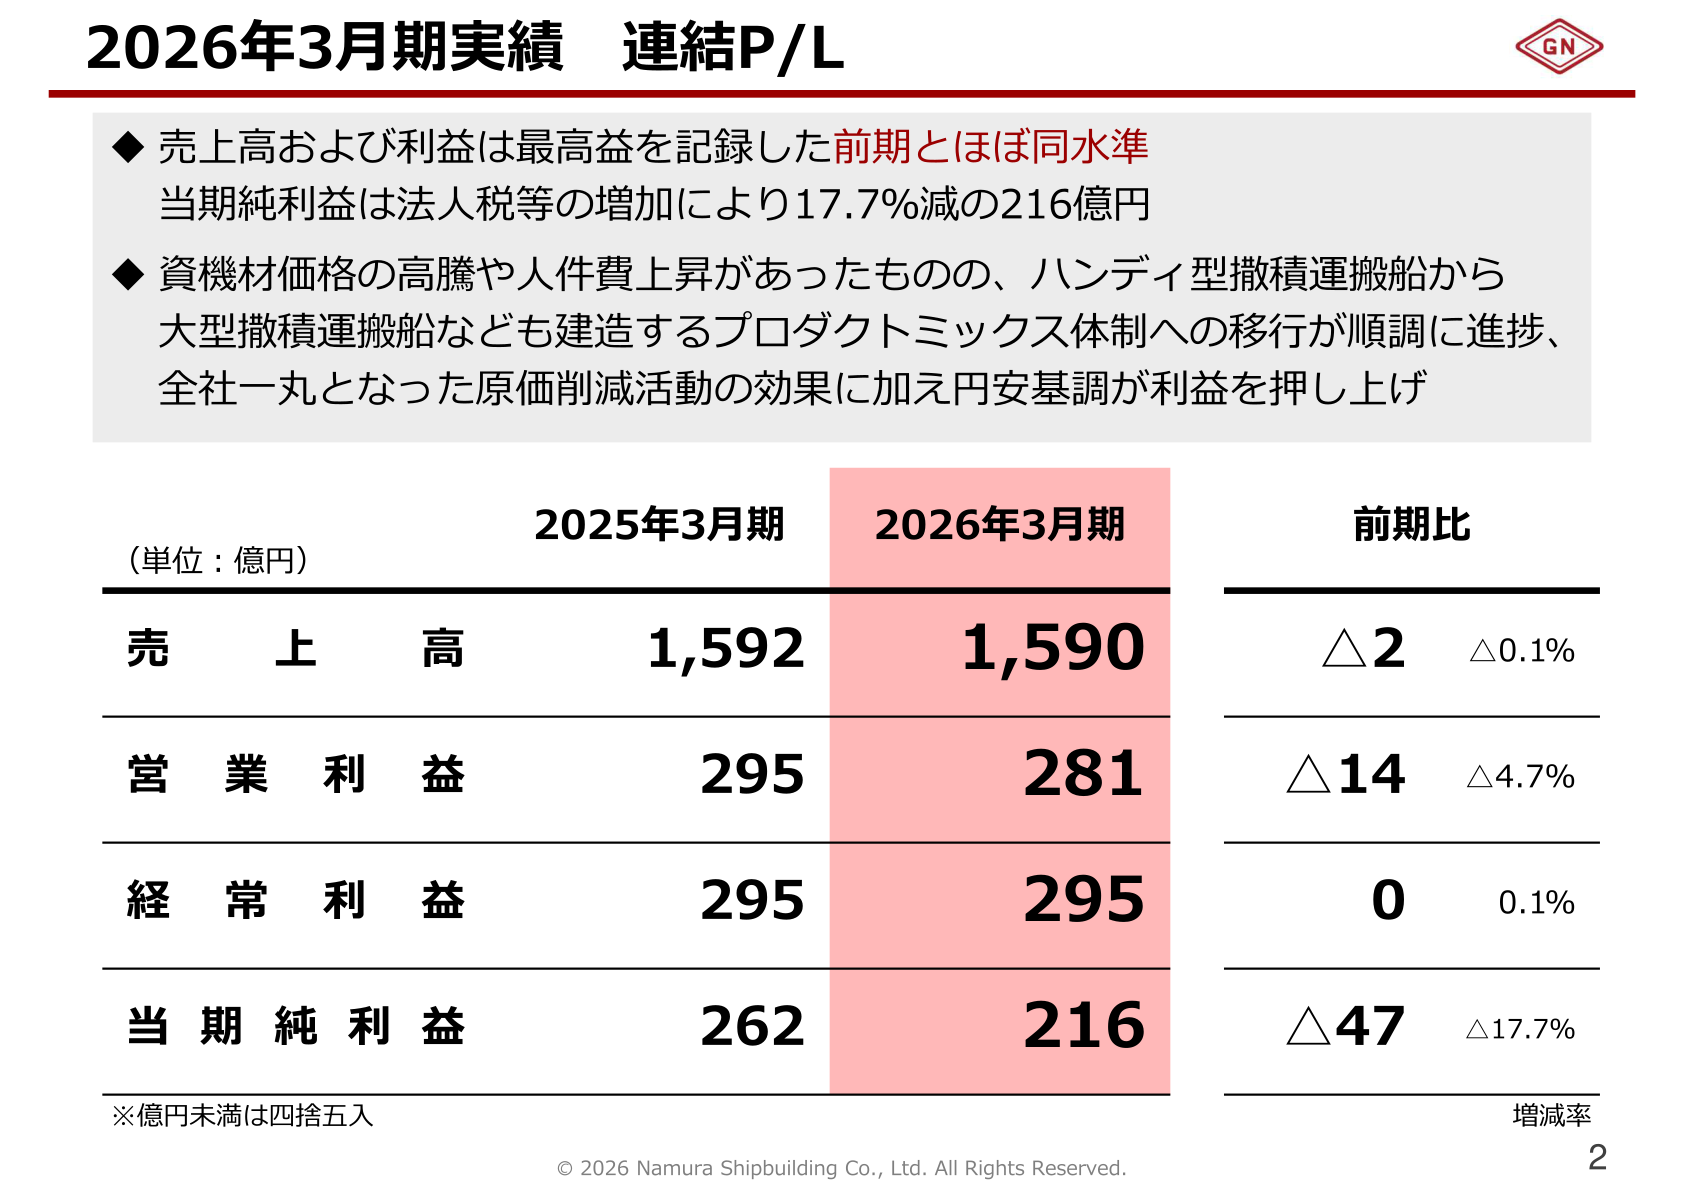
In the new shipbuilding segment, sales and profit both increased, driven by smooth progress in the transition to a product-mix construction structure covering Handy-size bulk carriers and large bulk carriers, as well as the yen’s depreciation. In the ship repair segment, sales and profit both decreased as the volume of work on domestic naval vessels, the segment’s mainstay, declined substantially from the previous year. The consolidated order backlog was ¥422.1 billion in the new shipbuilding segment (up 7.1% from the previous year; the company received orders for 10 large bulk carriers and 5 Handy-size bulk carriers, securing a backlog of more than three years), ¥10.2 billion in the ship repair segment (up 92.1%), and ¥8.0 billion in the steel structure & machinery segment (up 48.1%). Hakodate Dock’s consolidated P/L showed net sales of ¥33.7 billion (down 5.5% year on year) and operating profit of ¥4.7 billion (down 26.5%), while Sasebo Heavy Industries’ consolidated P/L showed net sales of ¥16.0 billion (up 6.4% year on year) and operating profit of ¥1.1 billion (down 52.3%).
| Segment | Metric | FYE March 2026 (Current) | FYE March 2025 (Previous) |
|---|---|---|---|
| New shipbuilding | Net sales | ¥125.6 billion | ¥122.9 billion |
| New shipbuilding | Operating profit | ¥28.6 billion | ¥27.6 billion |
| Ship repair | Net sales | ¥20.5 billion | ¥23.0 billion |
| Ship repair | Operating profit | ¥1.6 billion | ¥3.6 billion |
| Steel structure & machinery | Net sales | ¥6.3 billion | ¥6.2 billion |
| Steel structure & machinery | Operating profit | ¥0.3 billion | ¥0.1 billion |
| Other | Net sales | ¥6.6 billion | ¥7.1 billion |
| Other | Operating profit | ¥0.9 billion | ¥0.8 billion |
| Eliminations or corporate | Operating profit | △¥3.3 billion | △¥2.7 billion |
| Total | Net sales | ¥159.0 billion | ¥159.2 billion |
| Total | Operating profit | ¥28.1 billion | ¥29.5 billion |
Full-Year Forecast
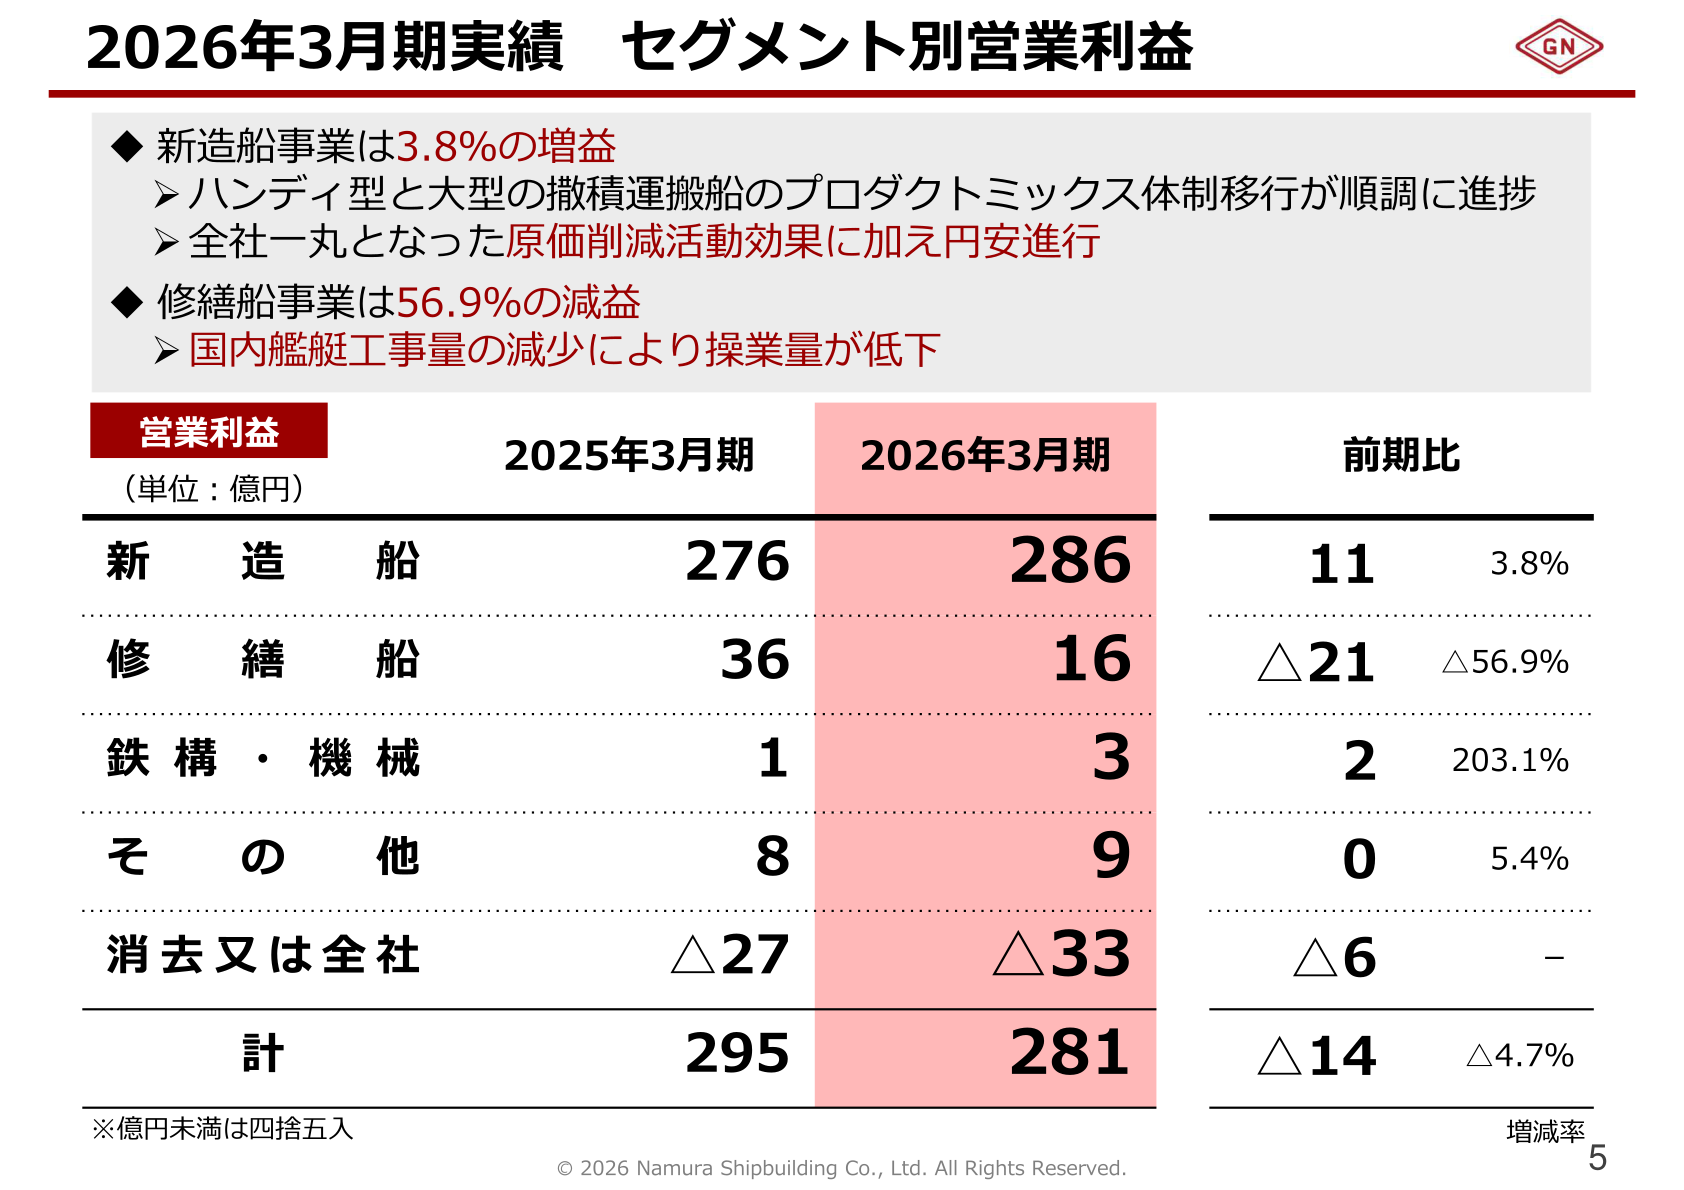
The fiscal year ending March 2027 will be a period of transition from serial construction of Handy-size bulk carriers to a product-mix construction structure centered on serial construction of large bulk carriers combined with high-value-added large LPG carriers, and the company forecasts higher sales. On profit, the company expects the same level as the current fiscal year, factoring in inflation, higher labor costs, and the tax burden. Unhedged foreign currency subject to planned sales recognition amounts to US$670 million, with an assumed exchange rate of ¥155 per U.S. dollar. Hakodate Dock states that it will work as one company to advance productivity improvement and management efficiency, strengthening its business foundation through improved profitability and active capital investment. Sasebo Heavy Industries states that it aims for sustained growth in sales and profit through continuous workforce expansion, capital investment, and active sales development.
| Entity | Item | FYE March 2027 (Forecast) | FYE March 2026 (Actual) |
|---|---|---|---|
| Consolidated | Net sales | ¥170.0 billion | ¥159.0 billion |
| Consolidated | Operating profit | ¥29.0 billion | ¥28.1 billion |
| Consolidated | Ordinary profit | ¥30.0 billion | ¥29.5 billion |
| Consolidated | Net income | ¥22.0 billion | ¥21.6 billion |
| Hakodate Dock | Net sales | ¥34.9 billion | ¥33.7 billion |
| Hakodate Dock | Operating profit | ¥4.8 billion | ¥4.7 billion |
| Hakodate Dock | Ordinary profit | ¥4.5 billion | ¥4.8 billion |
| Hakodate Dock | Net income | ¥2.9 billion | ¥3.3 billion |
| Sasebo Heavy Industries | Net sales | ¥18.8 billion | ¥16.0 billion |
| Sasebo Heavy Industries | Operating profit | ¥1.4 billion | ¥1.1 billion |
| Sasebo Heavy Industries | Ordinary profit | ¥1.5 billion | ¥1.4 billion |
| Sasebo Heavy Industries | Net income | ¥1.5 billion | ¥1.5 billion |
Shareholder Returns
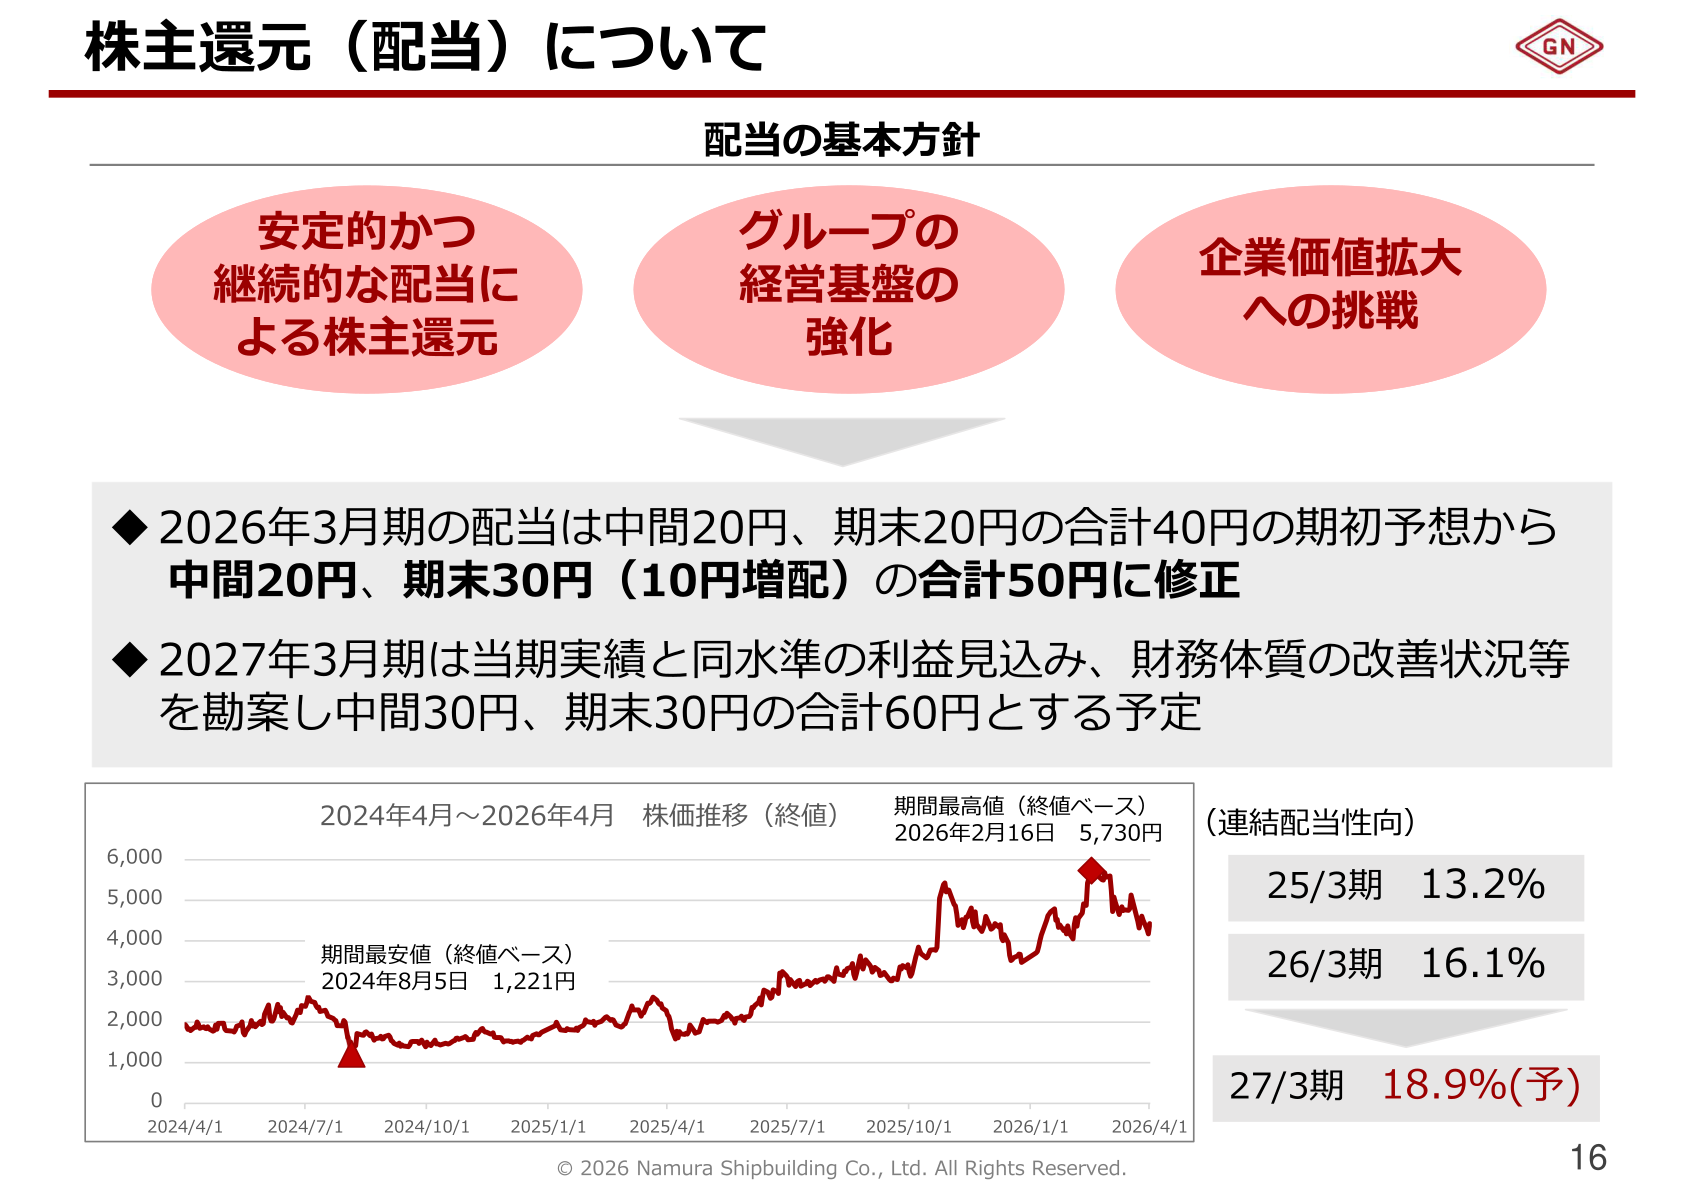
The company’s basic dividend policy consists of taking on the challenge of expanding corporate value, strengthening the group’s management foundation, and returning profits to shareholders through stable and continuous dividends. The dividend for the fiscal year ended March 2026 was revised from the initial forecast of ¥40 for the year (interim ¥20 and year-end ¥20) to ¥50 (interim ¥20 and year-end ¥30, a ¥10 increase). For the fiscal year ending March 2027, the company plans a total annual dividend of ¥60 (interim ¥30 and year-end ¥30), taking into account the profit outlook at the same level as the current year’s results and the state of improvement in its financial position. The consolidated payout ratio was 13.2% for the fiscal year ended March 2025 and 16.1% for the fiscal year ended March 2026, and is 18.9% (forecast) for the fiscal year ending March 2027.
| Item | FYE March 2025 | FYE March 2026 | FYE March 2027 (Forecast) |
|---|---|---|---|
| Interim dividend | - | ¥20 | ¥30 |
| Year-end dividend | - | ¥30 | ¥30 |
| Annual dividend (total) | - | ¥50 | ¥60 |
| Consolidated payout ratio | 13.2% | 16.1% | 18.9% |
This article is an analysis based on publicly available information and is not a recommendation to buy or sell any specific securities. Investment decisions are your own responsibility.
![[Obayashi] Investors’ Guide 2026 — The Complete 24-Article Breakdown](https://japan-equity.com/wp-content/uploads/2026/07/hub_cover-1024x1024.png)
![[Obayashi] IR & SR Policy — Feeding Dialogue Back into Management](https://japan-equity.com/wp-content/uploads/2026/07/p32_sq-1024x1024.jpg)
![[Obayashi] Real Estate Development — 18.7% Margin, ¥287.7bn Unrealized Gains](https://japan-equity.com/wp-content/uploads/2026/07/p20_sq-1024x1024.jpg)
![[Obayashi] Domestic Civil Engineering — Resilience Spending Supports 9.6% Margin](https://japan-equity.com/wp-content/uploads/2026/07/p11_sq-1024x1024.jpg)
![[Obayashi] Share Price & External Ratings — vs TOPIX, ESG Index Inclusion](https://japan-equity.com/wp-content/uploads/2026/07/p40_sq-1024x1024.jpg)
![[Construction] ¥75.5tn Investment, Shrinking Workforce — Big-5 Market Share](https://japan-equity.com/wp-content/uploads/2026/07/p12_sq-1024x1024.jpg)



![[Obayashi] Capital Policy & Shareholder Returns — ROE 10%+, DOE ~5%, ¥100bn Buyback](https://japan-equity.com/wp-content/uploads/2026/07/p27_sq-1024x1024.jpg)
![[Obayashi] Reducing Cross-Shareholdings — ¥285.2bn Sold in Five Years](https://japan-equity.com/wp-content/uploads/2026/07/p29_sq-1024x1024.jpg)
![[Obayashi] ¥750bn Investment Plan — ¥300bn to Development, ¥190bn to Tech/DX](https://japan-equity.com/wp-content/uploads/2026/07/p30_sq-1024x1024.jpg)
![[Obayashi] MTP2022 KPIs — Operating Profit ~2x Target, ROE 14.4%](https://japan-equity.com/wp-content/uploads/2026/07/p25_sq-1024x1024.jpg)
![[Obayashi] Cash Allocation — ¥420bn Investment CF Over Five Years](https://japan-equity.com/wp-content/uploads/2026/07/p26_sq-1024x1024.jpg)
![[Obayashi] Green Energy — 44 Plants, 344MW, and the Green Hydrogen Challenge](https://japan-equity.com/wp-content/uploads/2026/07/p21_sq-1024x1024.jpg)
![[Obayashi] Tackling the Labor Shortage — Robotics Construction®](https://japan-equity.com/wp-content/uploads/2026/07/p14_sq-1024x1024.jpg)
