
This article is based on publicly available IR materials and is not a recommendation to buy or sell any specific securities.
Teikoku Tsushin Kogyo Co., Ltd. (Securities code: 6763), an electronic components manufacturer listed on the Prime Market of the Tokyo Stock Exchange, released its consolidated financial highlights for the fiscal year ended March 2026 on May 12, 2026. Net sales came to ¥17,256 million (102.8% of the prior year), while operating profit was ¥1,158 million (69.6% of the prior year) and profit attributable to owners of parent was ¥1,273 million (63.4%). The annual dividend was ¥100.0 per share, and for FY2027/3 the company forecasts net sales of ¥18,000 million, operating profit of ¥1,500 million, and an annual dividend of ¥125.0 per share. Note: the company’s materials label the fiscal year ended March 2026 as “FY2026/3” and the prior year as “FY2025/3”; tables and figures in this article follow the labels used in the materials.
Consolidated Results (Full-Year Actual)
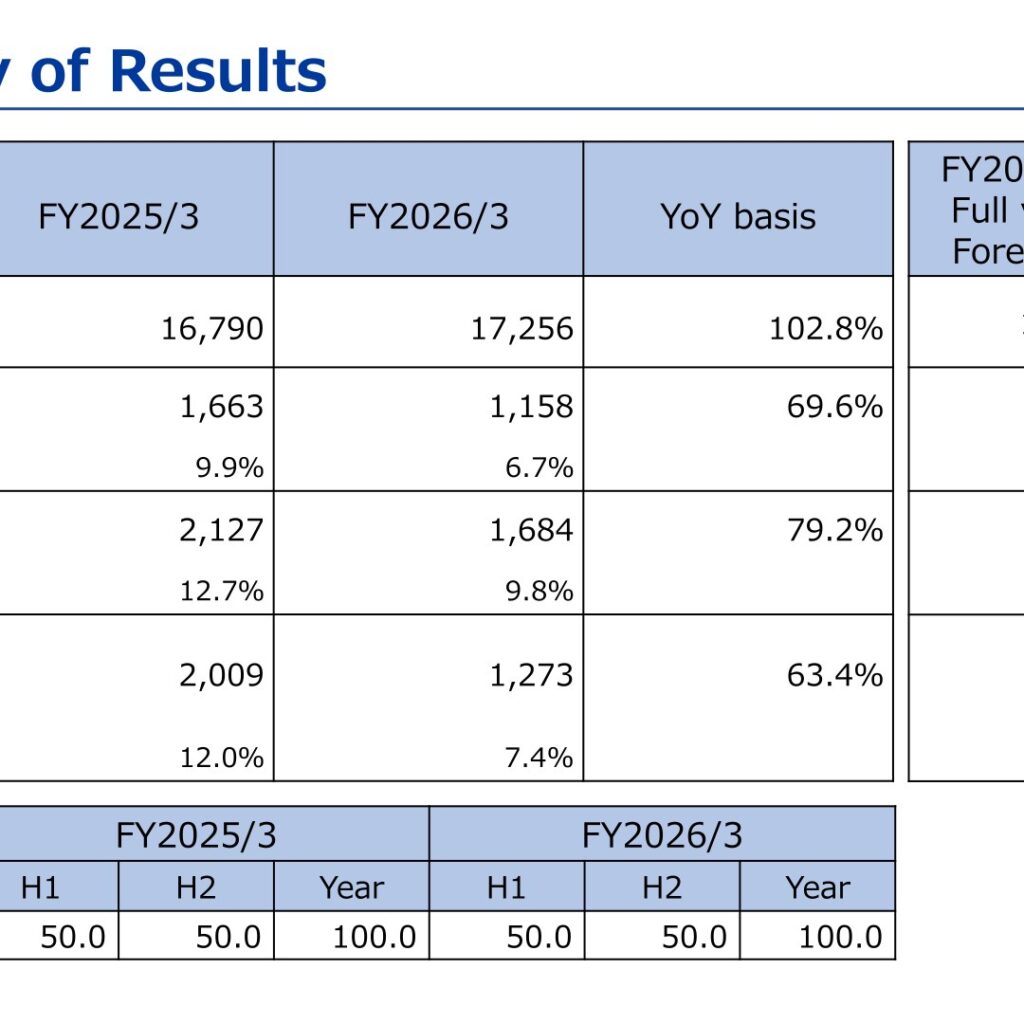
For FY2026/3, net sales increased to ¥17,256 million (102.8% year on year), but profits declined at every level: operating profit was ¥1,158 million (69.6%), ordinary profit was ¥1,684 million (79.2%), and profit attributable to owners of parent was ¥1,273 million (63.4%). The operating margin was 6.7% of net sales, down from 9.9% in FY2025/3. Against the full-year forecast of ¥17,000 million in net sales and ¥1,300 million in operating profit, the progression rate was 101.5% for net sales and 89.1% for operating profit.
| Item (millions of yen) | FY2025/3 | FY2026/3 | YoY basis |
|---|---|---|---|
| Net sales | 16,790 | 17,256 | 102.8% |
| Operating profit | 1,663 | 1,158 | 69.6% |
| % of net sales | 9.9% | 6.7% | |
| Ordinary profit | 2,127 | 1,684 | 79.2% |
| % of net sales | 12.7% | 9.8% | |
| Profit attributable to owners of parent | 2,009 | 1,273 | 63.4% |
| % of net sales | 12.0% | 7.4% |
Sales Breakdown and Segment Results
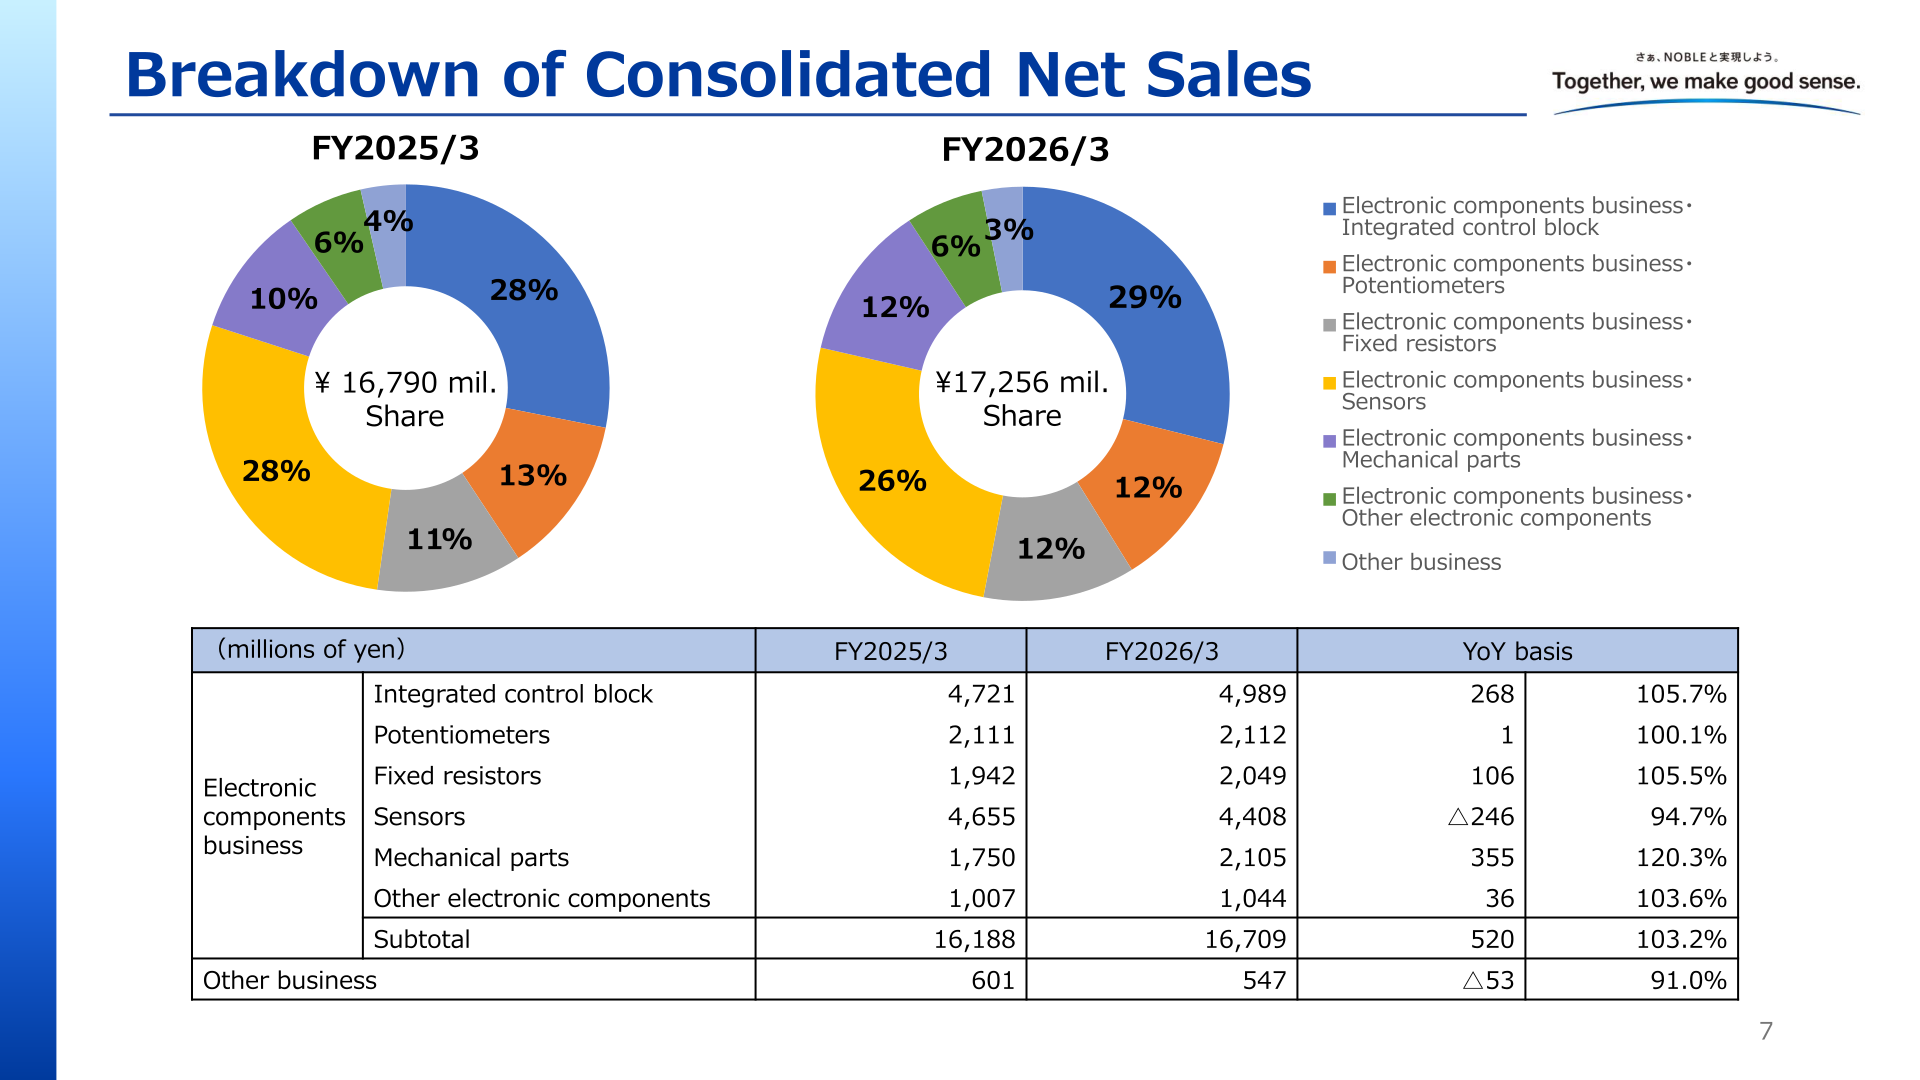
Within the electronic components business, sales of the integrated control block rose to ¥4,989 million (105.7%), mechanical parts grew to ¥2,105 million (120.3%), and fixed resistors increased to ¥2,049 million (105.5%), while sensors declined to ¥4,408 million (94.7%). The electronic components business subtotal was ¥16,709 million (103.2%) and the other business was ¥547 million (91.0%).
| Category (millions of yen) | FY2025/3 | FY2026/3 | Change | YoY basis |
|---|---|---|---|---|
| Integrated control block | 4,721 | 4,989 | 268 | 105.7% |
| Potentiometers | 2,111 | 2,112 | 1 | 100.1% |
| Fixed resistors | 1,942 | 2,049 | 106 | 105.5% |
| Sensors | 4,655 | 4,408 | △246 | 94.7% |
| Mechanical parts | 1,750 | 2,105 | 355 | 120.3% |
| Other electronic components | 1,007 | 1,044 | 36 | 103.6% |
| Electronic components subtotal | 16,188 | 16,709 | 520 | 103.2% |
| Other business | 601 | 547 | △53 | 91.0% |
By market category, electronic components business net sales of ¥16,709 million in FY2026/3 consisted of AV equipment ¥3,946 million (23%), automobile ¥3,393 million (20%), consumer electronics ¥2,301 million (14%), amusement ¥2,828 million (17%), industrial equipment ¥945 million (6%), medical/healthcare ¥642 million (4%), and other ¥2,651 million (16%).
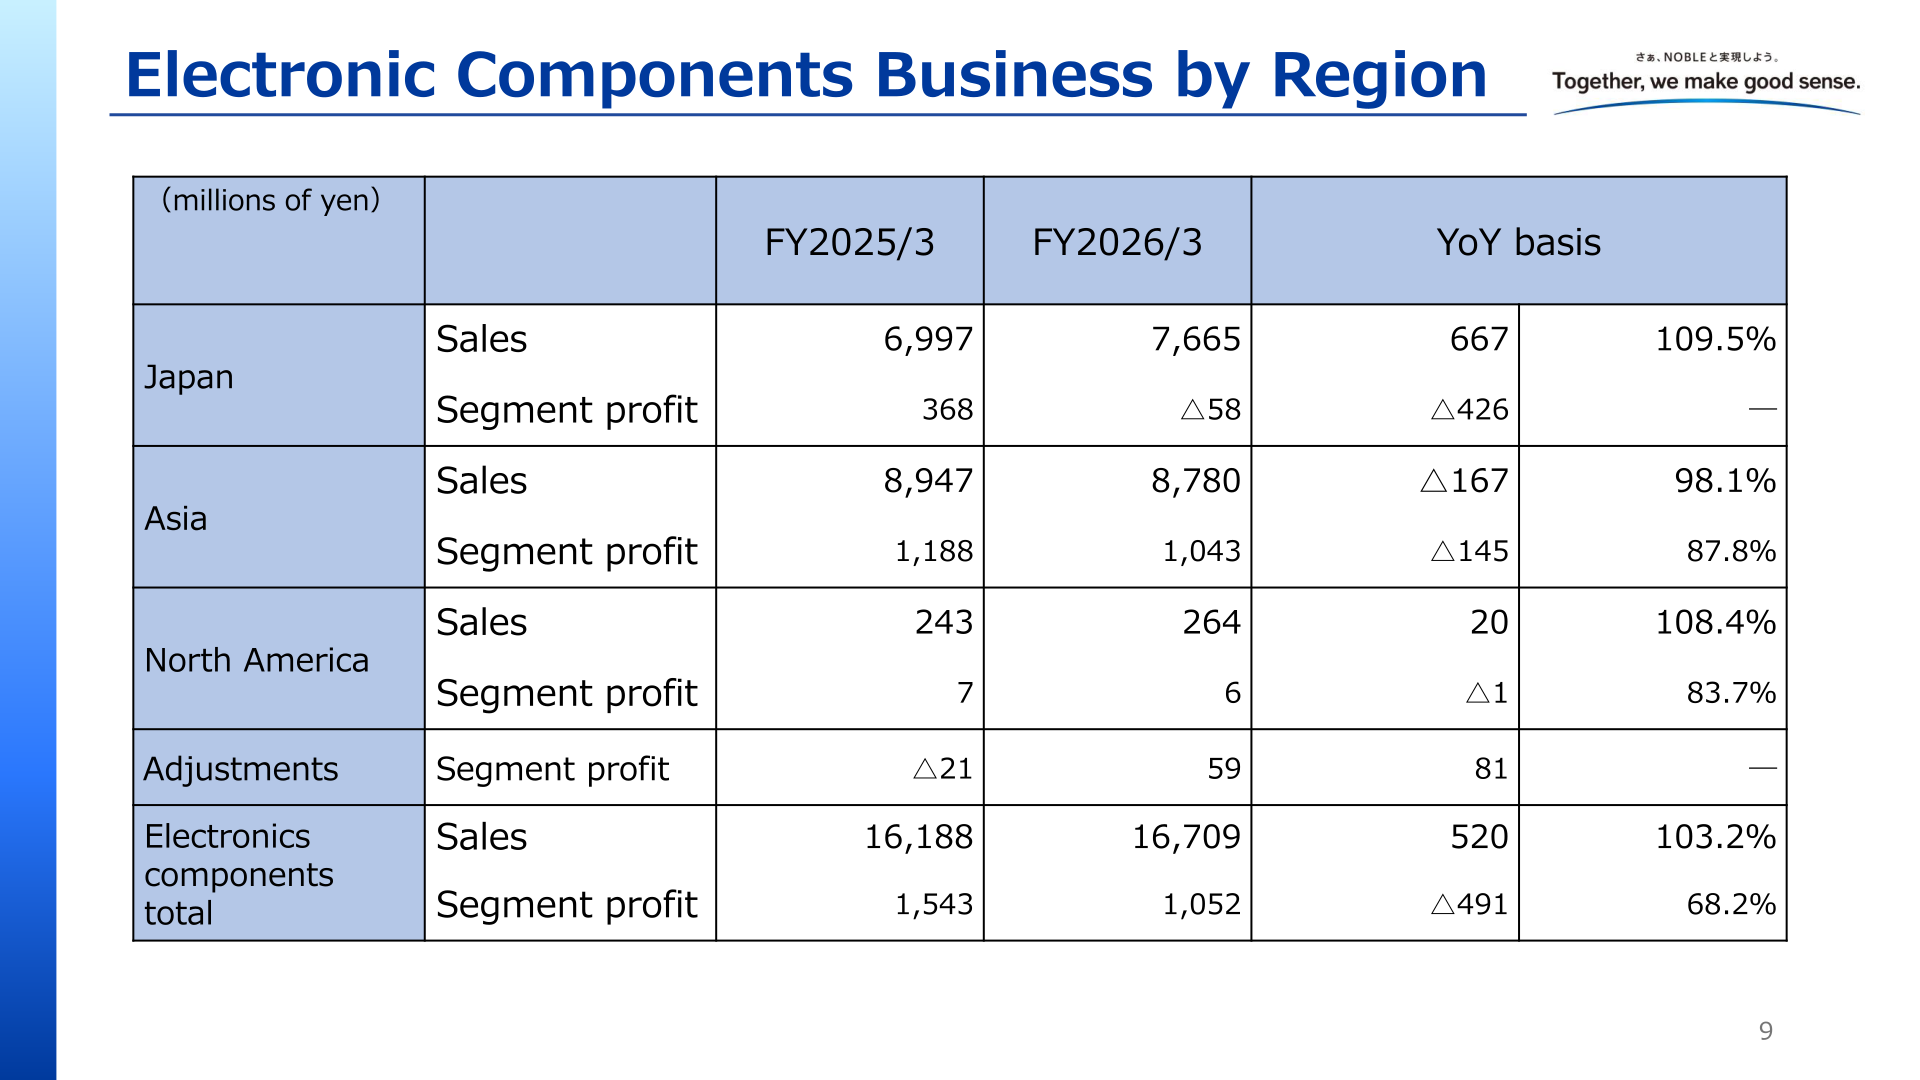
By region, sales in Japan increased to ¥7,665 million (109.5%), but the region posted a segment loss of ¥58 million, a deterioration of ¥426 million from the prior year’s profit of ¥368 million. Asia recorded sales of ¥8,780 million (98.1%) with segment profit of ¥1,043 million (87.8%), and North America recorded sales of ¥264 million (108.4%) with segment profit of ¥6 million. Total segment profit for the electronic components business was ¥1,052 million (68.2%).
| Region | Metric (millions of yen) | FY2025/3 | FY2026/3 | Change | YoY basis |
|---|---|---|---|---|---|
| Japan | Sales | 6,997 | 7,665 | 667 | 109.5% |
| Japan | Segment profit | 368 | △58 | △426 | ― |
| Asia | Sales | 8,947 | 8,780 | △167 | 98.1% |
| Asia | Segment profit | 1,188 | 1,043 | △145 | 87.8% |
| North America | Sales | 243 | 264 | 20 | 108.4% |
| North America | Segment profit | 7 | 6 | △1 | 83.7% |
| Adjustments | Segment profit | △21 | 59 | 81 | ― |
| Electronics components total | Sales | 16,188 | 16,709 | 520 | 103.2% |
| Electronics components total | Segment profit | 1,543 | 1,052 | △491 | 68.2% |
Balance Sheet and Cash Flows
Total assets at the end of FY2026/3 were ¥34,738 million, an increase of ¥1,278 million from a year earlier. Current assets decreased by ¥2,402 million to ¥18,846 million, reflecting a decrease in cash and deposits (△¥1,911 million), while fixed assets increased by ¥3,681 million to ¥15,892 million on an increase in construction in progress (+¥2,650 million). Total net assets were ¥29,303 million.
Cash flow from operating activities was ¥1,934 million, supported by profit before income taxes of ¥2,138 million. Cash flow from investment activities was △¥2,366 million, including proceeds from the sale of investment securities of ¥730 million and purchases of property, plant and equipment of ¥3,236 million, leaving free cash flow at △¥432 million. Financing activities used ¥1,625 million, including dividend payments of ¥949 million and purchases of treasury shares of ¥502 million. Cash and cash equivalents at the end of the period stood at ¥9,158 million.
Full-Year Forecast (FY2027/3)
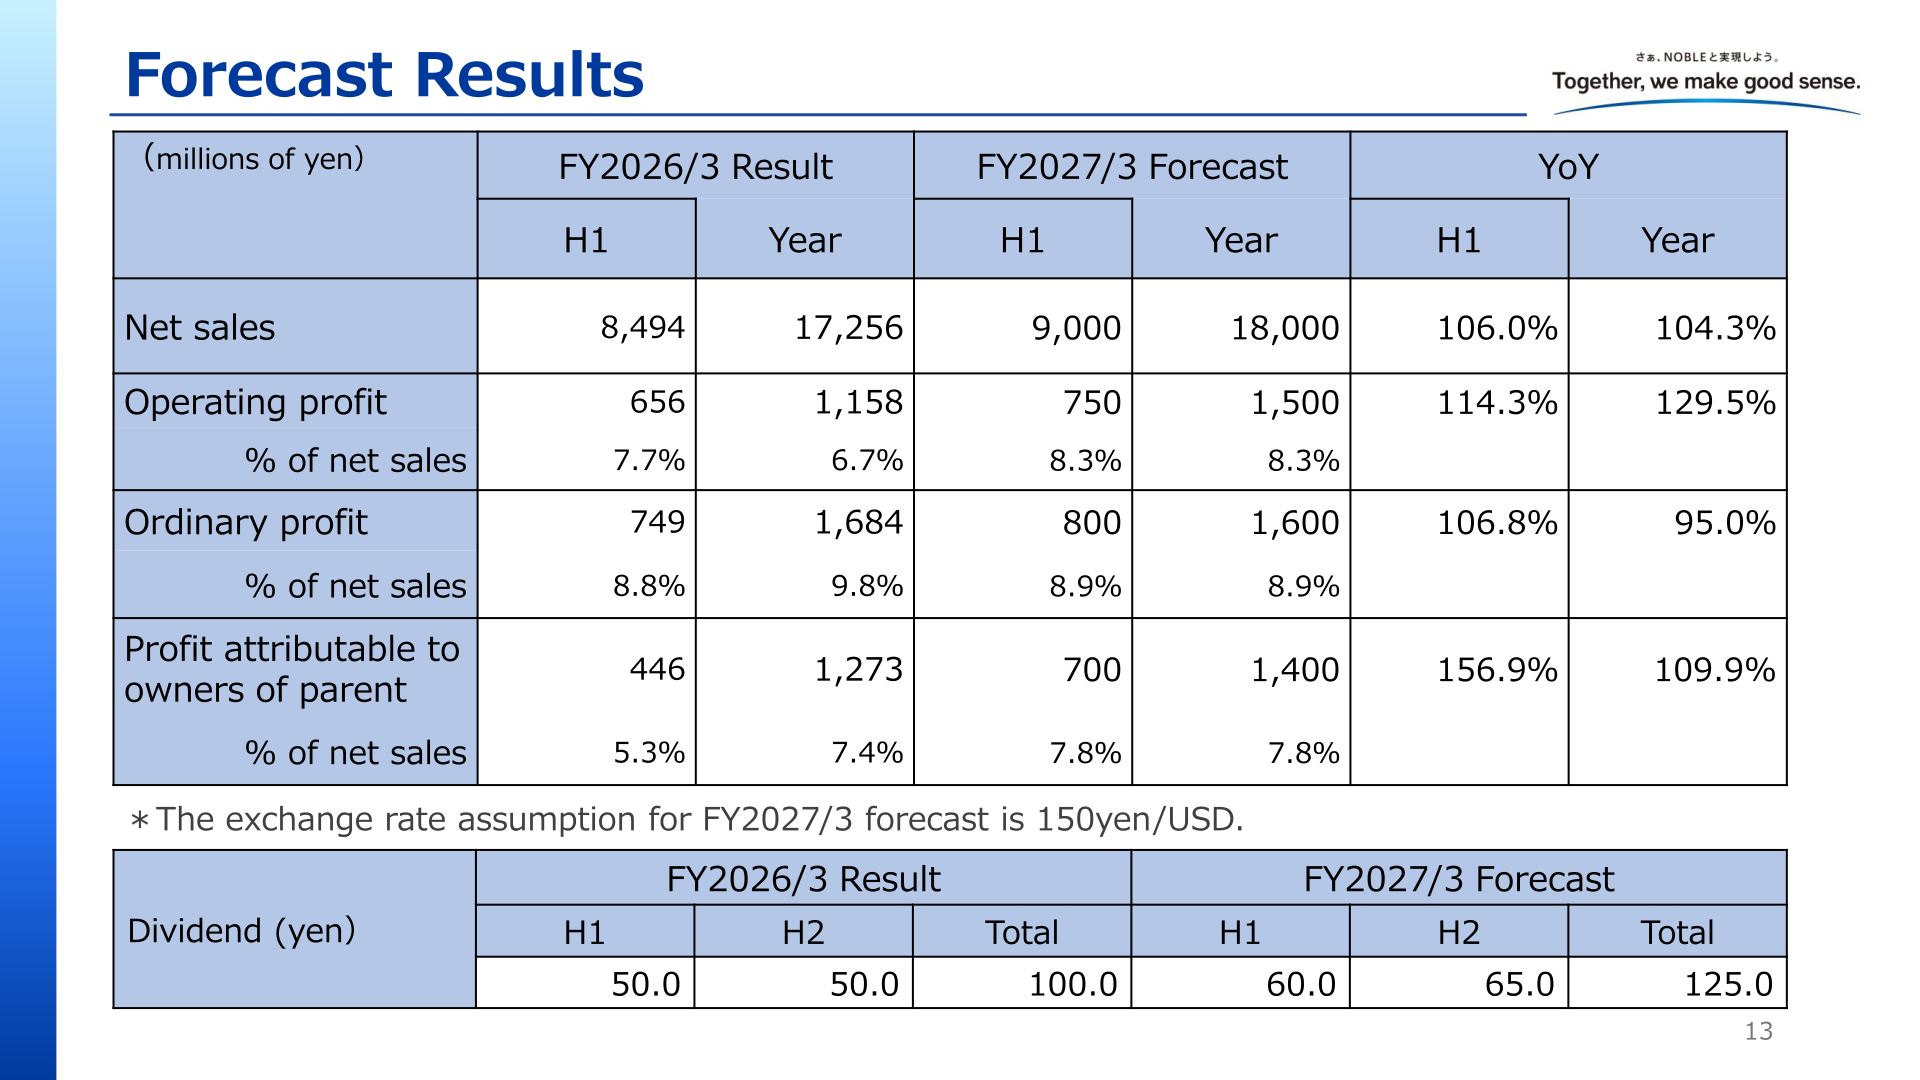
For FY2027/3, the company forecasts net sales of ¥18,000 million (104.3% of FY2026/3), operating profit of ¥1,500 million (129.5%), ordinary profit of ¥1,600 million (95.0%), and profit attributable to owners of parent of ¥1,400 million (109.9%). For the first half, the forecast is net sales of ¥9,000 million and operating profit of ¥750 million. The exchange rate assumption for the FY2027/3 forecast is 150 yen/USD.
| Item (millions of yen) | FY2026/3 Result | FY2027/3 Forecast | YoY (Year) |
|---|---|---|---|
| Net sales | 17,256 | 18,000 | 104.3% |
| Operating profit | 1,158 | 1,500 | 129.5% |
| % of net sales | 6.7% | 8.3% | |
| Ordinary profit | 1,684 | 1,600 | 95.0% |
| % of net sales | 9.8% | 8.9% | |
| Profit attributable to owners of parent | 1,273 | 1,400 | 109.9% |
| % of net sales | 7.4% | 7.8% |
Shareholder Returns
The annual dividend for FY2026/3 was ¥100.0 per share (interim ¥50.0, year-end ¥50.0), unchanged from FY2025/3. For FY2027/3, the company forecasts an annual dividend of ¥125.0 per share (interim ¥60.0, year-end ¥65.0). In addition, purchases of treasury shares of ¥502 million were recorded in cash flow from financing activities in FY2026/3.
This article is an analysis based on publicly available information and is not a recommendation to buy or sell any specific securities. Investment decisions are your own responsibility.
![[Obayashi] Investors’ Guide 2026 — The Complete 24-Article Breakdown](https://japan-equity.com/wp-content/uploads/2026/07/hub_cover-1024x1024.png)
![[Obayashi] IR & SR Policy — Feeding Dialogue Back into Management](https://japan-equity.com/wp-content/uploads/2026/07/p32_sq-1024x1024.jpg)
![[Obayashi] Real Estate Development — 18.7% Margin, ¥287.7bn Unrealized Gains](https://japan-equity.com/wp-content/uploads/2026/07/p20_sq-1024x1024.jpg)
![[Obayashi] Domestic Civil Engineering — Resilience Spending Supports 9.6% Margin](https://japan-equity.com/wp-content/uploads/2026/07/p11_sq-1024x1024.jpg)
![[Obayashi] Share Price & External Ratings — vs TOPIX, ESG Index Inclusion](https://japan-equity.com/wp-content/uploads/2026/07/p40_sq-1024x1024.jpg)
![[Construction] ¥75.5tn Investment, Shrinking Workforce — Big-5 Market Share](https://japan-equity.com/wp-content/uploads/2026/07/p12_sq-1024x1024.jpg)



![[Obayashi] Capital Policy & Shareholder Returns — ROE 10%+, DOE ~5%, ¥100bn Buyback](https://japan-equity.com/wp-content/uploads/2026/07/p27_sq-1024x1024.jpg)
![[Obayashi] Reducing Cross-Shareholdings — ¥285.2bn Sold in Five Years](https://japan-equity.com/wp-content/uploads/2026/07/p29_sq-1024x1024.jpg)
![[Obayashi] ¥750bn Investment Plan — ¥300bn to Development, ¥190bn to Tech/DX](https://japan-equity.com/wp-content/uploads/2026/07/p30_sq-1024x1024.jpg)
![[Obayashi] MTP2022 KPIs — Operating Profit ~2x Target, ROE 14.4%](https://japan-equity.com/wp-content/uploads/2026/07/p25_sq-1024x1024.jpg)
![[Obayashi] Cash Allocation — ¥420bn Investment CF Over Five Years](https://japan-equity.com/wp-content/uploads/2026/07/p26_sq-1024x1024.jpg)
![[Obayashi] Green Energy — 44 Plants, 344MW, and the Green Hydrogen Challenge](https://japan-equity.com/wp-content/uploads/2026/07/p21_sq-1024x1024.jpg)
![[Obayashi] Tackling the Labor Shortage — Robotics Construction®](https://japan-equity.com/wp-content/uploads/2026/07/p14_sq-1024x1024.jpg)
