
This article is based on publicly available IR materials and is not a recommendation to buy or sell any specific securities.
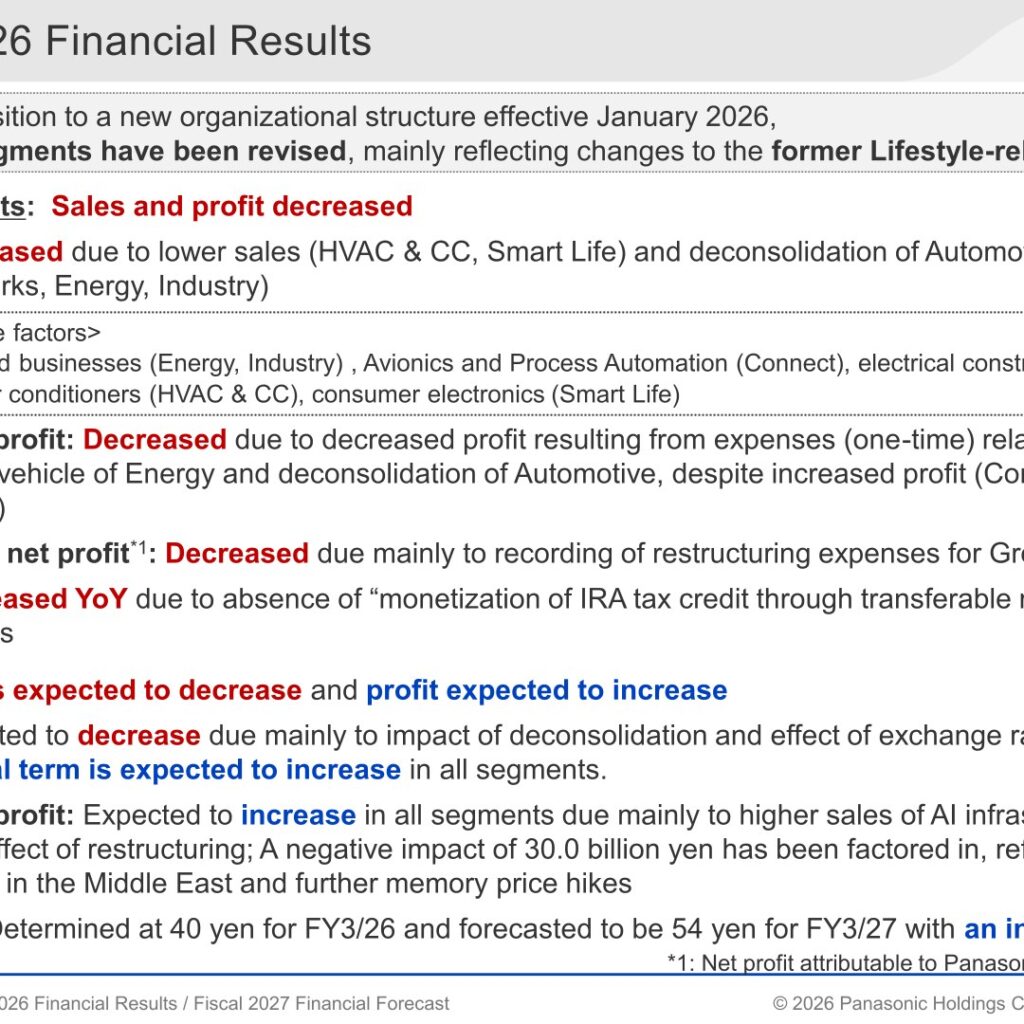
Panasonic Holdings Corporation reported FY3/26 (fiscal year ended March 31, 2026) results with sales of JPY8,048.7bn (95% YoY) and adjusted operating profit of JPY447.4bn (96% YoY, 5.6% margin), as growth in Connect, Electric Works, HVAC & CC and Industry was outweighed by lower sales in HVAC & CC and Smart Life and the deconsolidation of Automotive. Operating profit fell to JPY236.4bn (55% YoY) and net profit attributable to Panasonic Holdings Corporation stockholders fell to JPY189.5bn (52% YoY), mainly due to restructuring expenses for Group Management Reform and one-time expenses related to past manufacturing-process issues for In-vehicle within the Energy segment. For FY3/27, the company forecasts sales to decrease to JPY7,600.0bn (94% YoY) due mainly to deconsolidation and FX effects, while adjusted operating profit is expected to increase 134% YoY to JPY600.0bn, driven by higher sales of AI infrastructure-related businesses across all segments and the effect of restructuring. Annual dividends were determined at 40 yen for FY3/26 and are forecast at 54 yen for FY3/27, an increase of 14 yen YoY.
Consolidated Results (FY3/26 Full-Year Actual)
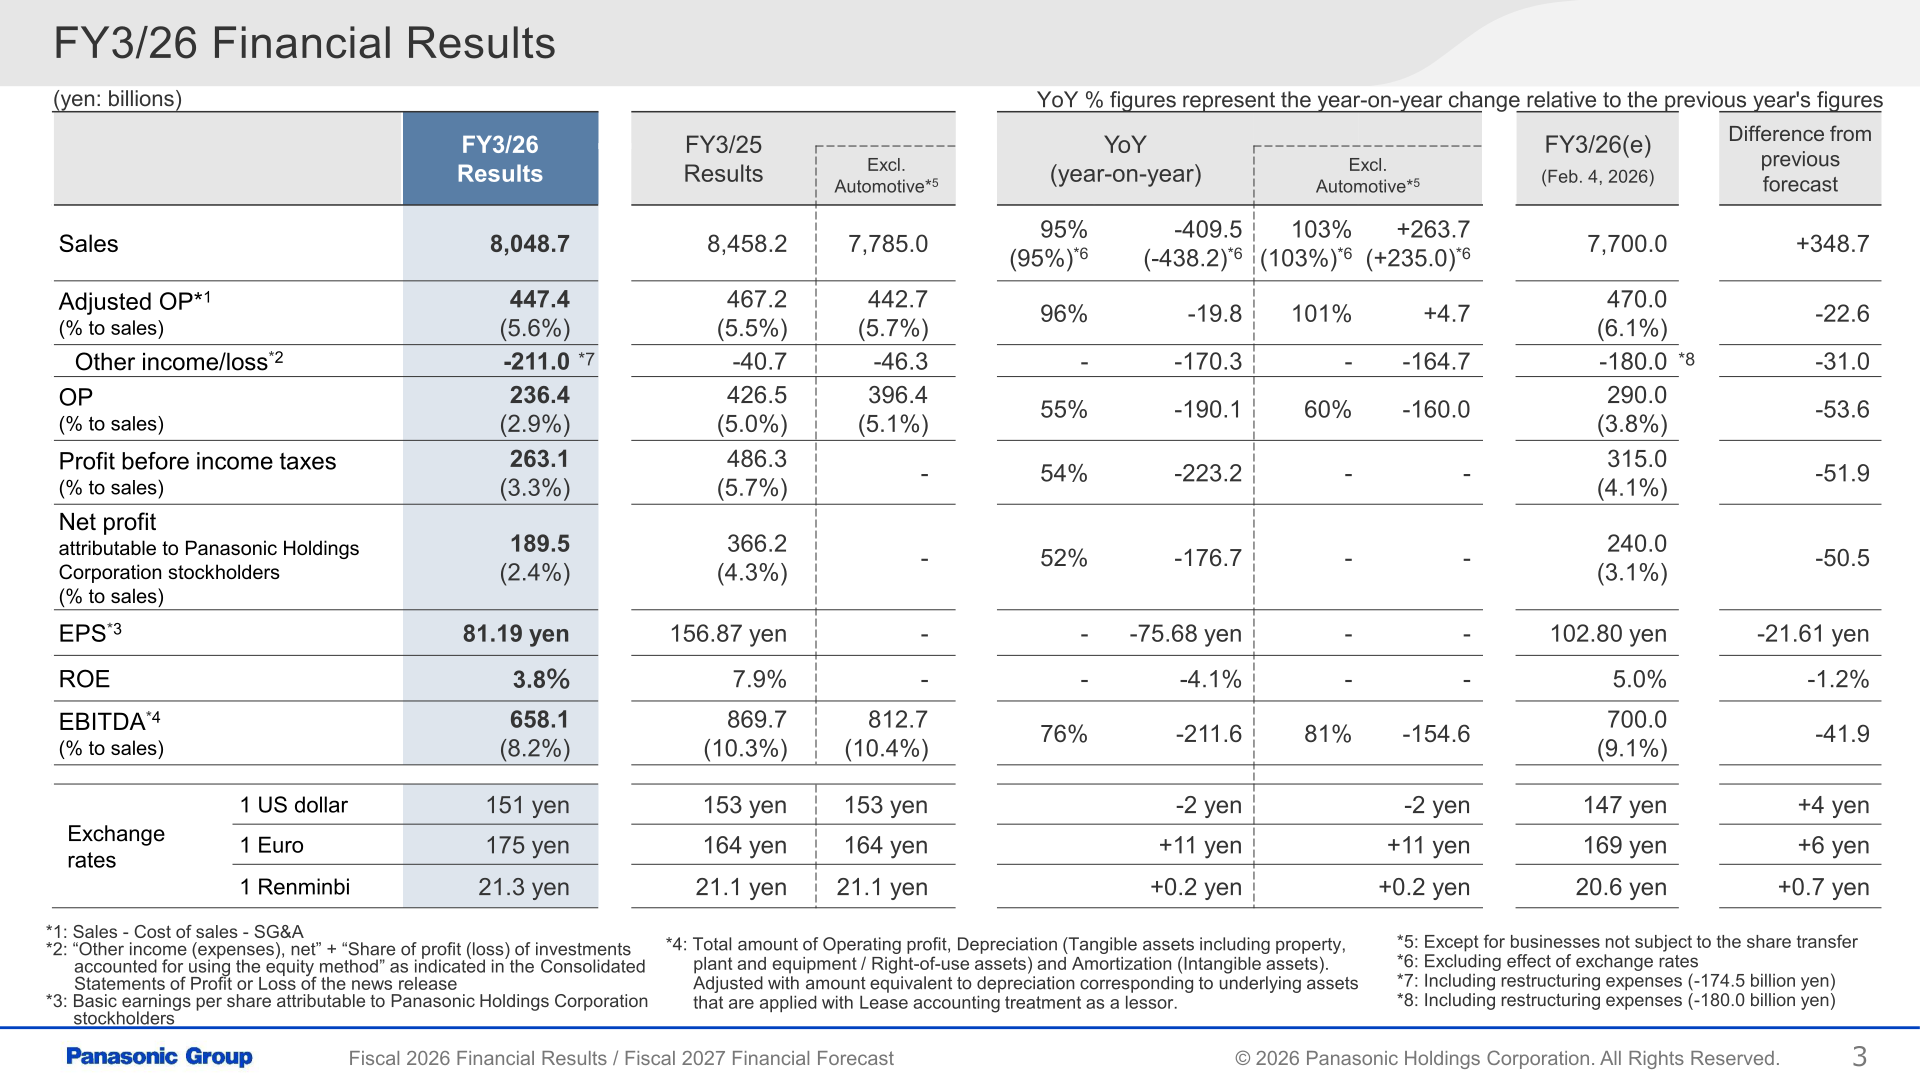
Sales in FY3/26 declined to JPY8,048.7bn (95% YoY), as lower sales in HVAC & CC and Smart Life and the deconsolidation of Automotive were only partly offset by higher sales in Connect, Electric Works, Energy and Industry. On a real-term basis, excluding the impact of Automotive deconsolidation and foreign exchange effects, sales increased JPY235.0bn (103% YoY). Adjusted operating profit fell to JPY447.4bn (96% YoY, 5.6% margin), down JPY19.8bn, reflecting decreased profit from one-time expenses (approximately JPY40.0bn) related to past manufacturing-process issues for In-vehicle within Energy and the deconsolidation of Automotive, despite increased profit in Connect, Electric Works, HVAC & CC and Industry. Other income/loss was JPY-211.0bn (versus JPY-40.7bn in FY3/25), which included restructuring expenses of JPY-174.5bn for Group Management Reform. As a result, operating profit fell to JPY236.4bn (55% YoY, 2.9% margin) and net profit attributable to Panasonic Holdings Corporation stockholders fell to JPY189.5bn (52% YoY, 2.4% margin). EPS was 81.19 yen (down 75.68 yen YoY) and ROE was 3.8% (down 4.1pt YoY). EBITDA was JPY658.1bn (76% YoY, 8.2% margin). Operating cash flow decreased YoY due to the absence of monetization of IRA tax credit through the transferable method recorded in FY3/25 and to restructuring expenses; net cash at end of FY3/26 was JPY-653.2bn.
| Item | FY3/26 Results | FY3/25 Results | YoY |
|---|---|---|---|
| Sales (bn JPY) | 8,048.7 | 8,458.2 | 95% |
| Adjusted operating profit (bn JPY, % to sales) | 447.4 (5.6%) | 467.2 (5.5%) | 96% |
| Other income/loss (bn JPY) | -211.0 | -40.7 | – |
| Operating profit (bn JPY, % to sales) | 236.4 (2.9%) | 426.5 (5.0%) | 55% |
| Profit before income taxes (bn JPY, % to sales) | 263.1 (3.3%) | 486.3 (5.7%) | 54% |
| Net profit attributable to Panasonic Holdings Corporation stockholders (bn JPY, % to sales) | 189.5 (2.4%) | 366.2 (4.3%) | 52% |
| EPS | 81.19 yen | 156.87 yen | -75.68 yen |
| ROE | 3.8% | 7.9% | -4.1pt |
| EBITDA (bn JPY, % to sales) | 658.1 (8.2%) | 869.7 (10.3%) | 76% |
Segment Results (FY3/26)
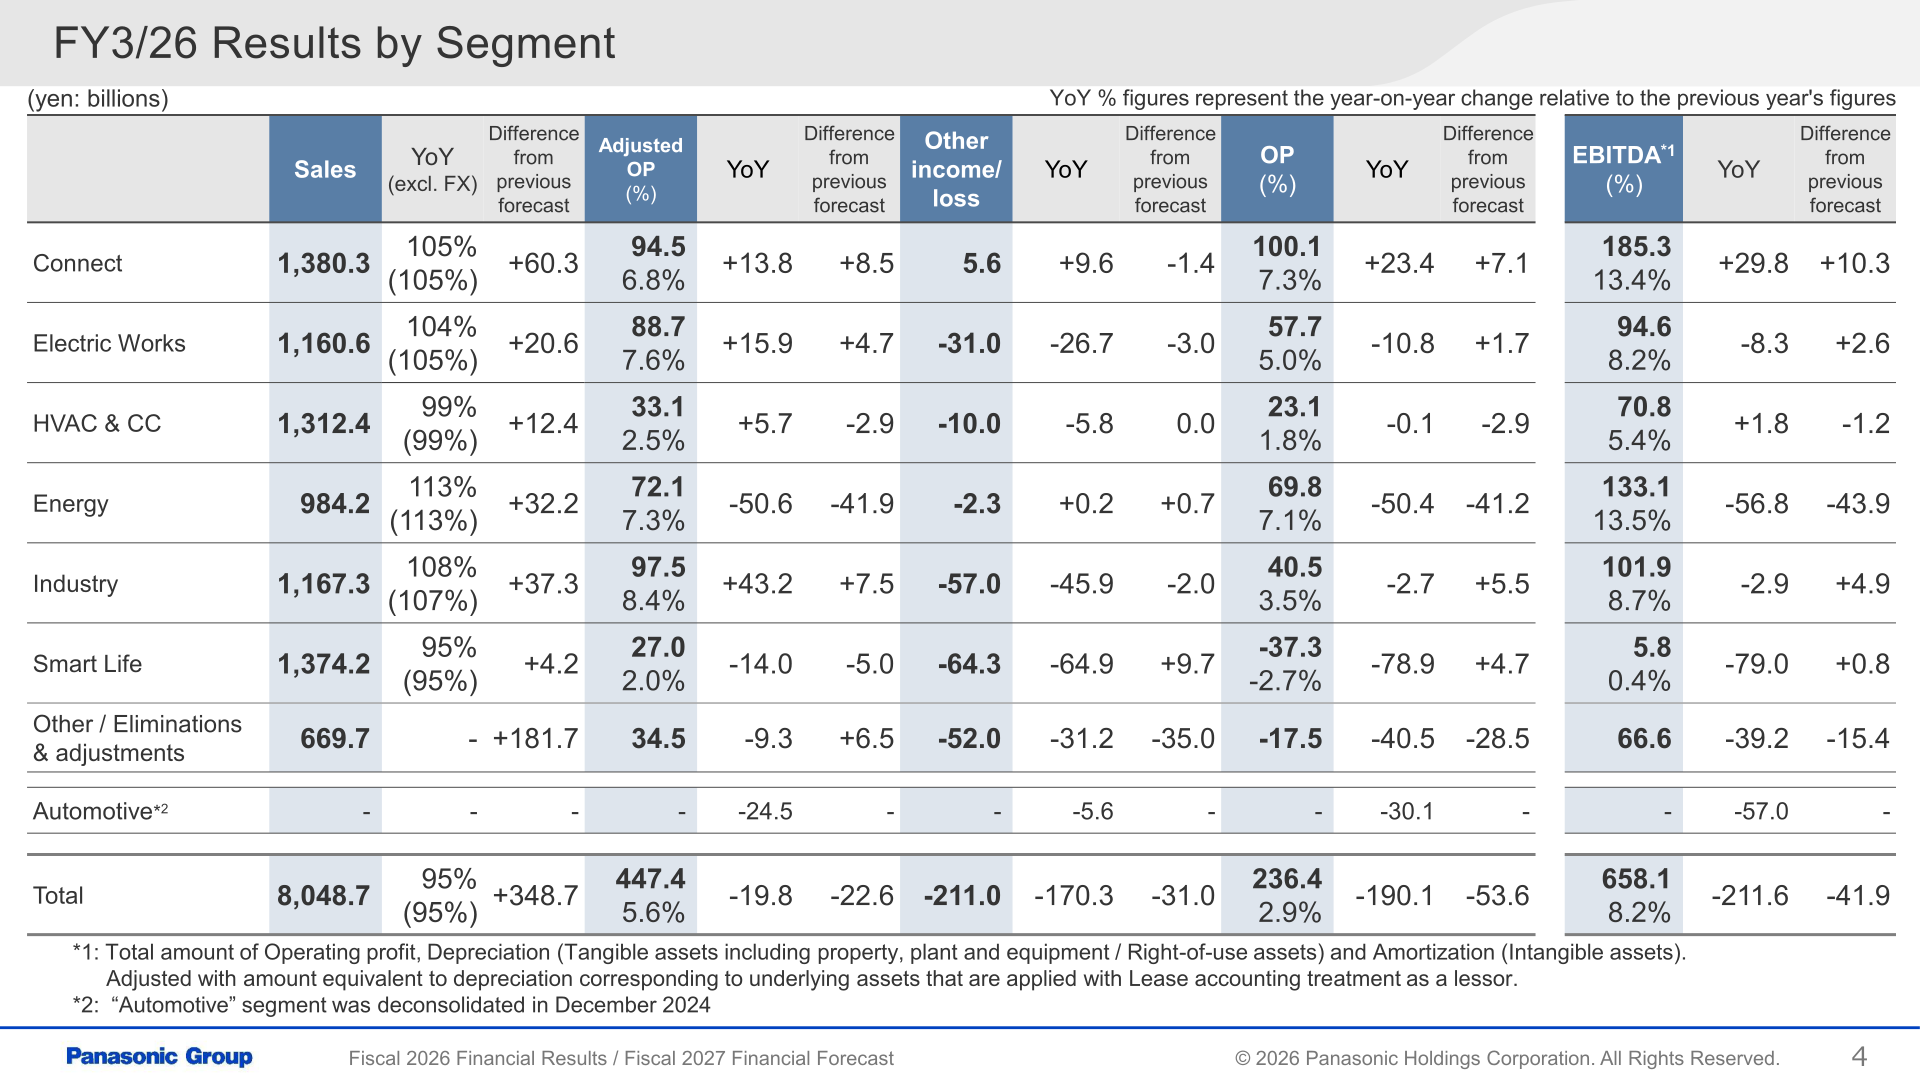
By segment, Connect sales rose to JPY1,380.3bn (105% YoY) on higher sales of Process Automation (capturing demand for ICT including generative AI servers), Avionics (continued strong orders) and Blue Yonder; adjusted operating profit rose to JPY94.5bn (6.8% margin, +13.8bn YoY). Electric Works sales rose to JPY1,160.6bn (104% YoY) on higher sales of electrical construction materials in Japan and overseas, including LED lighting replacement demand in Japan driven by fluorescent lamp regulations; adjusted operating profit rose to JPY88.7bn (7.6% margin, +15.9bn YoY). HVAC & CC sales declined to JPY1,312.4bn (99% YoY) as lower room air-conditioner sales in Asia (weak demand due to unfavorable weather) were only partly offset by A2W recovery and higher Cold Chain sales in Europe; adjusted operating profit rose to JPY33.1bn (2.5% margin, +5.7bn YoY) on higher A2W sales and the effect of restructuring. Energy sales rose to JPY984.2bn (113% YoY) on higher sales of energy storage systems for data centers, despite lower In-vehicle sales in Japan; adjusted operating profit fell sharply to JPY72.1bn (7.3% margin, -50.6bn YoY), impacted by US tariffs, ramp-up costs at the Kansas factory and one-time expenses related to past manufacturing-process issues for In-vehicle. Industry sales rose to JPY1,167.3bn (108% YoY) on higher sales of capacitors and multi-layer circuit board materials for information & communication applications such as generative AI servers; adjusted operating profit rose to JPY97.5bn (8.4% margin, +43.2bn YoY). Smart Life sales fell to JPY1,374.2bn (95% YoY) on lower overseas sales (China: weak demand for large-size appliances; Europe: lower AVC sales), despite higher white goods sales in Japan; adjusted operating profit fell to JPY27.0bn (2.0% margin, -14.0bn YoY), reflecting restructuring expenses related to strengthening the TV business partnership.
| Segment | Sales FY3/26 (bn JPY) | Adjusted OP FY3/26 (bn JPY, %) | Adjusted OP YoY (bn JPY) |
|---|---|---|---|
| Connect | 1,380.3 | 94.5 (6.8%) | +13.8 |
| Electric Works | 1,160.6 | 88.7 (7.6%) | +15.9 |
| HVAC & CC | 1,312.4 | 33.1 (2.5%) | +5.7 |
| Energy | 984.2 | 72.1 (7.3%) | -50.6 |
| Industry | 1,167.3 | 97.5 (8.4%) | +43.2 |
| Smart Life | 1,374.2 | 27.0 (2.0%) | -14.0 |
| Other / Eliminations & adjustments | 669.7 | 34.5 | -9.3 |
| Total | 8,048.7 | 447.4 (5.6%) | -19.8 |
FY3/27 Forecast
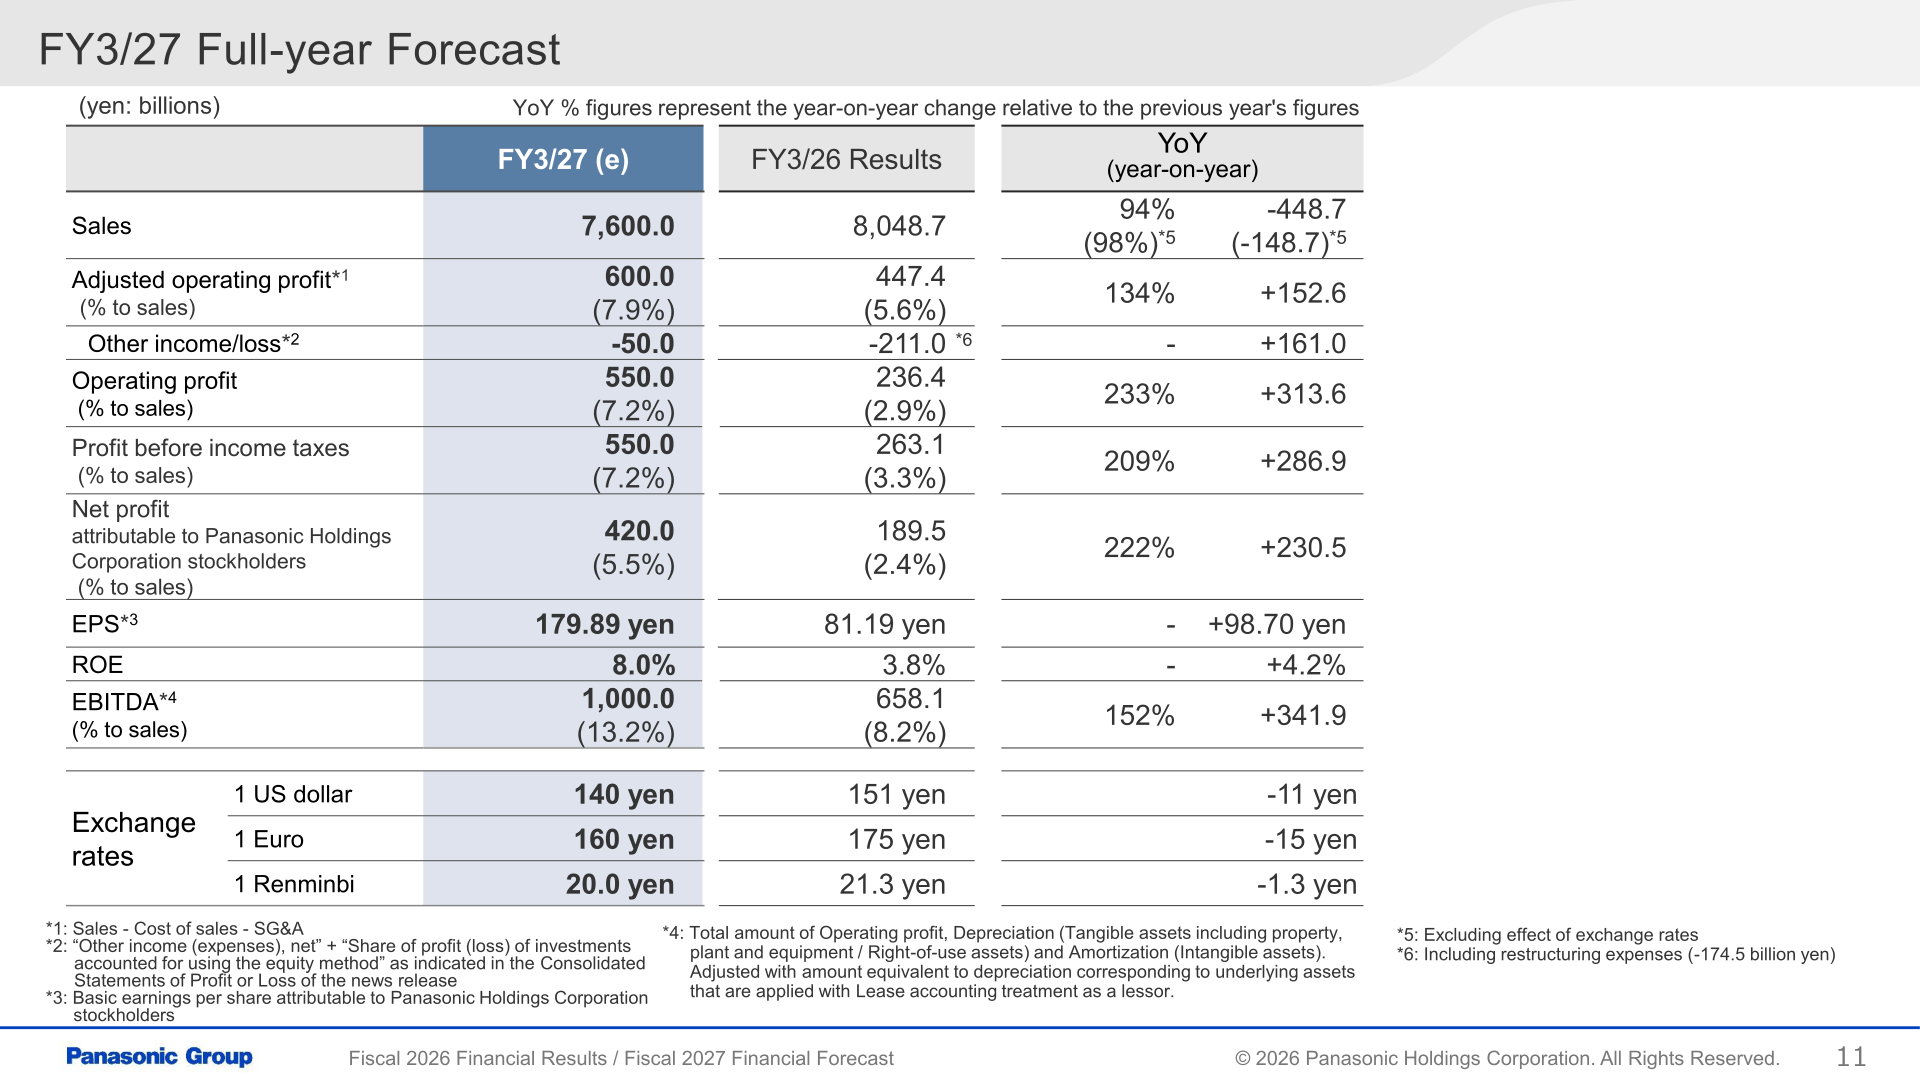
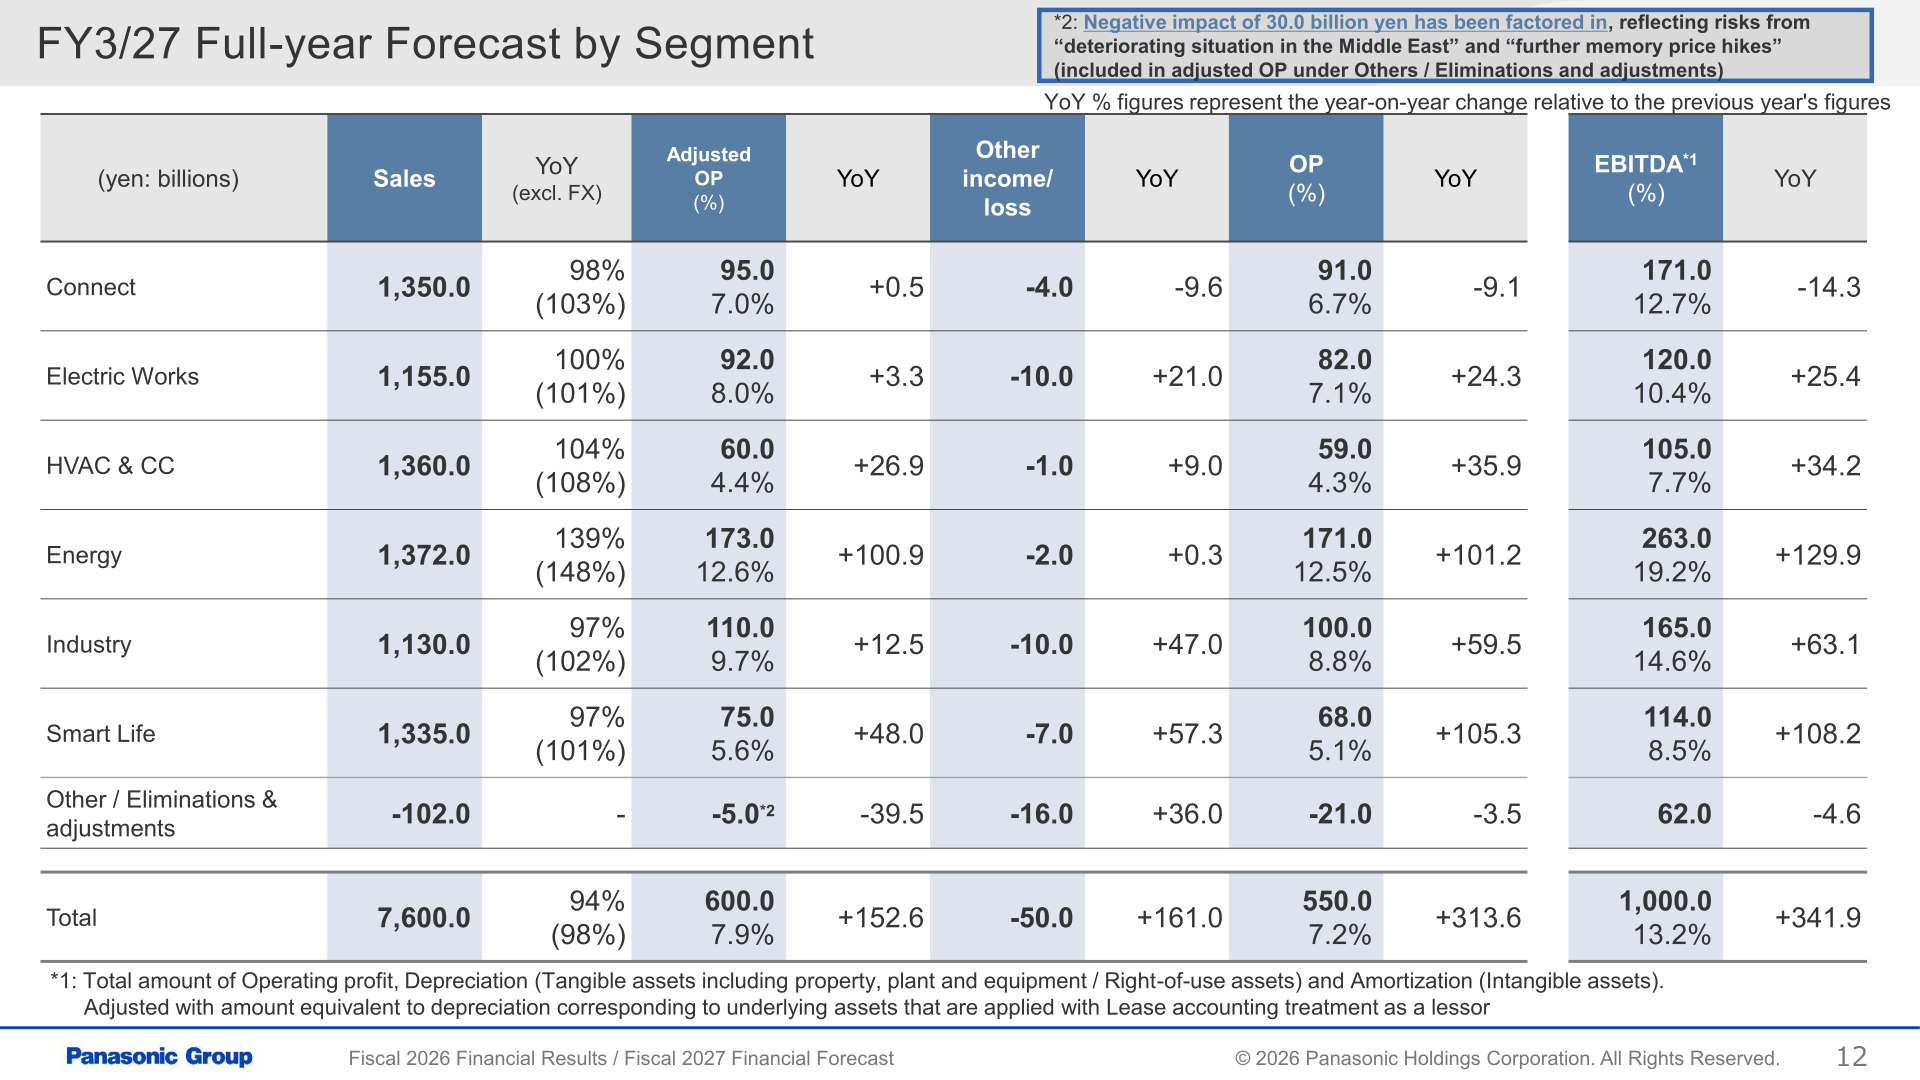
For FY3/27, Panasonic Holdings forecasts sales of JPY7,600.0bn, down JPY448.7bn (94% YoY), or down JPY148.7bn (98% YoY) excluding the effect of exchange rates, driven mainly by the deconsolidation impact of Housing (-370.0bn) and Ficosa (-237.5bn), although sales in real terms are expected to increase YoY in all segments. Adjusted operating profit is forecast to increase 134% YoY to JPY600.0bn (7.9% margin), expected to increase in all segments due mainly to higher sales of AI infrastructure-related businesses and the effect of restructuring; a negative impact of JPY30.0bn has been factored in, reflecting risks from the deteriorating situation in the Middle East and further memory price hikes. Other income/loss is forecast at JPY-50.0bn (versus JPY-211.0bn in FY3/26, which included restructuring expenses), and operating profit is forecast to more than double to JPY550.0bn (233% YoY, 7.2% margin). Net profit attributable to Panasonic Holdings Corporation stockholders is forecast at JPY420.0bn (222% YoY, 5.5% margin), with EPS of 179.89 yen and ROE of 8.0%. EBITDA is forecast at JPY1,000.0bn (152% YoY, 13.2% margin). The forecast assumes exchange rates of 140 yen/US dollar, 160 yen/Euro and 20.0 yen/Renminbi, versus 151 yen, 175 yen and 21.3 yen respectively in FY3/26. A negative impact of JPY34.0bn from US tariffs has also been factored into the FY3/27 forecast, versus a JPY31.0bn impact in FY3/26 results.
| Item | FY3/27 Forecast | FY3/26 Results | YoY |
|---|---|---|---|
| Sales (bn JPY) | 7,600.0 | 8,048.7 | 94% (98% excl. FX) |
| Adjusted operating profit (bn JPY, % to sales) | 600.0 (7.9%) | 447.4 (5.6%) | 134% |
| Other income/loss (bn JPY) | -50.0 | -211.0 | – |
| Operating profit (bn JPY, % to sales) | 550.0 (7.2%) | 236.4 (2.9%) | 233% |
| Profit before income taxes (bn JPY, % to sales) | 550.0 (7.2%) | 263.1 (3.3%) | 209% |
| Net profit attributable to Panasonic Holdings Corporation stockholders (bn JPY, % to sales) | 420.0 (5.5%) | 189.5 (2.4%) | 222% |
| EPS | 179.89 yen | 81.19 yen | +98.70 yen |
| ROE | 8.0% | 3.8% | +4.2pt |
| EBITDA (bn JPY, % to sales) | 1,000.0 (13.2%) | 658.1 (8.2%) | 152% |
FY3/27 Segment Forecast
By segment, Energy is forecast to see the largest improvement, with sales rising to JPY1,372.0bn (139% YoY, 148% excl. FX) and adjusted operating profit rising to JPY173.0bn (12.6% margin, +100.9bn YoY), supported by higher In-vehicle sales at North American factories and an increase in IRA tax credit from higher sales volume, plus higher sales of energy storage systems for data centers, despite increased fixed costs from the ramp-up of the Kansas factory. Smart Life adjusted operating profit is forecast to rise to JPY75.0bn (5.6% margin, +48.0bn YoY) on the effect of restructuring (absence of one-time FY3/26 expenses and reduced fixed costs) and management structure enhancement. HVAC & CC adjusted operating profit is forecast to rise to JPY60.0bn (4.4% margin, +26.9bn YoY) on higher HVAC and Cold Chain sales and the effect of restructuring. Industry adjusted operating profit is forecast to rise to JPY110.0bn (9.7% margin, +12.5bn YoY) on higher sales of capacitors and multi-layer circuit board materials for generative AI server applications. Connect and Electric Works adjusted operating profit are forecast at JPY95.0bn (7.0% margin, +0.5bn YoY) and JPY92.0bn (8.0% margin, +3.3bn YoY) respectively.
| Segment | Sales FY3/27E (bn JPY) | Adjusted OP FY3/27E (bn JPY, %) | Adjusted OP YoY (bn JPY) |
|---|---|---|---|
| Connect | 1,350.0 | 95.0 (7.0%) | +0.5 |
| Electric Works | 1,155.0 | 92.0 (8.0%) | +3.3 |
| HVAC & CC | 1,360.0 | 60.0 (4.4%) | +26.9 |
| Energy | 1,372.0 | 173.0 (12.6%) | +100.9 |
| Industry | 1,130.0 | 110.0 (9.7%) | +12.5 |
| Smart Life | 1,335.0 | 75.0 (5.6%) | +48.0 |
| Other / Eliminations & adjustments | -102.0 | -39.5 | -16.0 |
| Total | 7,600.0 | 600.0 (7.9%) | +152.6 |
Shareholder Returns
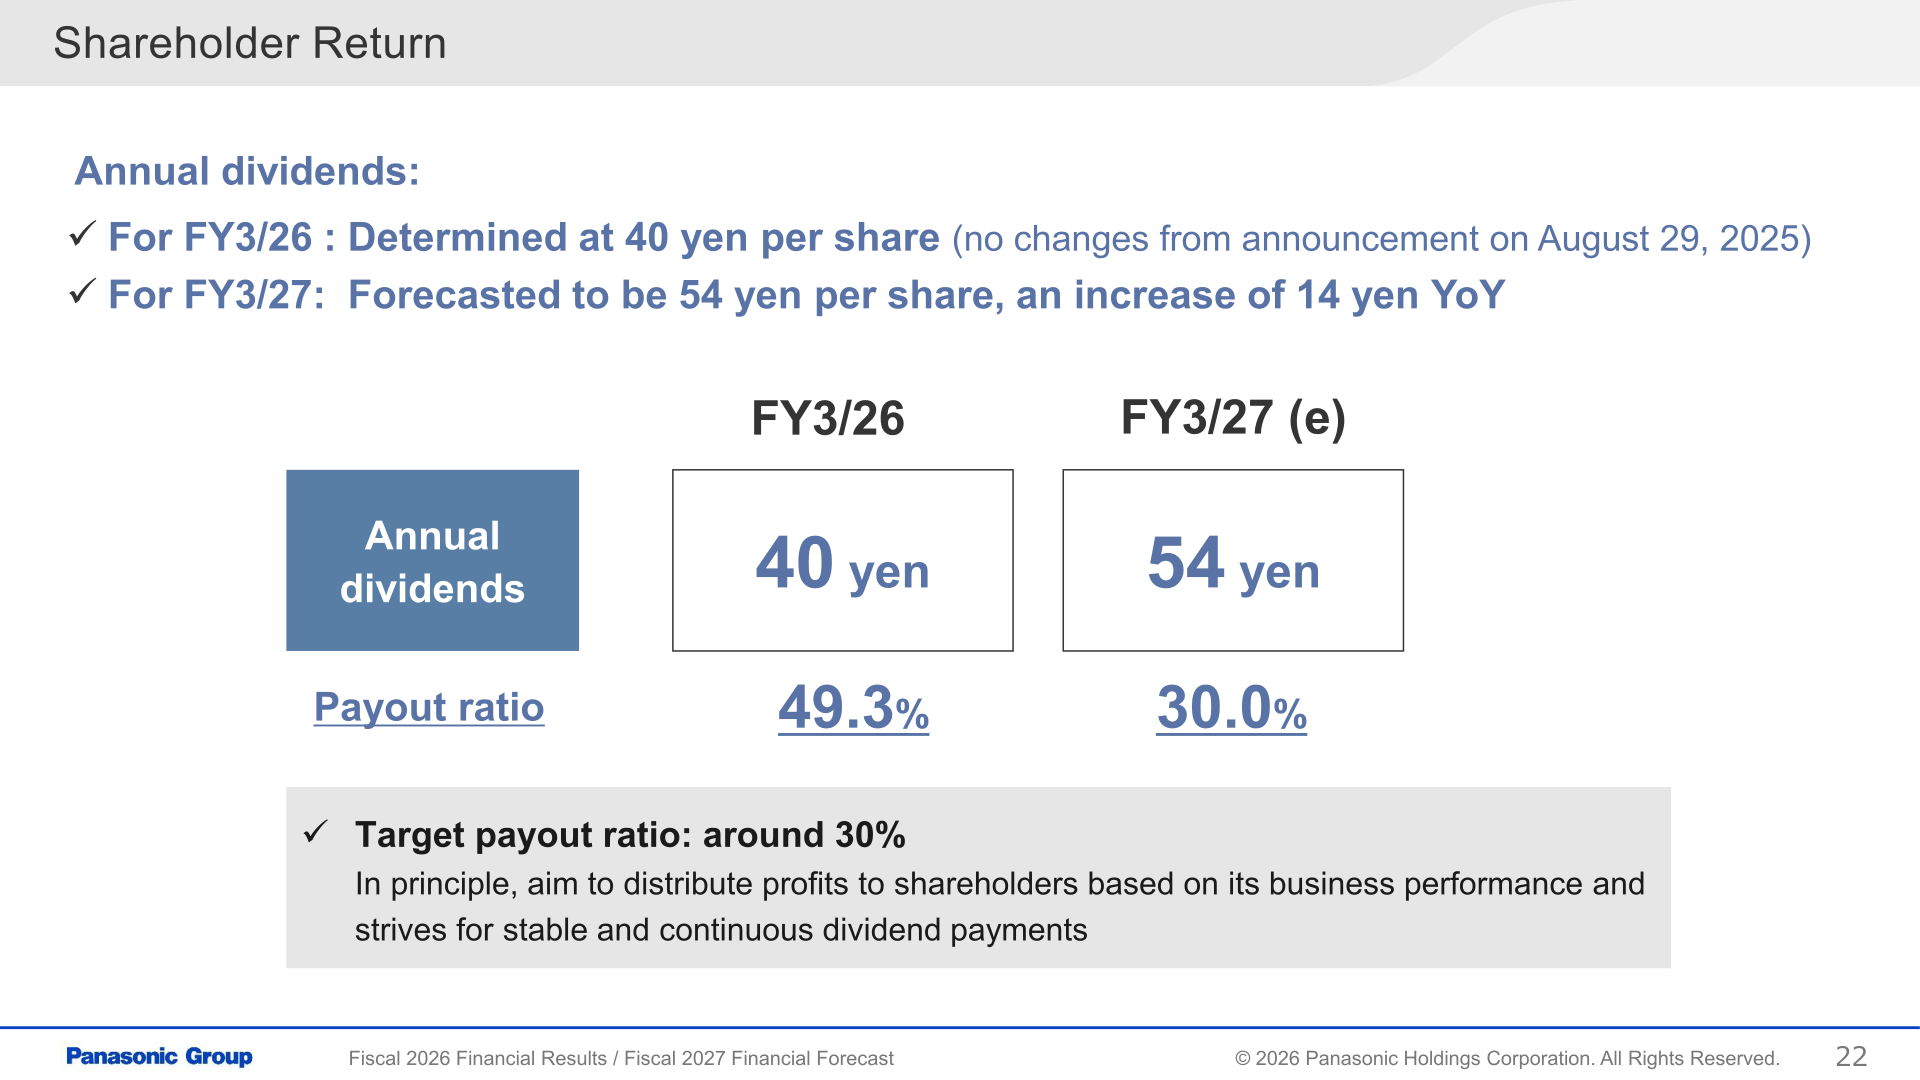
Annual dividends for FY3/26 were determined at 40 yen per share, unchanged from the announcement on August 29, 2025, for a payout ratio of 49.3%. For FY3/27, the dividend is forecast at 54 yen per share, an increase of 14 yen YoY, with a target payout ratio of around 30%. Panasonic Holdings states that, in principle, it aims to distribute profits to shareholders based on business performance and strives for stable and continuous dividend payments.
Group Management Reform: Restructuring Progress
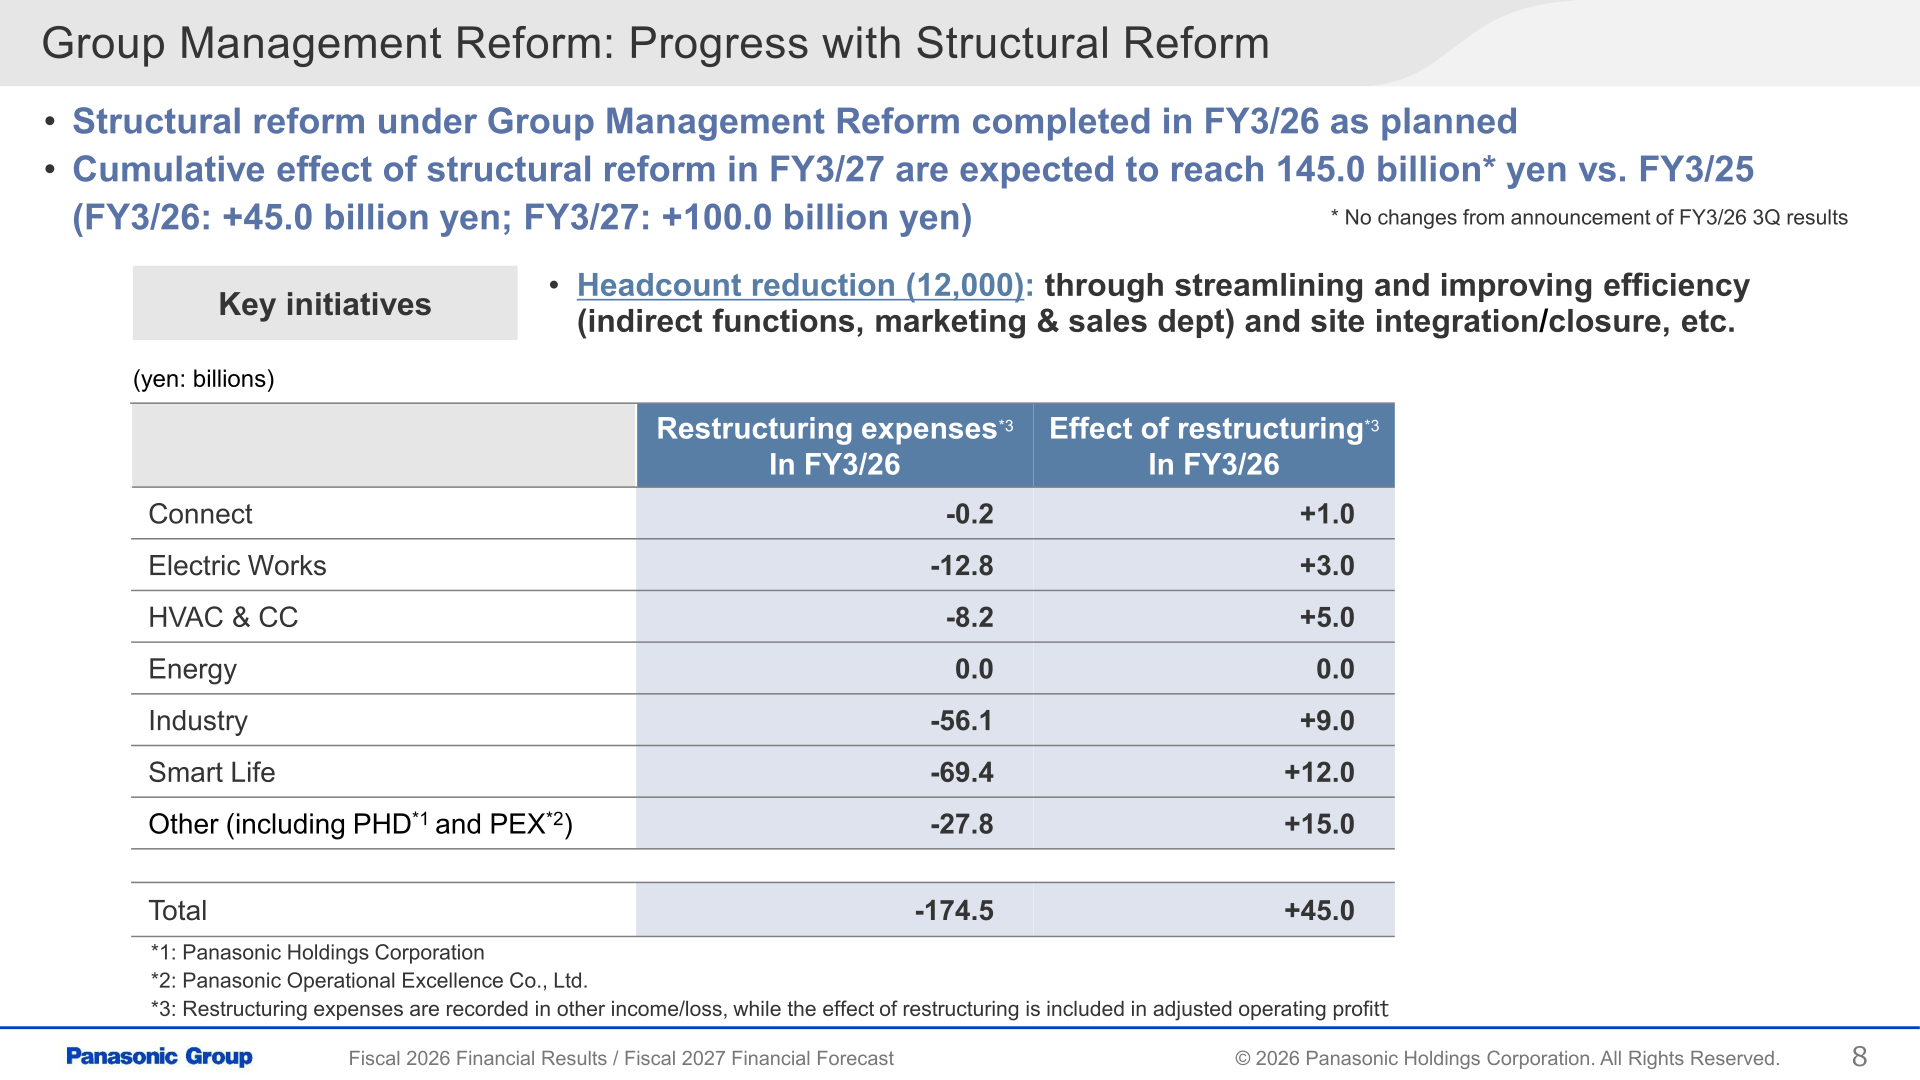
Restructuring expenses under Group Management Reform totaled JPY-174.5bn in FY3/26 (recorded in other income/loss), by segment: Connect JPY-0.2bn, Electric Works JPY-12.8bn, HVAC & CC JPY-8.2bn, Energy JPY0.0bn, Industry JPY-56.1bn, Smart Life JPY-69.4bn, and Other (including Panasonic Holdings Corporation and Panasonic Operational Excellence Co., Ltd.) JPY-27.8bn. The effect of restructuring (included in adjusted operating profit) totaled JPY45.0bn in FY3/26, by segment: Connect +1.0bn, Electric Works +3.0bn, HVAC & CC +5.0bn, Industry +9.0bn, Smart Life +12.0bn, and Other +15.0bn. Key initiatives included headcount reduction of 12,000 through streamlining and improving efficiency in indirect functions and marketing & sales departments, and site integration/closure. Structural reform under Group Management Reform was completed in FY3/26 as planned, and the cumulative effect of structural reform in FY3/27 is expected to reach JPY145.0bn versus FY3/25 (FY3/26: +45.0bn; FY3/27: +100.0bn), unchanged from the announcement of FY3/26 3Q results.
AI Infrastructure and Data Center Demand (Energy, Industry)
In Energy’s Industrial/Consumer business, demand for distributed power supply systems for AI data centers has shown a stronger growth trajectory since the IR Day in December 2025; the company’s target of JPY800.0bn in sales for energy storage systems for data centers (including generative-AI servers) is now expected to be achieved one year ahead of plan in FY3/28, with approximately threefold growth targeted in FY3/29 compared with FY3/26. To support this, Panasonic is expanding cell production capacity in Japan (approximately 3x versus FY3/26, utilizing existing In-vehicle production lines at Suminoe, with shipments started in April 2026) and in North America (a decision to introduce a data center production line at the Kansas factory, plus enhancement of existing production lines and preparation to build a new factory, both in Mexico). In Industry, the company is expanding the scope of its AI-related sales disclosure beyond the ‘AI semiconductor-related area’ to include ‘Infrastructure’ and ‘Edge’ areas; Infrastructure area sales are expected to increase approximately 2x versus FY3/26, targeting approximately 2x sales growth over three years with a double-digit operating profit margin, while the Edge area is expected to see full-scale expansion from FY3/29 onward. Enhancement initiatives include new multi-layer circuit board material production lines at the Suzhou Plant (scheduled for FY3/27 3Q) and Guangzhou Plant (scheduled for FY3/28 1Q), following a new facility in Thailand, plus additional conductive polymer capacitor production lines in Japan and overseas, and the start of mass-production of super-capacitors for Panasonic Energy’s CBUs, scheduled during FY3/27.
Energy: In-Vehicle Battery Business
Panasonic Energy’s In-vehicle battery sales volume at North American factories was 38.1GWh per year in FY3/25 and 38.7GWh per year in FY3/26, with the company maintaining sales volume at the previous year’s level by leveraging its North American production capabilities, despite a deteriorated US EV market following the termination of IRA Section 30D. For FY3/27, the company forecasts sales volume of 46GWh per year, assuming strong demand aligned with customers’ product strategies, while the US EV market is expected to remain broadly at the same level YoY. Key initiatives include increasing utilization of the Kansas factory to produce higher-capacity batteries, with plans to introduce such production at the Nevada factory, and expanding the customer base by starting production for Lucid (in FY3/27 1H) and for Zoox (from FY3/27 2H onward).
Business Portfolio Management
During FY3/26, Panasonic Holdings made steady progress in Business Portfolio Management. The share transfer of Housing Solutions-related businesses to YKK Corporation was completed on March 31, 2026, and the entities became equity-method affiliates of Panasonic Holdings Corporation. The transfer of all shares of Ficosa International, S.A. was completed on March 27, 2026. For the Electric Works power tools business, a share transfer agreement was entered into on March 24, 2026, to carve out the business into a newly established company and subsequently transfer all shares to Makita Corporation, with completion scheduled during FY3/27. For the Connect security systems business, the sales and marketing functions were transferred to i-PRO Corporation in March 2026, completing the transfer of the business (manufacturing and planning functions had previously been transferred to i-PRO in 2019). For the Industry segment’s automotive motor and automotive cooling fan motor business, a final agreement was scheduled for May 13, 2026, regarding a transfer of all shares to MinebeaMitsumi Inc., with completion of the transfer scheduled for November 2, 2026.
This article is an analysis based on publicly available information and is not a recommendation to buy or sell any specific securities. Investment decisions are your own responsibility.
![[Obayashi] Investors’ Guide 2026 — The Complete 24-Article Breakdown](https://japan-equity.com/wp-content/uploads/2026/07/hub_cover-1024x1024.png)
![[Obayashi] IR & SR Policy — Feeding Dialogue Back into Management](https://japan-equity.com/wp-content/uploads/2026/07/p32_sq-1024x1024.jpg)
![[Obayashi] Real Estate Development — 18.7% Margin, ¥287.7bn Unrealized Gains](https://japan-equity.com/wp-content/uploads/2026/07/p20_sq-1024x1024.jpg)
![[Obayashi] Domestic Civil Engineering — Resilience Spending Supports 9.6% Margin](https://japan-equity.com/wp-content/uploads/2026/07/p11_sq-1024x1024.jpg)
![[Obayashi] Share Price & External Ratings — vs TOPIX, ESG Index Inclusion](https://japan-equity.com/wp-content/uploads/2026/07/p40_sq-1024x1024.jpg)
![[Construction] ¥75.5tn Investment, Shrinking Workforce — Big-5 Market Share](https://japan-equity.com/wp-content/uploads/2026/07/p12_sq-1024x1024.jpg)



![[Obayashi] Capital Policy & Shareholder Returns — ROE 10%+, DOE ~5%, ¥100bn Buyback](https://japan-equity.com/wp-content/uploads/2026/07/p27_sq-1024x1024.jpg)
![[Obayashi] Reducing Cross-Shareholdings — ¥285.2bn Sold in Five Years](https://japan-equity.com/wp-content/uploads/2026/07/p29_sq-1024x1024.jpg)
![[Obayashi] ¥750bn Investment Plan — ¥300bn to Development, ¥190bn to Tech/DX](https://japan-equity.com/wp-content/uploads/2026/07/p30_sq-1024x1024.jpg)
![[Obayashi] MTP2022 KPIs — Operating Profit ~2x Target, ROE 14.4%](https://japan-equity.com/wp-content/uploads/2026/07/p25_sq-1024x1024.jpg)
![[Obayashi] Cash Allocation — ¥420bn Investment CF Over Five Years](https://japan-equity.com/wp-content/uploads/2026/07/p26_sq-1024x1024.jpg)
![[Obayashi] Green Energy — 44 Plants, 344MW, and the Green Hydrogen Challenge](https://japan-equity.com/wp-content/uploads/2026/07/p21_sq-1024x1024.jpg)
![[Obayashi] Tackling the Labor Shortage — Robotics Construction®](https://japan-equity.com/wp-content/uploads/2026/07/p14_sq-1024x1024.jpg)
