
This article is based on publicly available IR materials and is not a recommendation to buy or sell any specific securities.
Note: Socionext labels the fiscal year ended March 31, 2026 as “FY2026/3” (and the prior year as “FY2025/3”); this site classifies it as FY2025, while the labels in the body, tables and figures below follow the company’s materials. Socionext Inc. (6526) released its presentation “Consolidated Financial Results and Growth Strategy, Fiscal Year Ended March 31, 2026” dated April 28, 2026. Net sales rose 6.5% year on year to 200.8 billion yen, driven by higher product revenue, while operating income fell 50.6% to 12.4 billion yen and net income fell 55.4% to 8.7 billion yen as product gross margin declined. Both net sales and operating income exceeded the forecast made in October 2025. For FY2027/3 the company forecasts net sales of 215.0 billion yen (+7.1%), operating income of 14.0 billion yen and net income of 10.0 billion yen on an assumed rate of 130.0 yen to the US dollar, with the dividend per share unchanged at 50.00 yen. Design Win Balance at the end of FY2026/3 totaled 1.51 trillion yen, up 170 billion yen from a year earlier.
Consolidated Results (Full-Year Actual, FY2026/3)
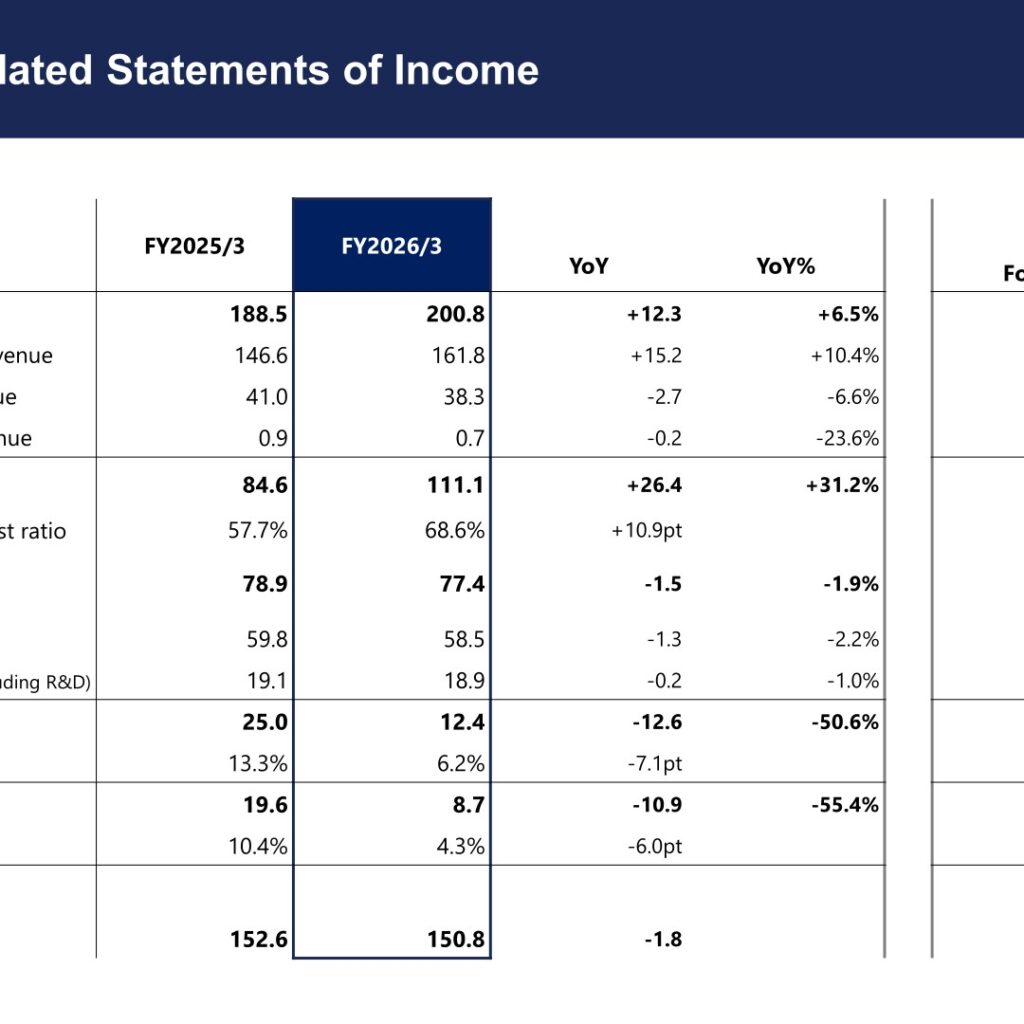
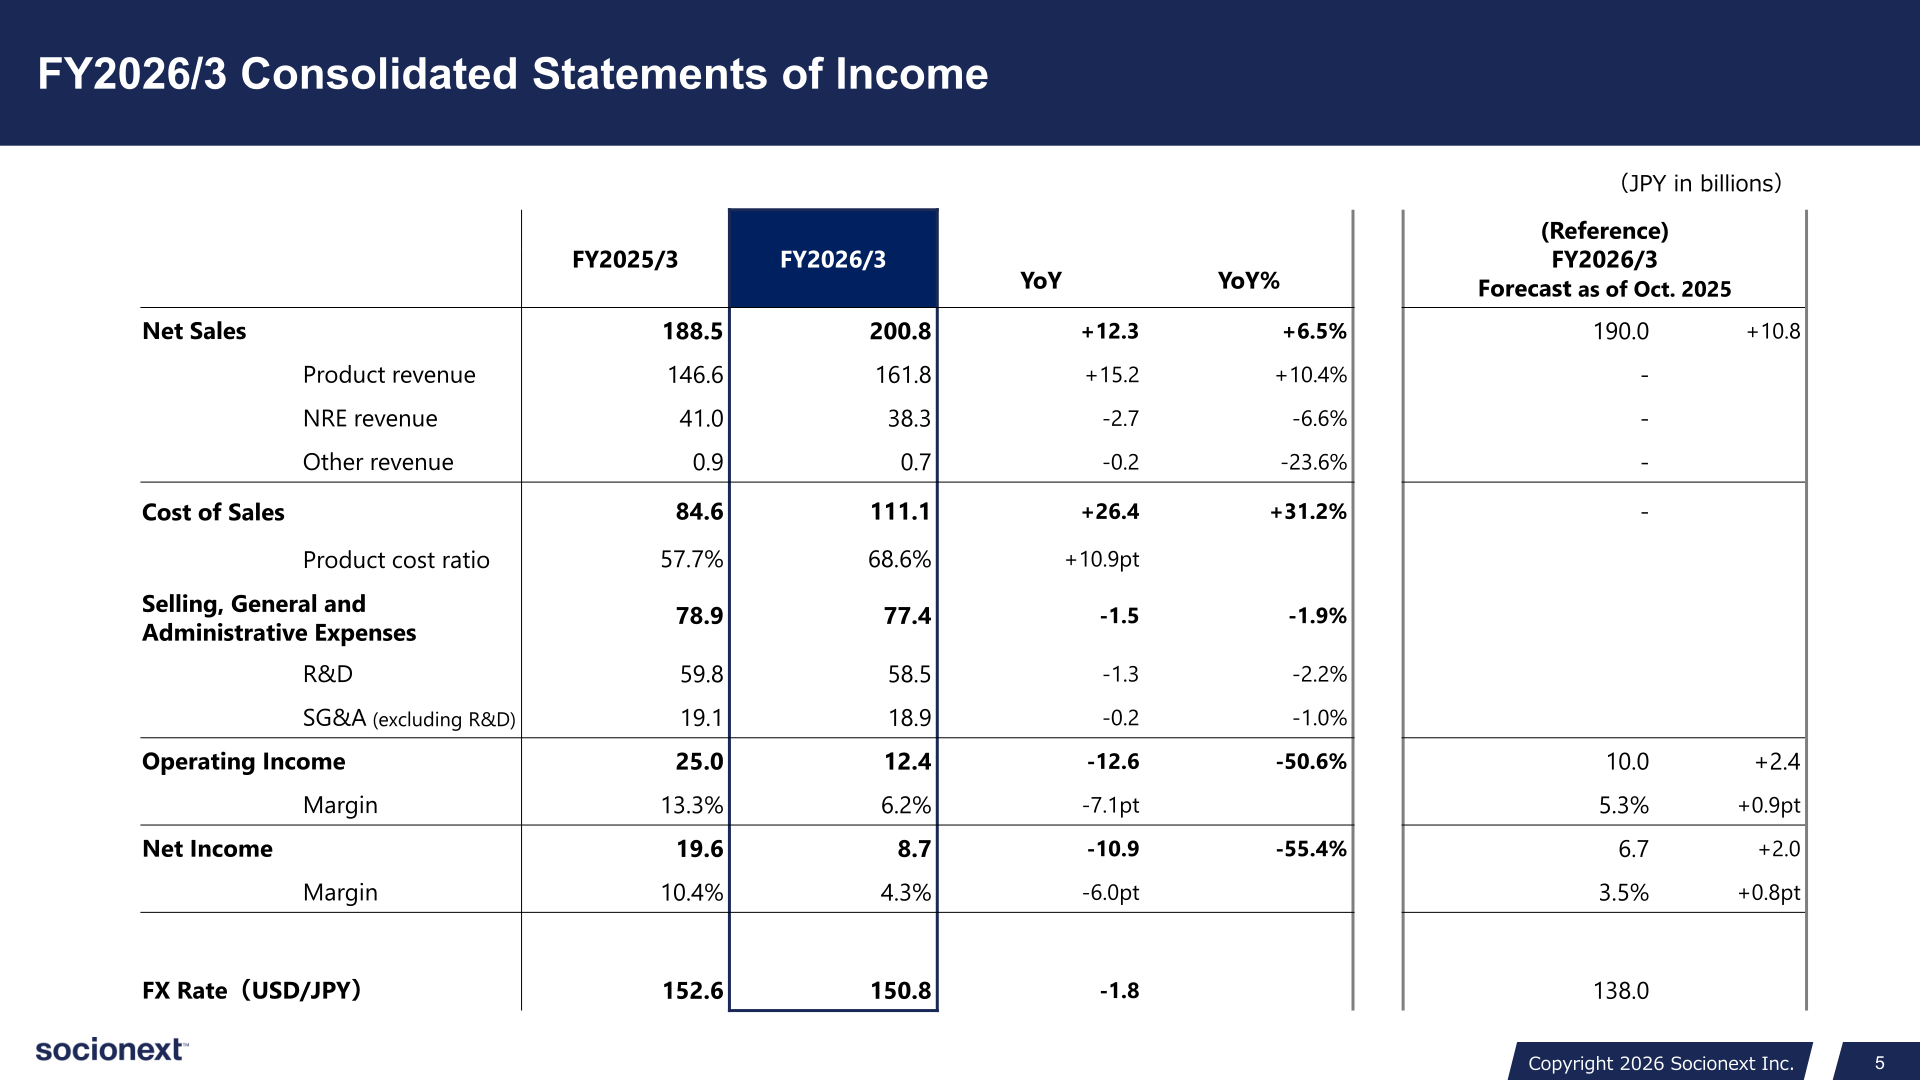
Net sales were 200.8 billion yen, up 12.3 billion yen (+6.5%) from 188.5 billion yen in FY2025/3. Product revenue increased 15.2 billion yen (+10.4%) to 161.8 billion yen (FX impact +0.3 billion yen), NRE revenue decreased 2.7 billion yen (-6.6%) to 38.3 billion yen, and other revenue was 0.7 billion yen (-23.6%). Cost of sales rose 31.2% to 111.1 billion yen and the product cost ratio rose 10.9pt to 68.6%. Selling, general and administrative expenses decreased 1.9% to 77.4 billion yen (R&D 58.5 billion yen, -2.2%; SG&A excluding R&D 18.9 billion yen, -1.0%). Operating income was 12.4 billion yen, down 12.6 billion yen (-50.6%), with the operating margin falling 7.1pt to 6.2%. In the operating income analysis, product gross profit contributed -12.0 billion yen, NRE revenue -2.7 billion yen, R&D, SG&A, etc. +1.2 billion yen and FX impact +0.9 billion yen. Net income was 8.7 billion yen, down 10.9 billion yen (-55.4%), for a net margin of 4.3%. The average USD/JPY rate was 150.8 yen versus 152.6 yen a year earlier. Compared with the October 2025 forecast (net sales 190.0 billion yen, operating income 10.0 billion yen, net income 6.7 billion yen), net sales were 10.8 billion yen higher despite a shift in NRE and product revenues to FY2027/3, and operating income was 2.4 billion yen higher as FX contributed to the increase. The product gross margin for FY2026/3 was 31.4% (42.3% in FY2025/3), and the company states that the margin decreased by several percentage points compared with the April 2025 forecast, due to more-than-forecast volume in the early mass production phase of a large-scale project, delays in the cost improvement curve, and higher-than-forecast costs.
| Item (JPY in billions) | FY2025/3 | FY2026/3 | YoY | YoY% |
|---|---|---|---|---|
| Net Sales | 188.5 | 200.8 | +12.3 | +6.5% |
| Product revenue | 146.6 | 161.8 | +15.2 | +10.4% |
| NRE revenue | 41.0 | 38.3 | -2.7 | -6.6% |
| Other revenue | 0.9 | 0.7 | -0.2 | -23.6% |
| Cost of Sales | 84.6 | 111.1 | +26.4 | +31.2% |
| Product cost ratio | 57.7% | 68.6% | +10.9pt | – |
| Selling, General and Administrative Expenses | 78.9 | 77.4 | -1.5 | -1.9% |
| R&D | 59.8 | 58.5 | -1.3 | -2.2% |
| SG&A (excluding R&D) | 19.1 | 18.9 | -0.2 | -1.0% |
| Operating Income | 25.0 | 12.4 | -12.6 | -50.6% |
| Operating Margin | 13.3% | 6.2% | -7.1pt | – |
| Net Income | 19.6 | 8.7 | -10.9 | -55.4% |
| Net Margin | 10.4% | 4.3% | -6.0pt | – |
| FX Rate (USD/JPY) | 152.6 | 150.8 | -1.8 | – |
In the fourth quarter (January to March 2026), net sales were 58.7 billion yen, up 15.4 billion yen (+35.6%) year on year and up 3.8 billion yen (+6.9%) quarter on quarter; product revenue was 47.1 billion yen and NRE revenue 11.5 billion yen. Operating income was 5.2 billion yen (+18.7% YoY, +49.8% QoQ) with an operating margin of 8.8%, and net income was 4.0 billion yen. The company notes that quarterly figures are highly volatile as they are greatly affected by the development status of individual projects. On the balance sheet as of March 31, 2026, total assets were 167.6 billion yen (-2.7 billion yen), cash on-hand and in banks 44.5 billion yen (-28.3 billion yen), inventories 31.1 billion yen (+14.0 billion yen), total net assets 133.1 billion yen (-4.0 billion yen) and the shareholders’ equity ratio 79.4% (80.5% a year earlier).
Revenue Breakdown and Design Wins
Socionext reports as a single business and breaks down net sales into product revenue, NRE revenue and other revenue; the materials also show percentage breakdowns by application market (Automotive, Data Center & Networking, Smart Devices, Industrial, Other), by geographic region (US, China, Japan, Other) and by process node in chart form. On net sales trends, the company states that in the first half of FY2026/3 net sales exceeded forecast driven by stronger demand for new automotive product, although demand for the Chinese telecommunication equipment business decreased due to ongoing customer inventory adjustment, and that in the second half demand for new Chinese automotive product, among other factors, exceeded forecast.
| Revenue category (JPY in billions) | FY2025/3 | FY2026/3 | YoY | YoY% |
|---|---|---|---|---|
| Product revenue | 146.6 | 161.8 | +15.2 | +10.4% |
| NRE revenue | 41.0 | 38.3 | -2.7 | -6.6% |
| Other revenue | 0.9 | 0.7 | -0.2 | -23.6% |
| Net Sales (total) | 188.5 | 200.8 | +12.3 | +6.5% |
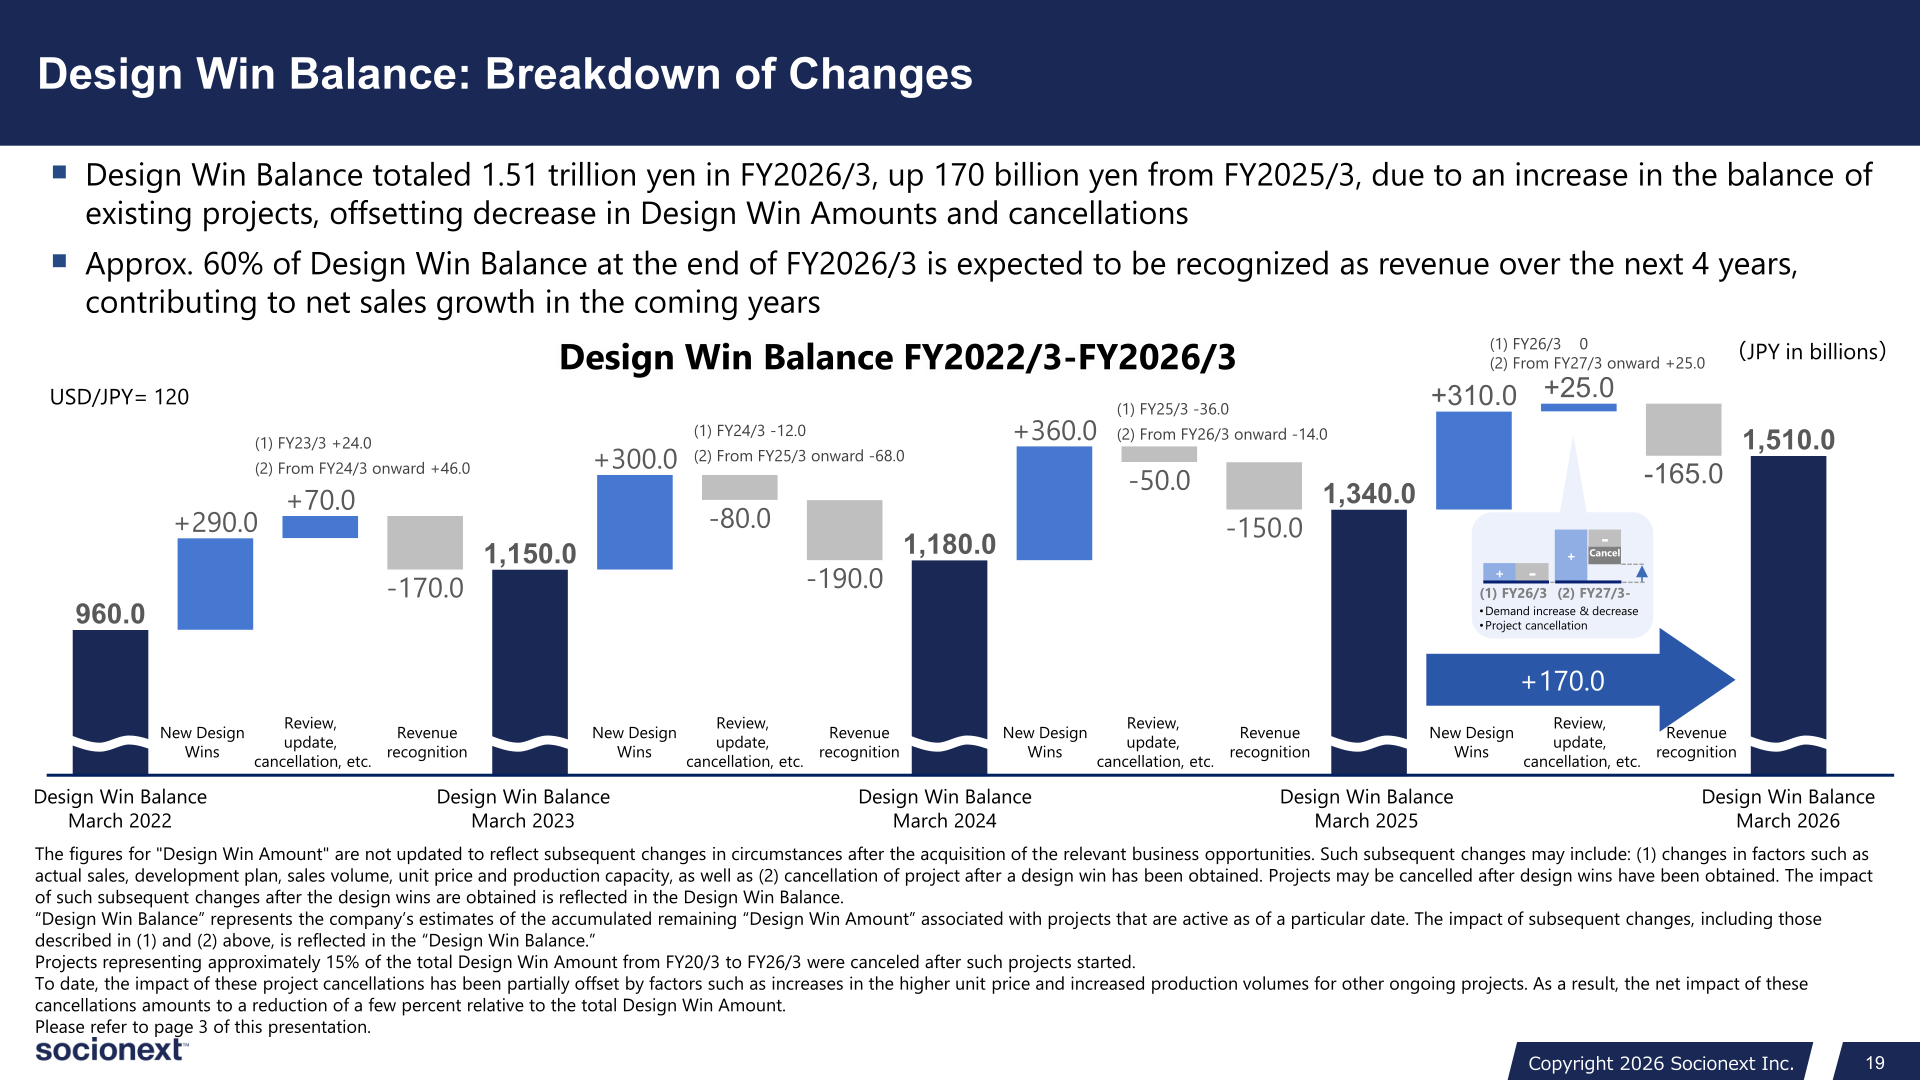
Design Win Amount acquired in FY2026/3 totaled approximately 310 billion yen (USD/JPY=120 basis), with large-scale projects secured primarily in the Data Center & Networking sector, though the amount was lower than in FY2025/3 (approx. 360 billion yen), mainly due to the high level of design wins in 4Q FY2025/3, FY2026/3 being a transitional period between major design wins, and the closing of several design wins shifting to the first half of FY2027/3. Design Win Balance totaled 1.51 trillion yen at the end of FY2026/3, up 170 billion yen from 1,340 billion yen at the end of FY2025/3, due to an increase in the balance of existing projects offsetting the decrease in Design Win Amounts and cancellations; the breakdown of the change was new design wins +310.0 billion yen, revenue recognition -165.0 billion yen and review, update, cancellation, etc. +25.0 billion yen. Approximately 60% of the Design Win Balance at the end of FY2026/3 is expected to be recognized as revenue over the next 4 years. By application market, the shares of Data Center & Networking and Industrial in the Design Win Balance increased in FY2026/3 while Automotive and Other declined; by region, the shares of the US and Japan increased slightly while a well-balanced mix across the US, Japan and other regions including China was maintained. The company notes that projects representing approximately 15% of total Design Win Amount from FY20/3 to FY26/3 were canceled after such projects started, with the net impact of these cancellations amounting to a reduction of a few percent relative to the total Design Win Amount.
FY2027/3 Forecast
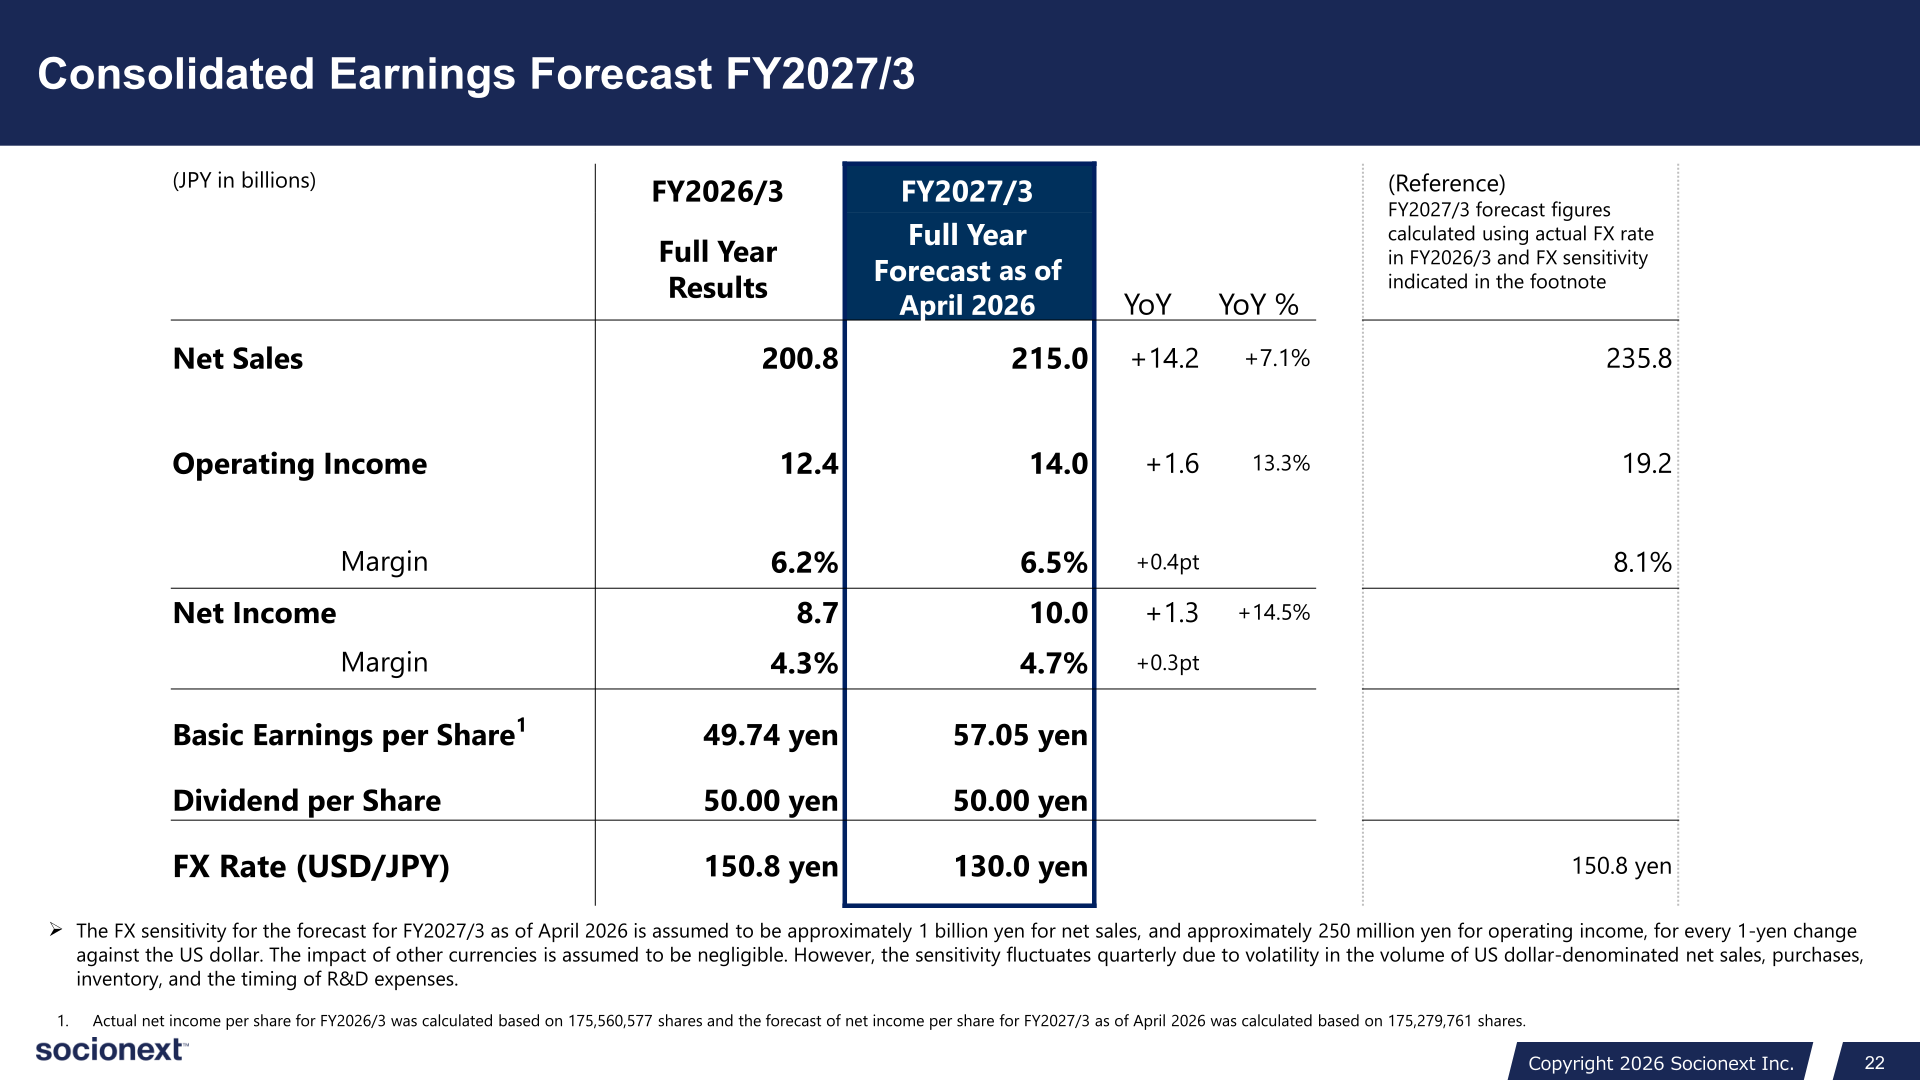
For FY2027/3 (the fiscal year ending March 31, 2027), the company forecasts net sales of 215.0 billion yen (+14.2 billion yen, +7.1%), operating income of 14.0 billion yen (+1.6 billion yen, +13.3%; operating margin 6.5%, +0.4pt) and net income of 10.0 billion yen (+1.3 billion yen, +14.5%; margin 4.7%), assuming a USD/JPY rate of 130.0 yen. Basic earnings per share are forecast at 57.05 yen (49.74 yen in FY2026/3). As a reference, the materials show that the forecast calculated using the actual FY2026/3 FX rate of 150.8 yen and the FX sensitivity would be net sales of 235.8 billion yen and operating income of 19.2 billion yen (margin 8.1%). The FX sensitivity for FY2027/3 is assumed to be approximately 1 billion yen for net sales and approximately 250 million yen for operating income for every 1-yen change against the US dollar. Product revenue is expected to increase with new mass production of US automotive, data center and other products and a full-year contribution from the Chinese automotive product, partly offset by a decrease in the Chinese telecommunication equipment product and FX impact; NRE revenue, etc. is expected to increase slightly. Product gross margin is expected to slightly decrease compared with FY2026/3 due to the start of a new large-scale advanced product, a higher-than-forecast share of large-scale projects and higher-than-forecast costs (yield, testing and other manufacturing costs, etc.), while R&D and SG&A expenses are expected to increase. The company expects strong demand for Chinese automotive products to continue in the first half, revenue growth in the second half driven by the start of new mass production for US automotive and data center products, and the operating margin to be low in the first half and start improving in the second half. Mass production at 7nm is currently underway for the automotive business and 5nm mass production is scheduled to start in FY27/3.
| Item (JPY in billions) | FY2026/3 Full Year Results | FY2027/3 Full Year Forecast (as of April 2026) | YoY | YoY % | (Reference) FY2027/3 at FY2026/3 actual FX rate |
|---|---|---|---|---|---|
| Net Sales | 200.8 | 215.0 | +14.2 | +7.1% | 235.8 |
| Operating Income | 12.4 | 14.0 | +1.6 | 13.3% | 19.2 |
| Operating Margin | 6.2% | 6.5% | +0.4pt | – | 8.1% |
| Net Income | 8.7 | 10.0 | +1.3 | +14.5% | – |
| Net Margin | 4.3% | 4.7% | +0.3pt | – | – |
| Basic Earnings per Share | 49.74 yen | 57.05 yen | – | – | – |
| Dividend per Share | 50.00 yen | 50.00 yen | – | – | – |
| FX Rate (USD/JPY) | 150.8 yen | 130.0 yen | – | – | 150.8 yen |
Shareholder Returns
The dividend per share for FY2026/3 was 50.00 yen, and the company forecasts a dividend per share of 50.00 yen for FY2027/3. Basic earnings per share for FY2026/3 were 49.74 yen (calculated based on 175,560,577 shares), and the FY2027/3 forecast of 57.05 yen is based on 175,279,761 shares. Details of any share buyback policy cannot be confirmed from the materials.
| Item | FY2026/3 (Result) | FY2027/3 (Forecast) |
|---|---|---|
| Dividend per Share | 50.00 yen | 50.00 yen |
| Basic Earnings per Share | 49.74 yen | 57.05 yen |
Medium-Term Targets and Growth Strategy
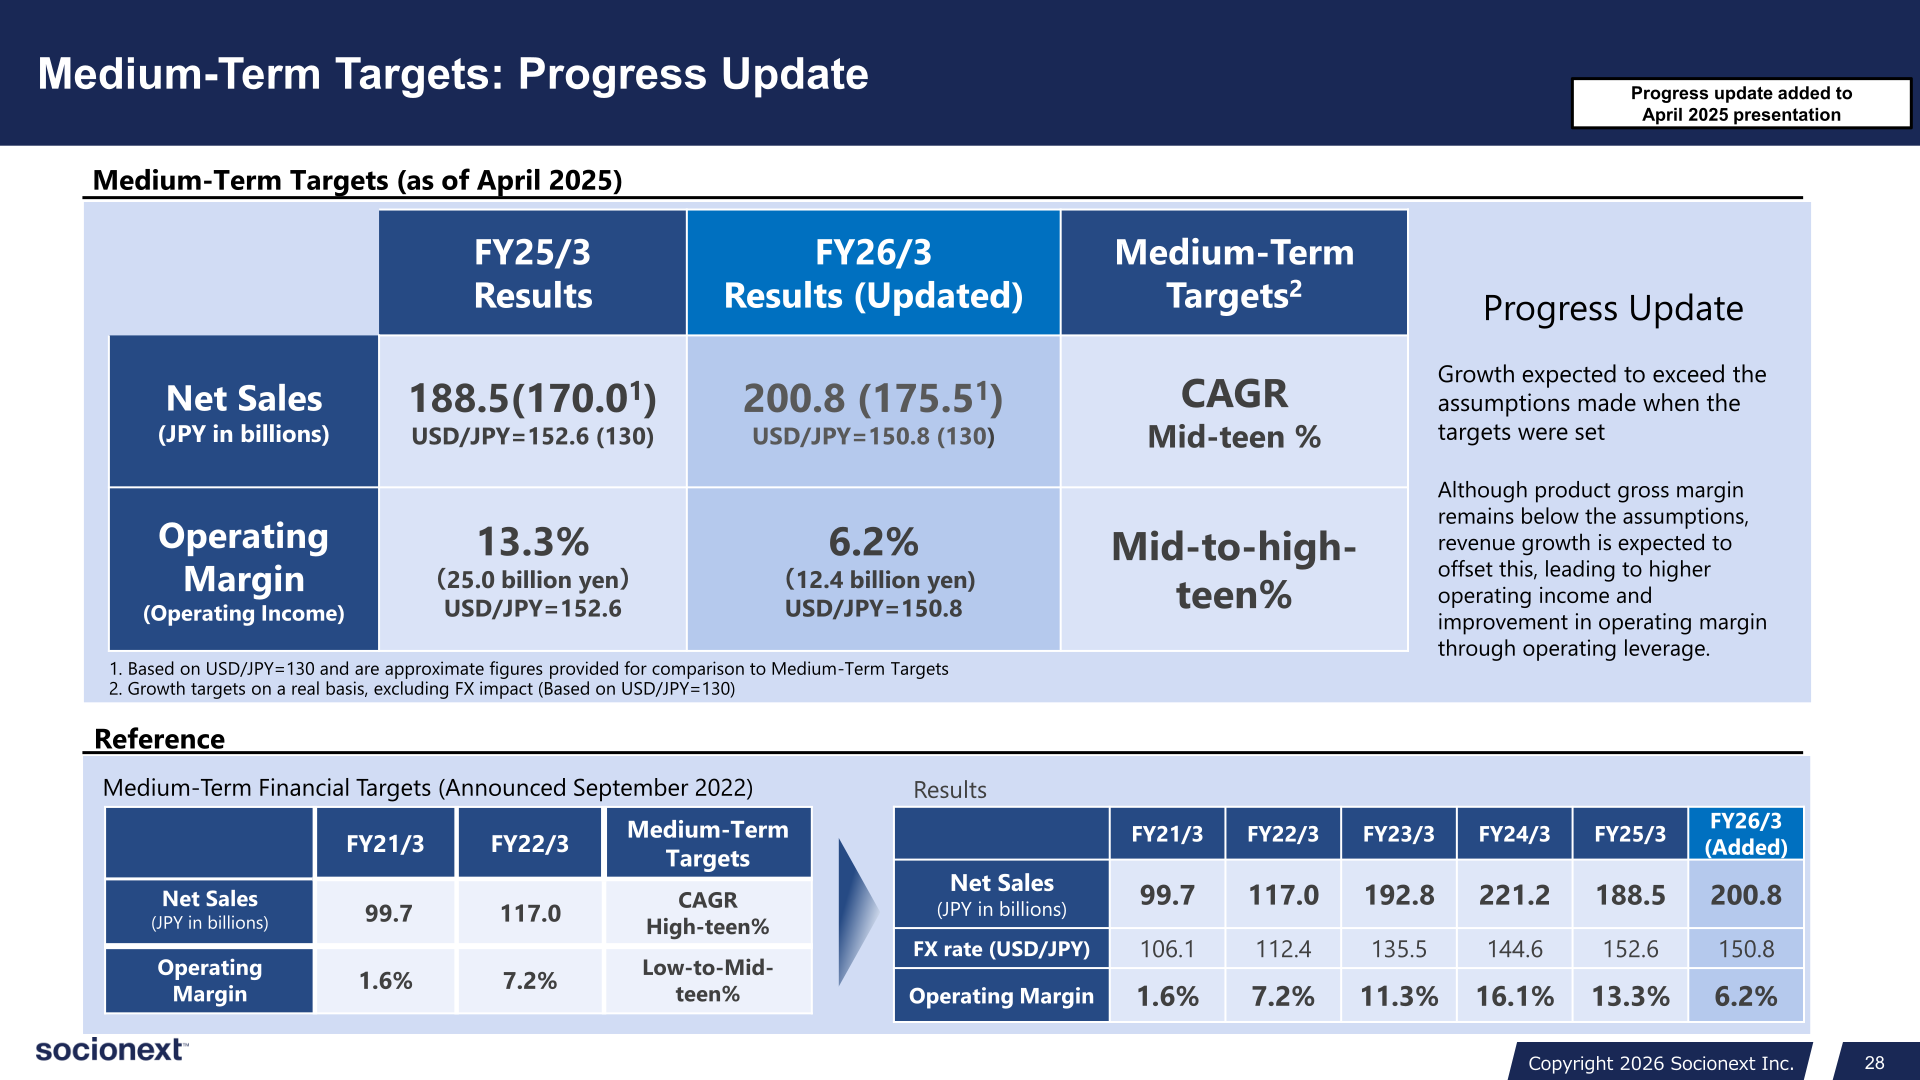
Against the Medium-Term Targets announced in September 2022 (net sales CAGR in the mid-teen % on a real basis excluding FX impact at USD/JPY=130, and an operating margin in the mid-to-high-teen %), FY2026/3 net sales were 200.8 billion yen (approximately 175.5 billion yen on a USD/JPY=130 basis, versus 170.0 billion yen for FY2025/3 on the same basis) and the operating margin was 6.2% (operating income 12.4 billion yen). The company states that growth is expected to exceed the assumptions made when the targets were set, and that although product gross margin remains below the assumptions, revenue growth is expected to offset this, leading to higher operating income and an improvement in operating margin through operating leverage. For FY2028/3 and beyond, net sales are expected to exceed the Medium-Term Targets assumptions, with product revenue growth supported by multiple large-scale projects including those for automotive and data center, and a gradual increase in NRE revenue; the R&D ratio is expected to continue decreasing due to leverage from net sales growth while aggressive investment in leading-edge technologies continues. Under its growth strategy, Socionext describes a “Second Transformation” following the “First Transformation” (shift in business model and focus areas), comprising reorganizing and strengthening the R&D structure, investing in leading-edge technologies (2nm/1.8nm/1.4nm nodes, chiplets, 3D/5.5D packaging, high-speed SerDes, CPO), and strengthening and globalizing corporate management, including a global co-lead structure for the development division and the opening of an office in India under the U.S. subsidiary. The company reports that a hyperscaler CPU project is ongoing, that it has acquired design wins for several AI custom SoCs, and that it has acquired multiple design wins for Flexlets (IO Chiplet), its configurable chiplet platform launched in October 2025. Operating results by quarter and historical trends for FY21/3 to FY26/3 (net sales of 99.7, 117.0, 192.8, 221.2, 188.5 and 200.8 billion yen; operating margins of 1.6%, 7.2%, 11.3%, 16.1%, 13.3% and 6.2%) are provided in the materials.
This article is an analysis based on publicly available information and is not a recommendation to buy or sell any specific securities. Investment decisions are your own responsibility.
![[Obayashi] Investors’ Guide 2026 — The Complete 24-Article Breakdown](https://japan-equity.com/wp-content/uploads/2026/07/hub_cover-1024x1024.png)
![[Obayashi] IR & SR Policy — Feeding Dialogue Back into Management](https://japan-equity.com/wp-content/uploads/2026/07/p32_sq-1024x1024.jpg)
![[Obayashi] Domestic Civil Engineering — Resilience Spending Supports 9.6% Margin](https://japan-equity.com/wp-content/uploads/2026/07/p11_sq-1024x1024.jpg)
![[Obayashi] Overseas Construction — Orders Reach ¥1.2tn](https://japan-equity.com/wp-content/uploads/2026/07/p15_sq-1024x1024.jpg)
![[Obayashi] Share Price & External Ratings — vs TOPIX, ESG Index Inclusion](https://japan-equity.com/wp-content/uploads/2026/07/p40_sq-1024x1024.jpg)
![[Construction] ¥75.5tn Investment, Shrinking Workforce — Big-5 Market Share](https://japan-equity.com/wp-content/uploads/2026/07/p12_sq-1024x1024.jpg)



![[Obayashi] Capital Policy & Shareholder Returns — ROE 10%+, DOE ~5%, ¥100bn Buyback](https://japan-equity.com/wp-content/uploads/2026/07/p27_sq-1024x1024.jpg)
![[Obayashi] Reducing Cross-Shareholdings — ¥285.2bn Sold in Five Years](https://japan-equity.com/wp-content/uploads/2026/07/p29_sq-1024x1024.jpg)
![[Obayashi] ¥750bn Investment Plan — ¥300bn to Development, ¥190bn to Tech/DX](https://japan-equity.com/wp-content/uploads/2026/07/p30_sq-1024x1024.jpg)
![[Obayashi] MTP2022 KPIs — Operating Profit ~2x Target, ROE 14.4%](https://japan-equity.com/wp-content/uploads/2026/07/p25_sq-1024x1024.jpg)
![[Obayashi] Cash Allocation — ¥420bn Investment CF Over Five Years](https://japan-equity.com/wp-content/uploads/2026/07/p26_sq-1024x1024.jpg)
![[Obayashi] Green Energy — 44 Plants, 344MW, and the Green Hydrogen Challenge](https://japan-equity.com/wp-content/uploads/2026/07/p21_sq-1024x1024.jpg)
![[Obayashi] Tackling the Labor Shortage — Robotics Construction®](https://japan-equity.com/wp-content/uploads/2026/07/p14_sq-1024x1024.jpg)
