
This article is based on publicly available IR materials and is not a recommendation to buy or sell any specific securities.
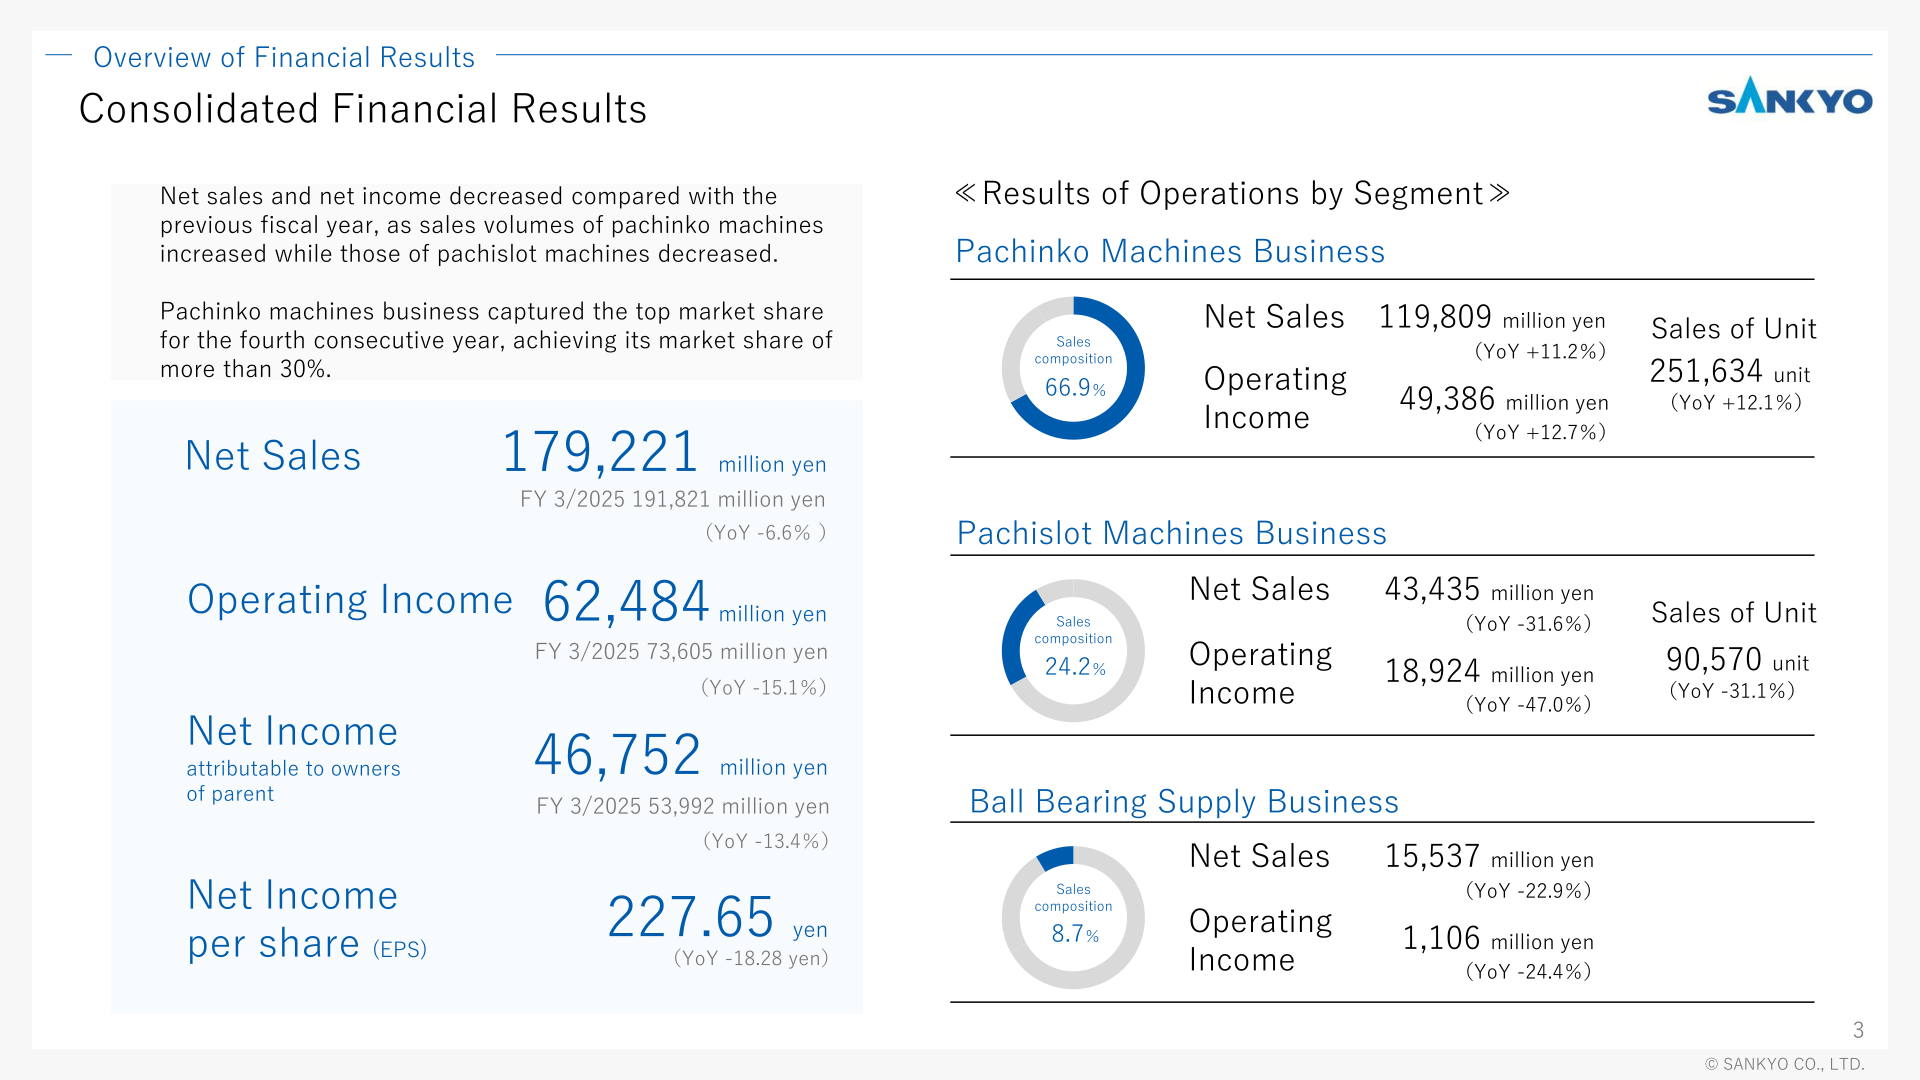
SANKYO CO., LTD. (6417) released its “Presentation on Business Results of FY 3/2026” dated May 13, 2026. Note: the company labels the fiscal year from April 1, 2025 to March 31, 2026 as “FY 3/2026”; this site classifies it as FY2025, and the labels in the body and tables below follow the company’s materials. Consolidated net sales decreased 6.6% year on year to 179,211 million yen, operating income fell 15.1% to 62,484 million yen, and net income attributable to owners of parent declined 13.4% to 46,752 million yen, as sales volumes of pachinko machines increased while those of pachislot machines decreased. The pachinko machines business captured the top market share for the fourth consecutive year with a share of more than 30%. For FY 3/2027 the company forecasts net sales of 174,000 million yen (YoY -2.9%) and operating income of 56,000 million yen (YoY -10.4%), and has revised its Mid-Term Management Plan figures downward; the annual dividend is 90 yen for FY 3/2026 and a forecast 80 yen for FY 3/2027.
Consolidated Results (Full-Year Actual, FY 3/2026)
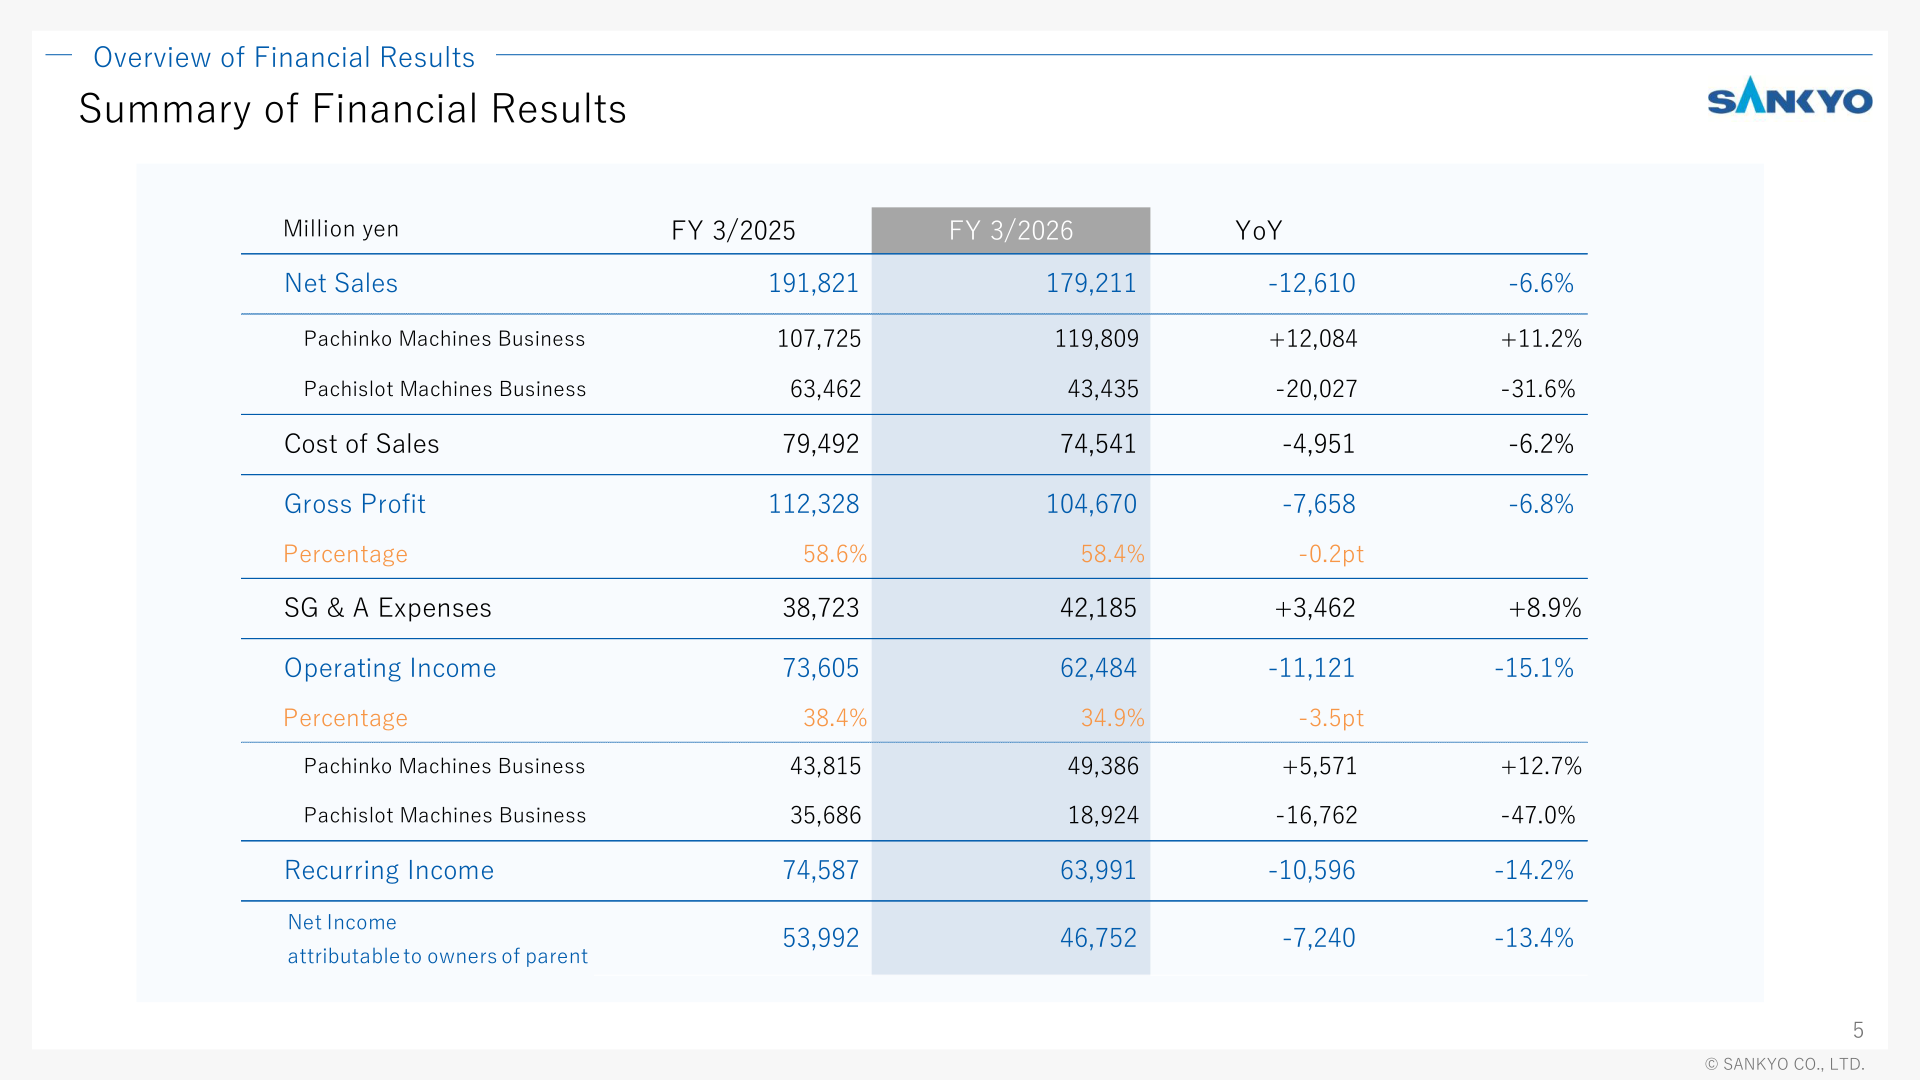
Net sales were 179,211 million yen, down 12,610 million yen (-6.6%) from 191,821 million yen in FY 3/2025. By business, pachinko machines rose 12,084 million yen (+11.2%) to 119,809 million yen, pachislot machines fell 20,027 million yen (-31.6%) to 43,435 million yen, ball bearing supply fell 4,624 million yen (-22.9%) to 15,537 million yen, and other business fell 44 million yen (-9.3%) to 428 million yen. Cost of sales declined 6.2% to 74,541 million yen and gross profit declined 6.8% to 104,670 million yen (gross margin 58.4%, -0.2pt). SG&A expenses increased 8.9% to 42,185 million yen, with R&D expenses up 3,100 million yen (+16.8%) to 21,559 million yen and sales commission up 1,647 million yen (+33.2%) to 6,603 million yen, while advertising expenses fell 295 million yen (-10.9%) to 2,400 million yen and salaries & wages fell 753 million yen (-18.4%) to 3,341 million yen. Operating income was 62,484 million yen (-11,121 million yen, -15.1%; operating margin 34.9%, -3.5pt), recurring income was 63,991 million yen (-14.2%), and net income attributable to owners of parent was 46,752 million yen (-7,240 million yen, -13.4%). EPS was 227.65 yen (-18.28 yen). ROE was 17.6% (20.2% in FY 3/2025).
| Item (Million yen) | FY 3/2025 | FY 3/2026 | YoY | YoY % |
|---|---|---|---|---|
| Net Sales | 191,821 | 179,211 | -12,610 | -6.6% |
| Pachinko Machines Business | 107,725 | 119,809 | +12,084 | +11.2% |
| Pachislot Machines Business | 63,462 | 43,435 | -20,027 | -31.6% |
| Ball Bearing Supply Business | 20,161 | 15,537 | -4,624 | -22.9% |
| Other Business | 472 | 428 | -44 | -9.3% |
| Cost of Sales | 79,492 | 74,541 | -4,951 | -6.2% |
| Gross Profit | 112,328 | 104,670 | -7,658 | -6.8% |
| Gross Profit Percentage | 58.6% | 58.4% | -0.2pt | – |
| SG & A Expenses | 38,723 | 42,185 | +3,462 | +8.9% |
| Operating Income | 73,605 | 62,484 | -11,121 | -15.1% |
| Operating Income Percentage | 38.4% | 34.9% | -3.5pt | – |
| Recurring Income | 74,587 | 63,991 | -10,596 | -14.2% |
| Net Income attributable to owners of parent | 53,992 | 46,752 | -7,240 | -13.4% |
| EPS (yen) | 245.93 | 227.65 | -18.28 | – |
On the balance sheet, total assets as of March 31, 2026 were 287,458 million yen, down 49,251 million yen from 336,709 million yen a year earlier, with total current assets of 229,956 million yen (-64,585 million yen; quick assets 204,422 million yen, -58,020 million yen) and total fixed assets of 57,501 million yen (+15,334 million yen). Total liabilities were 37,302 million yen (-14,402 million yen), mainly reflecting a decrease in accrued income taxes. The company cites the addition of net income and the deduction of cash dividends paid and the repurchase of treasury stock as the main factors of change in net assets. Capital expenditure rose to 16,941 million yen from 4,005 million yen.
Segment Results
Pachinko Machines Business: net sales increased 12,084 million yen (+11.2%) to 119,809 million yen and operating income increased 5,571 million yen (+12.7%) to 49,386 million yen (operating margin 41.2%, +0.5pt). Machine sales volume rose 27,137 units to 251,634 units; SANKYO+JB brand sales fell 19,789 units to 149,524 units (frames 65,606 units, gauge boards 83,918 units) while Bisty brand sales rose 46,926 units to 102,110 units (frames 72,798 units, gauge boards 29,312 units). The company released nine new titles (reused models etc.: fourteen), with sales volume up due to the extensive line-up, mainstay titles, new tie-up titles featuring popular anime series and machines equipped with “LUCKY TRIGGER 3.0 PLUS.” According to the presentation, “e Tokyo Ghoul” became the most popular model representing 2025, and the latest title in the flagship “Evangelion” series also showed steady performance with additional production. SANKYO’s pachinko machine market share (unit basis) was 31.4% in 2025 (26.5% in 2024).
Pachislot Machines Business: net sales decreased 20,027 million yen (-31.6%) to 43,435 million yen and operating income decreased 16,762 million yen (-47.0%) to 18,924 million yen (operating margin 43.6%, -12.7pt). Machine sales volume fell 40,798 units to 90,570 units (SANKYO brand 59,700 units, -51,844 units; Bisty brand 30,870 units, +11,046 units). The Group released only four new titles due to delays in passing format inspections in some titles, but each title sold over 10,000 units and “L Pachislot Valvrave the Liberator 2” surpassed 30,000 units. The release of three titles initially scheduled for 4Q was rescheduled to the next fiscal year. SANKYO’s pachislot machine market share (unit basis) was 12.9% in 2025 (18.8% in 2024).
Ball Bearing Supply Business: net sales were 15,537 million yen (-22.9%) and operating income was 1,106 million yen (-24.4%). Other Business: net sales were 428 million yen and operating income was 192 million yen (+11 million yen).
| Segment | Metric | FY 3/2025 | FY 3/2026 | YoY |
|---|---|---|---|---|
| Pachinko Machines Business | Net Sales (million yen) | 107,725 | 119,809 | +12,084 |
| Pachinko Machines Business | Operating Income (million yen) | 43,815 | 49,386 | +5,571 |
| Pachinko Machines Business | Machines sales (units) | 224,497 | 251,634 | +27,137 |
| Pachislot Machines Business | Net Sales (million yen) | 63,462 | 43,435 | -20,027 |
| Pachislot Machines Business | Operating Income (million yen) | 35,686 | 18,924 | -16,762 |
| Pachislot Machines Business | Machines sales (units) | 131,368 | 90,570 | -40,798 |
| Ball Bearing Supply Business | Net Sales (million yen) | 20,161 | 15,537 | -4,624 |
| Ball Bearing Supply Business | Operating Income (million yen) | 1,463 | 1,106 | -357 |
| Other Business | Net Sales (million yen) | 472 | 428 | -44 |
| Other Business | Operating Income (million yen) | 181 | 192 | +11 |
FY 3/2027 Forecast
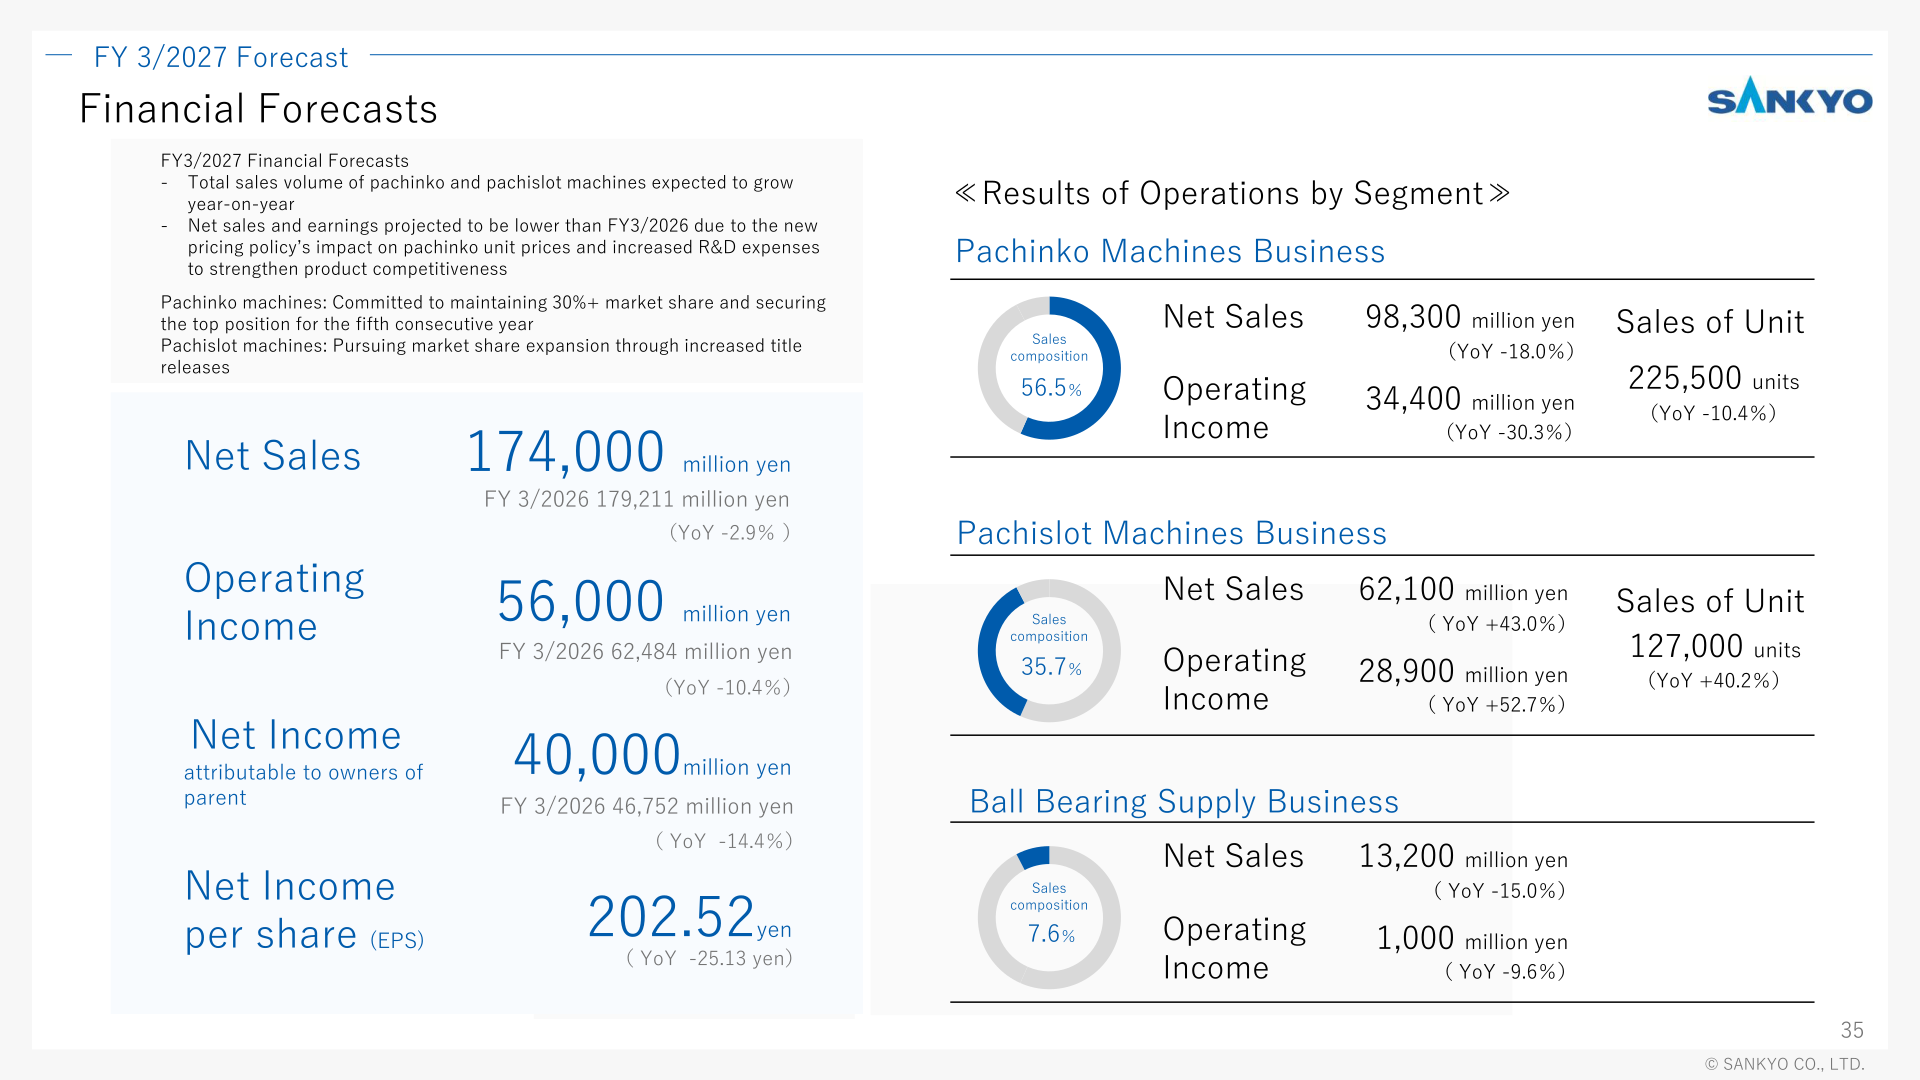
For FY 3/2027 (April 1, 2026 to March 31, 2027), the company forecasts net sales of 174,000 million yen (-5,211 million yen, -2.9%), operating income of 56,000 million yen (-6,484 million yen, -10.4%; operating margin 32.2%), recurring income of 58,000 million yen (-9.4%), net income attributable to owners of parent of 40,000 million yen (-14.4%) and EPS of 202.52 yen. Total sales volume of pachinko and pachislot machines is expected to grow year on year, but net sales and earnings are projected to be lower than FY 3/2026 due to the new pricing policy’s impact on pachinko unit prices and increased R&D expenses to strengthen product competitiveness. SG&A expenses are forecast at 45,000 million yen (+6.7%), including R&D expenses of 22,764 million yen. By segment, pachinko machines are forecast at net sales of 98,300 million yen (-18.0%), operating income of 34,400 million yen (-30.3%) and sales of 225,500 units (eleven new titles planned); pachislot machines at net sales of 62,100 million yen (+43.0%), operating income of 28,900 million yen (+52.7%) and sales of 127,000 units (+40.2%; eight new titles planned); and ball bearing supply at net sales of 13,200 million yen (-15.0%) and operating income of 1,000 million yen. The company estimates the pachinko market at approximately 700 thousand units (YoY approx. -6%) and the pachislot market at approximately 750 thousand units (YoY approx. +0.3%) for FY 3/2027.
| Item (Million yen) | FY 3/2026 (Actual) | FY 3/2027 Forecast | YoY | YoY % |
|---|---|---|---|---|
| Net Sales | 179,211 | 174,000 | -5,211 | -2.9% |
| Pachinko Machines Business | 119,809 | 98,300 | -21,509 | -18.0% |
| Pachislot Machines Business | 43,435 | 62,100 | +18,665 | +43.0% |
| Ball Bearing Supply Business | 15,537 | 13,200 | -2,337 | -15.0% |
| Other Business | 428 | 400 | -28 | -6.5% |
| Gross Profit | 104,670 | 101,000 | -3,670 | -3.5% |
| SG & A Expenses | 42,185 | 45,000 | +2,815 | +6.7% |
| Operating Income | 62,484 | 56,000 | -6,484 | -10.4% |
| Pachinko Machines Business (Operating Income) | 49,386 | 34,400 | -14,986 | -30.3% |
| Pachislot Machines Business (Operating Income) | 18,924 | 28,900 | +9,976 | +52.7% |
| Recurring Income | 63,991 | 58,000 | -5,991 | -9.4% |
| Net Income attributable to owners of parent | 46,752 | 40,000 | -6,752 | -14.4% |
| EPS (yen) | 227.65 | 202.52 | -25.13 | – |
Shareholder Returns
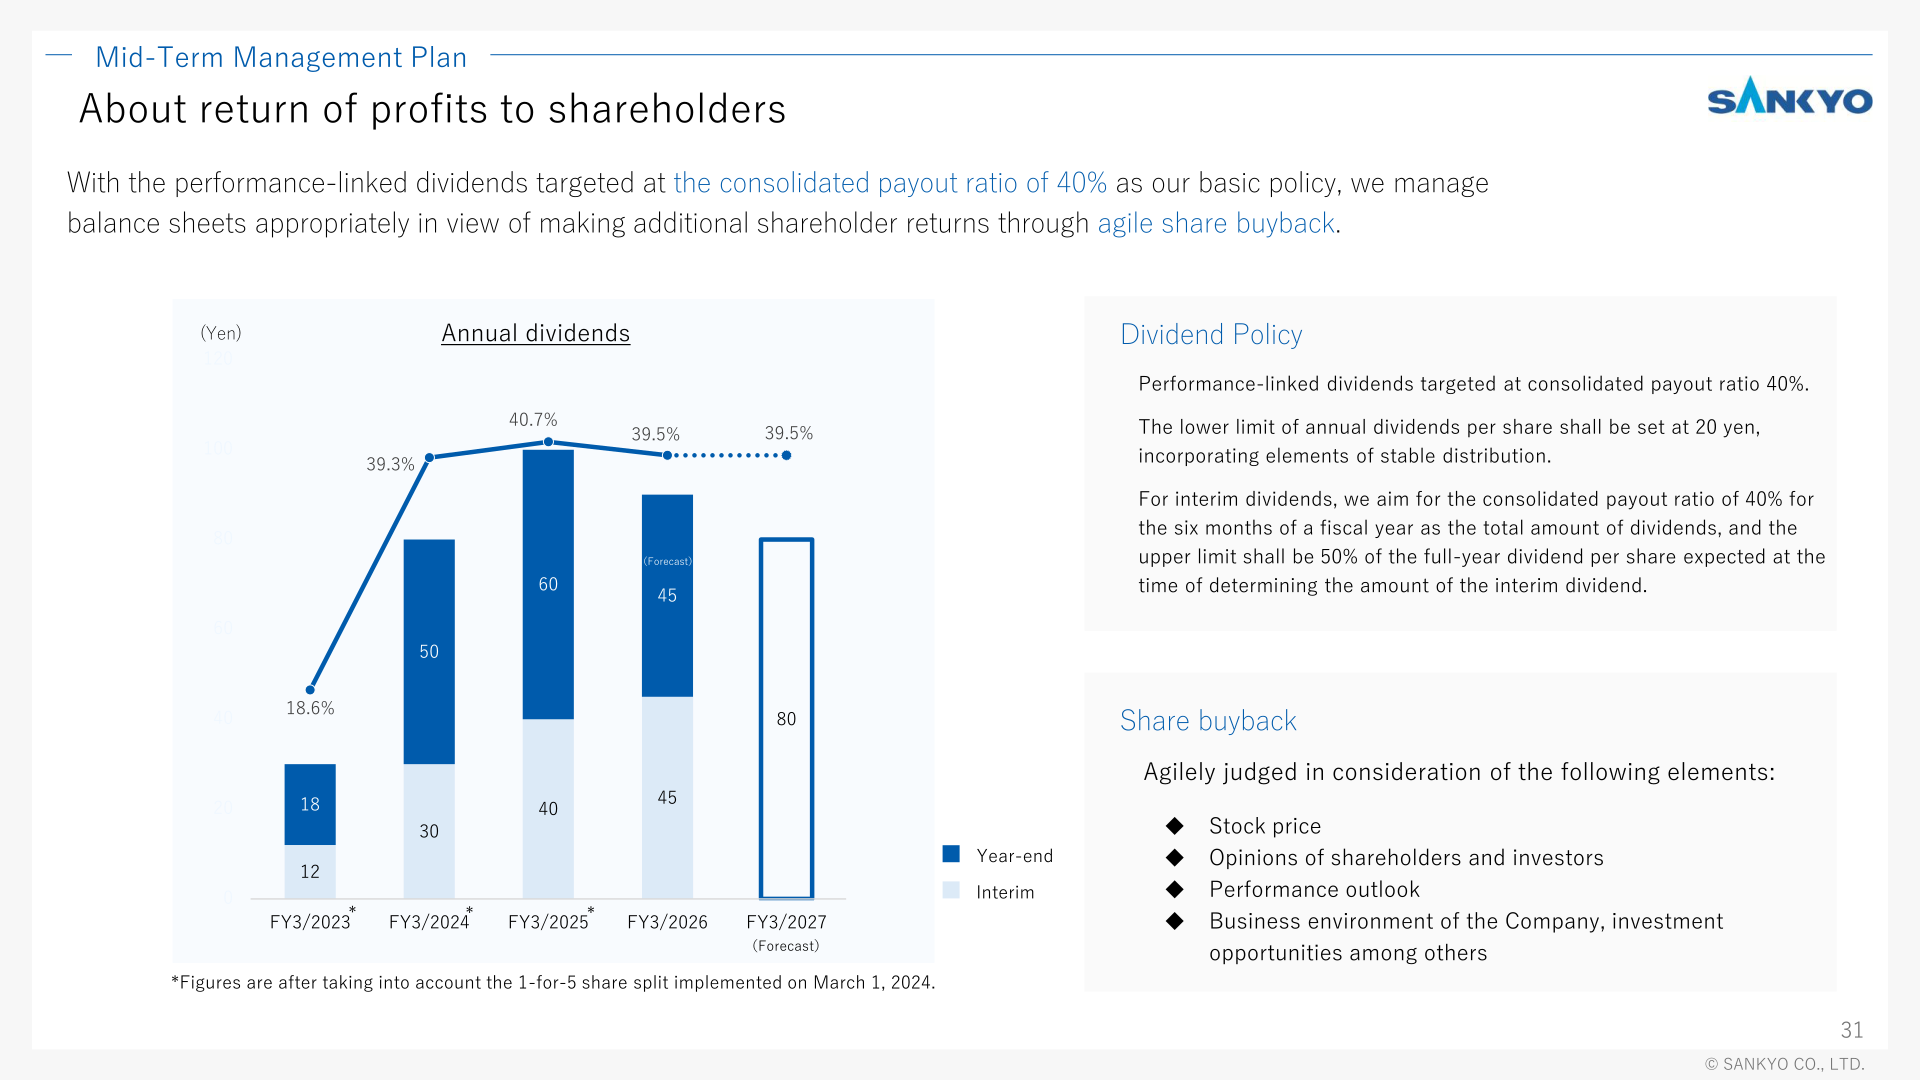
The company’s basic policy is performance-linked dividends targeted at a consolidated payout ratio of 40%, with the lower limit of annual dividends per share set at 20 yen; for interim dividends, it aims for a consolidated payout ratio of 40% for the six months of a fiscal year, with an upper limit of 50% of the full-year dividend per share expected at the time of determination. It also manages its balance sheet appropriately in view of making additional shareholder returns through agile share buybacks, judged in consideration of the stock price, opinions of shareholders and investors, the performance outlook, and the business environment and investment opportunities. The annual dividend per share was 100.00 yen for FY 3/2025 and 90.00 yen for FY 3/2026 (figures adjusted for the 1-for-5 share split effective March 1, 2024), and the forecast for FY 3/2027 is 80 yen. In its discussion of management focused on cost of capital and share price, the company notes that PBR has exceeded 1x in recent years (1.54 times for FY 3/2026), ROE (17.6%) is higher than the cost of equity calculated using the CAPM (assumed cost of equity 6–7%), and PER (8.5 times) has declined, leaving room for increase.
| Item | FY 3/2025 | FY 3/2026 | FY 3/2027 (Forecast) |
|---|---|---|---|
| Annual dividend per share (yen) | 100.00 | 90.00 | 80 |
| ROE | 20.2% | 17.6% | – |
| EPS (yen) | 245.93 | 227.65 | 202.52 |
Medium-Term Management Plan / Key Initiatives
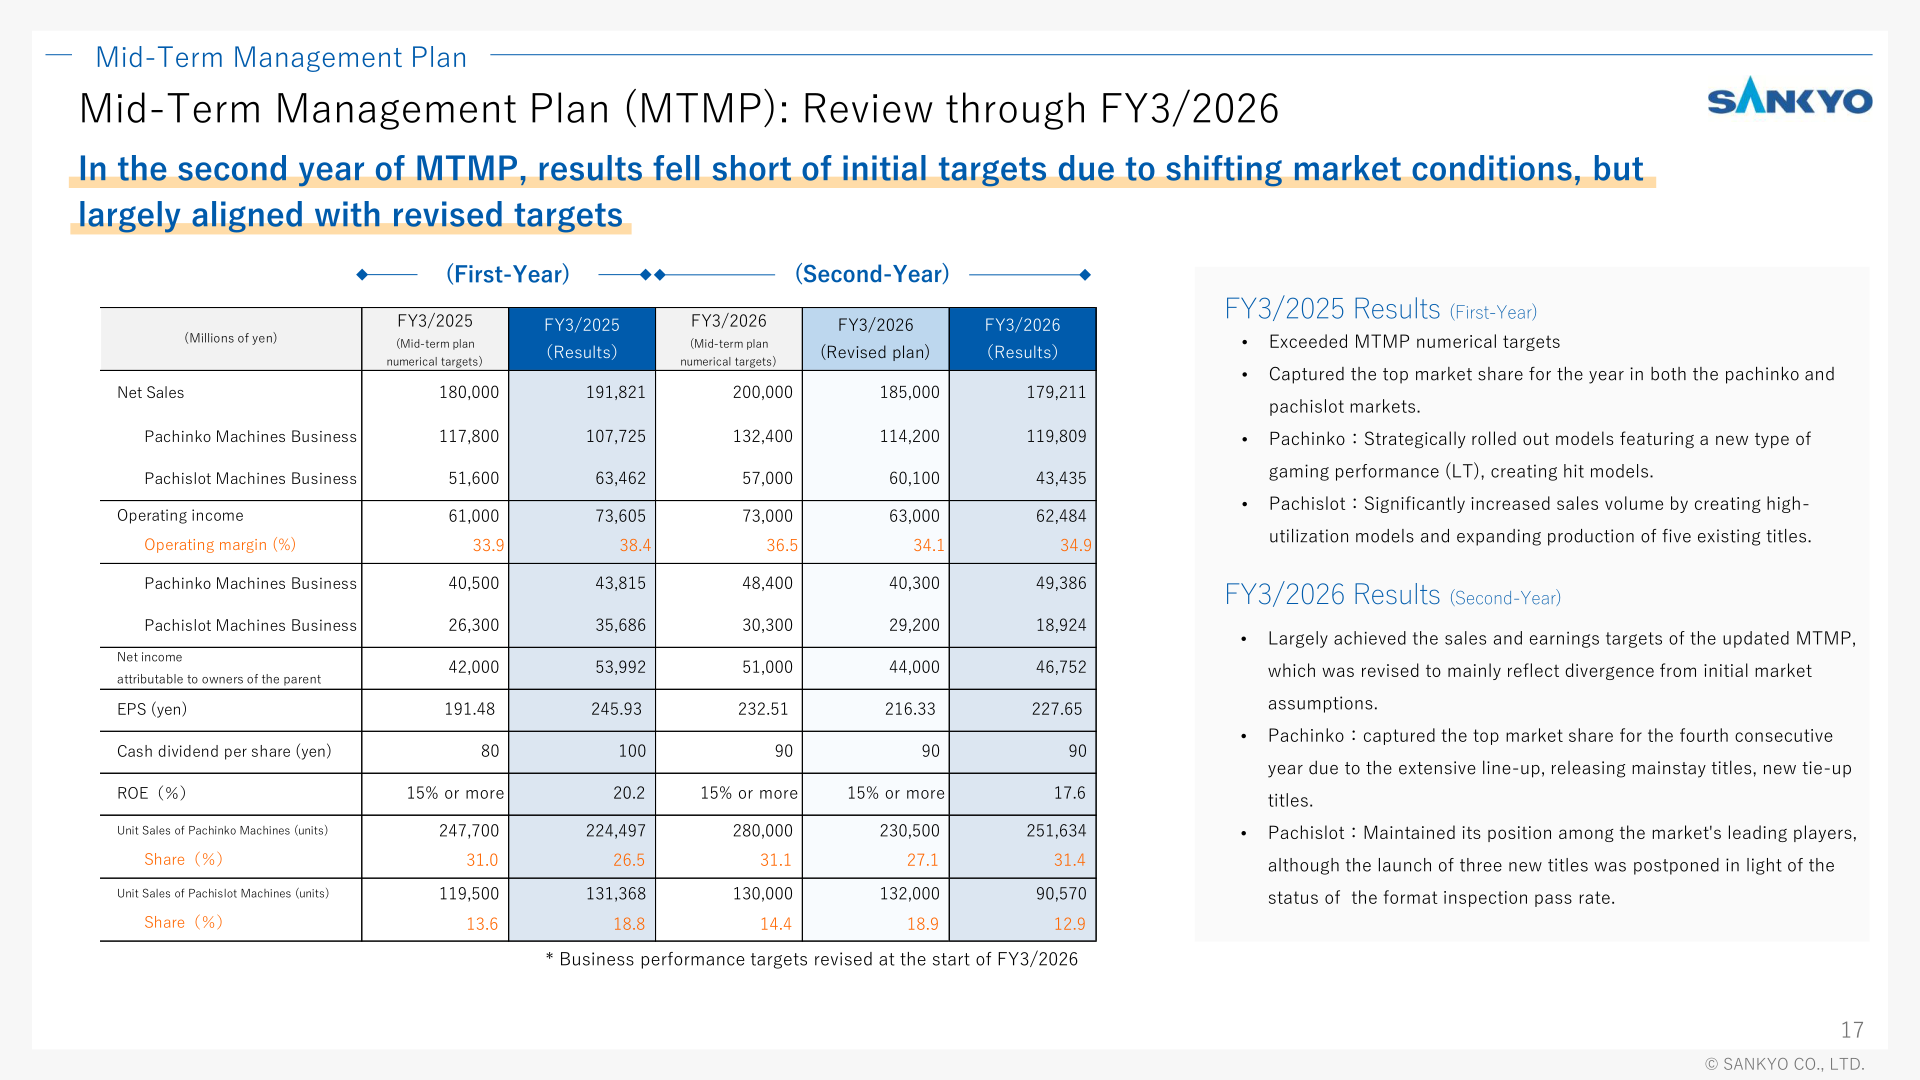
The Mid-Term Management Plan (FY 3/2025 to FY 3/2027) is in its second year. According to the company, FY 3/2025 results exceeded the MTMP numerical targets, while FY 3/2026 results fell short of the initial targets (net sales 200,000 million yen, operating income 73,000 million yen) due to shifting market conditions but largely aligned with the revised targets set at the start of the year (net sales 185,000 million yen, operating income 63,000 million yen, net income 44,000 million yen). Market conditions trended below MTMP assumptions: the initial assumption was that both the pachinko and pachislot markets would expand, but the pachinko market contracted and the pachislot market plateaued. For the final year FY 3/2027, the company revised its MTMP figures from net sales of 220,000 million yen to 174,000 million yen, operating income from 88,000 million yen to 56,000 million yen, net income from 61,000 million yen to 40,000 million yen, pachinko unit sales from 320,000 units to 225,500 units, pachislot unit sales from 150,000 units to 127,000 units, and cash dividend per share from 110 yen to 80 yen, while maintaining the ROE target of 15–20% and revising share targets to 32.2% for pachinko (from 32.0%) and 16.9% for pachislot (from 15.8%).
Key initiatives include a new pricing policy for pachinko machines, “SANKYO YELL PRICE,” under which main new SANKYO-brand pachinko models (including new tie-up machines) are planned to be sold at a main unit price of 499,000 yen and a gauge board price of 419,000 yen (excluding tax, planned), aiming to reduce the financial burden of new machine introductions for parlors and support market recovery. The company plans to offset margin pressure from lower prices through cost structure optimization, market share expansion and new revenue opportunities. Under the “KUGITAMA” project for pachinko market revitalization, initiatives include the “SANKYO Online Museum” (scheduled to be available on May 14, 2026), “Café × Pachinko” experiential stores (scheduled for summer 2026), and the “KUGITAMA YELL Plan,” a rental plan for new “Hanemono” type machines at 20,000 yen per month (excluding tax, planned) starting around autumn 2026. In content IP, cumulative published manga titles increased from 18 at the end of FY 3/2024 to 31 at the end of FY 3/2026 (about 1.7 times), and the company made 5 investments in anime and video works over FY 3/2024–FY 3/2026, targeting approximately 10 new investments annually over the three-year period from FY 3/2027.
This article is an analysis based on publicly available information and is not a recommendation to buy or sell any specific securities. Investment decisions are your own responsibility.
![[Obayashi] Investors’ Guide 2026 — The Complete 24-Article Breakdown](https://japan-equity.com/wp-content/uploads/2026/07/hub_cover-1024x1024.png)
![[Obayashi] IR & SR Policy — Feeding Dialogue Back into Management](https://japan-equity.com/wp-content/uploads/2026/07/p32_sq-1024x1024.jpg)
![[Obayashi] Real Estate Development — 18.7% Margin, ¥287.7bn Unrealized Gains](https://japan-equity.com/wp-content/uploads/2026/07/p20_sq-1024x1024.jpg)
![[Obayashi] Domestic Civil Engineering — Resilience Spending Supports 9.6% Margin](https://japan-equity.com/wp-content/uploads/2026/07/p11_sq-1024x1024.jpg)
![[Obayashi] Share Price & External Ratings — vs TOPIX, ESG Index Inclusion](https://japan-equity.com/wp-content/uploads/2026/07/p40_sq-1024x1024.jpg)
![[Construction] ¥75.5tn Investment, Shrinking Workforce — Big-5 Market Share](https://japan-equity.com/wp-content/uploads/2026/07/p12_sq-1024x1024.jpg)



![[Obayashi] Capital Policy & Shareholder Returns — ROE 10%+, DOE ~5%, ¥100bn Buyback](https://japan-equity.com/wp-content/uploads/2026/07/p27_sq-1024x1024.jpg)
![[Obayashi] Reducing Cross-Shareholdings — ¥285.2bn Sold in Five Years](https://japan-equity.com/wp-content/uploads/2026/07/p29_sq-1024x1024.jpg)
![[Obayashi] ¥750bn Investment Plan — ¥300bn to Development, ¥190bn to Tech/DX](https://japan-equity.com/wp-content/uploads/2026/07/p30_sq-1024x1024.jpg)
![[Obayashi] MTP2022 KPIs — Operating Profit ~2x Target, ROE 14.4%](https://japan-equity.com/wp-content/uploads/2026/07/p25_sq-1024x1024.jpg)
![[Obayashi] Cash Allocation — ¥420bn Investment CF Over Five Years](https://japan-equity.com/wp-content/uploads/2026/07/p26_sq-1024x1024.jpg)
![[Obayashi] Green Energy — 44 Plants, 344MW, and the Green Hydrogen Challenge](https://japan-equity.com/wp-content/uploads/2026/07/p21_sq-1024x1024.jpg)
![[Obayashi] Tackling the Labor Shortage — Robotics Construction®](https://japan-equity.com/wp-content/uploads/2026/07/p14_sq-1024x1024.jpg)
