
This article is based on publicly available IR materials and is not a recommendation to buy or sell any specific securities.
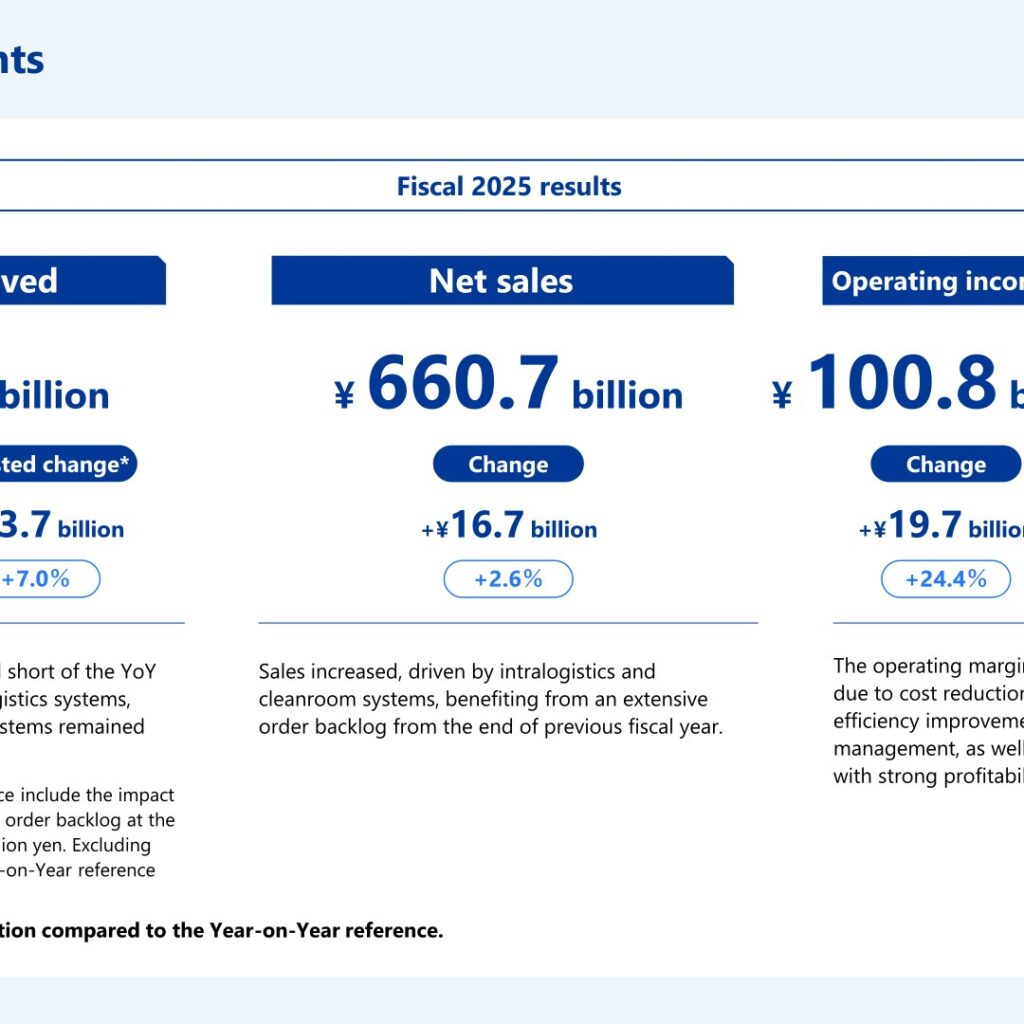
Note: Daifuku changed its fiscal year-end from March 31 to December 31 effective from the fiscal year ended December 31, 2024. The company labels the twelve months from January 1 to December 31, 2025 as “FY2025” and the year ending December 31, 2026 as “FY2026”; the text and tables below keep the company’s own labels. Because FY2024 covered April–December 2024 in Japan (9 months) and January–December 2024 outside Japan (12 months), the company also presents a non-audited “YoY reference” for FY2024 that adds the January–March 2024 results in Japan, and the “Change” figures in this article are versus that YoY reference unless otherwise stated. In FY2025, Daifuku Co., Ltd. recorded orders received of ¥672.6 billion, net sales of ¥660.7 billion (+¥16.7 billion, +2.6%) and operating income of ¥100.8 billion (+¥19.7 billion, +24.4%). Orders and sales expanded steadily, with sales reaching a record high; operating income exceeded JPY 100 billion for the first time, the three key profit metrics achieved record highs for the fourth year in a row, and the operating margin surpassed 15%.
Consolidated Results (Full-Year Actual)
Orders received were ¥672.6 billion, +¥19.4 billion (+3.0%) versus the YoY reference. The company notes that orders for the YoY reference include the impact of exchange rate fluctuations on the order backlog at the previous fiscal year-end of +24.2 billion yen; excluding this impact, orders received for the YoY reference were 628.8 billion yen, and FY2025 orders increased by +43.7 billion yen (+7.0%) versus the adjusted figure. From FY2025, the change in order backlog at the previous fiscal year-end due to exchange rate fluctuations is not included in the amount of orders received. Orders for automotive systems fell short of the YoY reference, while orders for intralogistics systems, cleanroom systems, and airport systems remained steady. Net sales of ¥660.7 billion (+2.6%) were driven by intralogistics and cleanroom systems, benefiting from an extensive order backlog from the end of the previous fiscal year. Operating income rose to ¥100.8 billion (+24.4%) and the operating margin improved to 15.3% (+2.7pt), which the company attributes to cost reductions achieved through production efficiency improvements and enhanced project management, as well as a focus on securing orders with strong profitability. Ordinary income was 104.6 billion yen (+24.1%) and net income attributable to shareholders of the parent company was 78.0 billion yen (+21.3%), for a net income margin of 11.8%. Net income per share was 212.39 yen. Exchange rates for FY2025 were 149.87 yen to the U.S. dollar (152.27 in FY2024) and 20.88 yen to the Chinese yuan (21.13); the effect of exchange rate changes was around -¥6.8bn on orders received, around -¥5.5bn on net sales and around -¥0.6bn on operating income.
| Item (Billion Yen) | FY2024 | YoY reference | FY2025 | Change (Amount) | Change (Rate) |
|---|---|---|---|---|---|
| Orders received | 594.7 | 653.1 | 672.6 | +19.4 | +3.0% |
| Net sales | 563.2 | 643.9 | 660.7 | +16.7 | +2.6% |
| Operating income | 71.5 | 81.0 | 100.8 | +19.7 | +24.4% |
| Operating margin | 12.7% | 12.6% | 15.3% | +2.7pt | ー |
| Ordinary income | 74.4 | 84.2 | 104.6 | +20.3 | +24.1% |
| Net income attributable to shareholders of the parent company | 57.0 | 64.4 | 78.0 | +13.6 | +21.3% |
| Net income margin | 10.1% | 10.0% | 11.8% | +1.8pt | ー |
| Net income per share (yen) | 154.21 | 175.15 | 212.39 | +37.24 | +21.3% |
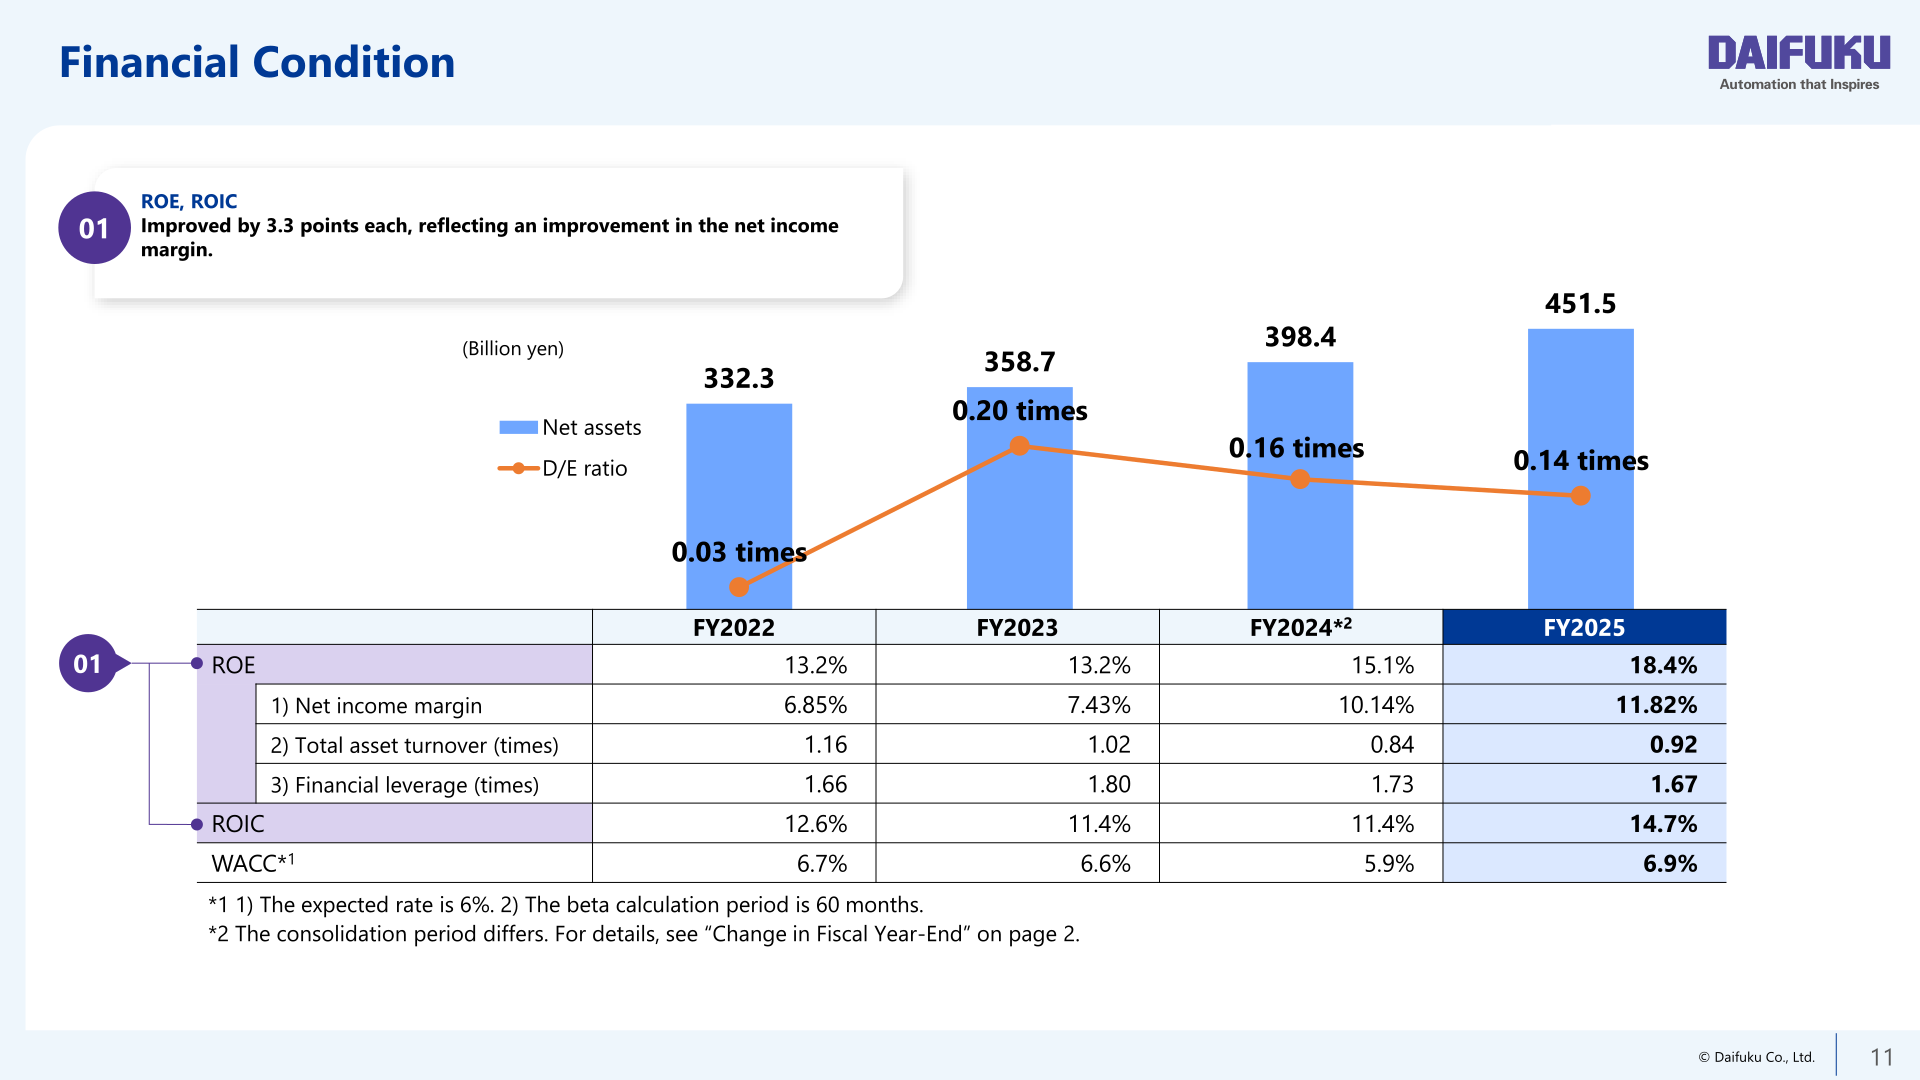
In the company’s analysis of factors for the change in operating income from the YoY reference of 81.0 billion yen to 100.8 billion yen, the change in sales contributed +4.89 billion yen and the change in gross margin +16.12 billion yen, while the change in SG&A expenses was -0.61 billion yen and the effect of exchange rate changes -0.60 billion yen. ROE improved to 18.4% (15.1% in FY2024) and ROIC to 14.7% (11.4%), improvements of 3.3 points each, reflecting an improvement in the net income margin; WACC was 6.9%. At December 31, 2025, total assets were 754.2 billion yen (+65.5 billion yen from December 31, 2024), cash on hand and in banks 261.2 billion yen (+39.7 billion yen), total net assets 451.5 billion yen (+53.1 billion yen) and interest-bearing liabilities 61.3 billion yen, with a D/E ratio of 0.14 times and a cash conversion cycle of 74 days (-25 days). By destination, FY2025 orders were 175.7 billion yen in Japan (26.1% of total) and 496.8 billion yen outside of Japan (73.9%), including North America 198.9 billion yen, Asia 265.2 billion yen and Europe 19.1 billion yen. By industry, electronics accounted for 239.8 billion yen of orders (35.7%), commerce and retail 124.4 billion yen (18.5%), airport 108.4 billion yen (16.1%) and automobile and auto parts 74.6 billion yen (11.1%). Service sales for FY2025 totaled 176.6 billion yen (27% of net sales).
Segment Results
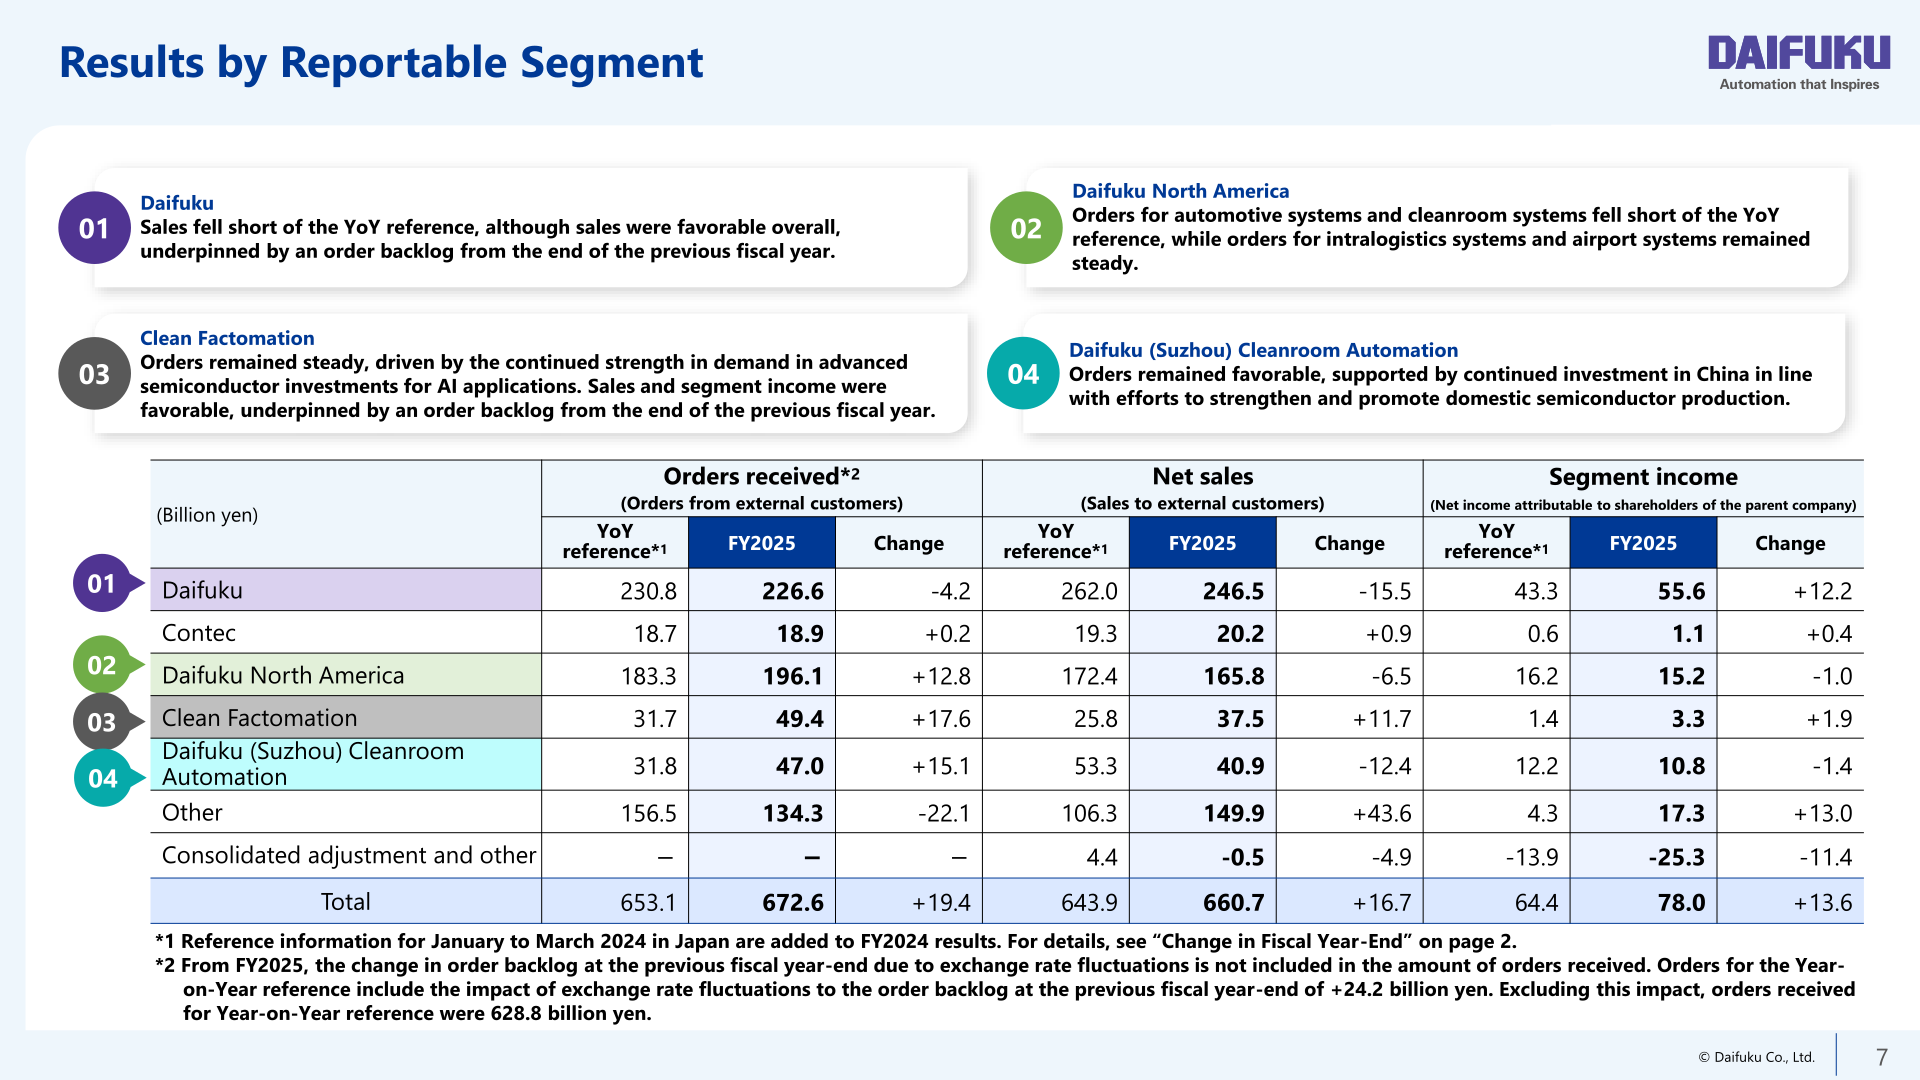
By reportable segment, Daifuku (the parent company) recorded orders received from external customers of 226.6 billion yen (-4.2 billion yen versus the YoY reference), net sales to external customers of 246.5 billion yen (-15.5 billion yen) and segment income (net income attributable to shareholders of the parent company) of 55.6 billion yen (+12.2 billion yen); sales fell short of the YoY reference, although sales were favorable overall, underpinned by an order backlog from the end of the previous fiscal year. At Daifuku North America, orders were 196.1 billion yen (+12.8 billion yen) and sales 165.8 billion yen (-6.5 billion yen), with segment income of 15.2 billion yen (-1.0 billion yen); orders for automotive systems and cleanroom systems fell short of the YoY reference, while orders for intralogistics systems and airport systems remained steady. Clean Factomation posted orders of 49.4 billion yen (+17.6 billion yen), sales of 37.5 billion yen (+11.7 billion yen) and segment income of 3.3 billion yen (+1.9 billion yen), with orders driven by the continued strength in demand in advanced semiconductor investments for AI applications. Daifuku (Suzhou) Cleanroom Automation recorded orders of 47.0 billion yen (+15.1 billion yen), which remained favorable, supported by continued investment in China in line with efforts to strengthen and promote domestic semiconductor production, while sales were 40.9 billion yen (-12.4 billion yen) and segment income 10.8 billion yen (-1.4 billion yen). Contec recorded orders of 18.9 billion yen, sales of 20.2 billion yen and segment income of 1.1 billion yen, and the Other segment recorded orders of 134.3 billion yen (-22.1 billion yen), sales of 149.9 billion yen (+43.6 billion yen) and segment income of 17.3 billion yen (+13.0 billion yen).
| Segment (Billion Yen) | Orders received: YoY reference | Orders received: FY2025 | Change | Net sales: YoY reference | Net sales: FY2025 | Change | Segment income: YoY reference | Segment income: FY2025 | Change |
|---|---|---|---|---|---|---|---|---|---|
| Daifuku | 230.8 | 226.6 | -4.2 | 262.0 | 246.5 | -15.5 | 43.3 | 55.6 | +12.2 |
| Contec | 18.7 | 18.9 | +0.2 | 19.3 | 20.2 | +0.9 | 0.6 | 1.1 | +0.4 |
| Daifuku North America | 183.3 | 196.1 | +12.8 | 172.4 | 165.8 | -6.5 | 16.2 | 15.2 | -1.0 |
| Clean Factomation | 31.7 | 49.4 | +17.6 | 25.8 | 37.5 | +11.7 | 1.4 | 3.3 | +1.9 |
| Daifuku (Suzhou) Cleanroom Automation | 31.8 | 47.0 | +15.1 | 53.3 | 40.9 | -12.4 | 12.2 | 10.8 | -1.4 |
| Other | 156.5 | 134.3 | -22.1 | 106.3 | 149.9 | +43.6 | 4.3 | 17.3 | +13.0 |
| Consolidated adjustment and other | - | - | - | 4.4 | -0.5 | -4.9 | -13.9 | -25.3 | -11.4 |
| Total | 653.1 | 672.6 | +19.4 | 643.9 | 660.7 | +16.7 | 64.4 | 78.0 | +13.6 |
FY2026 Forecast
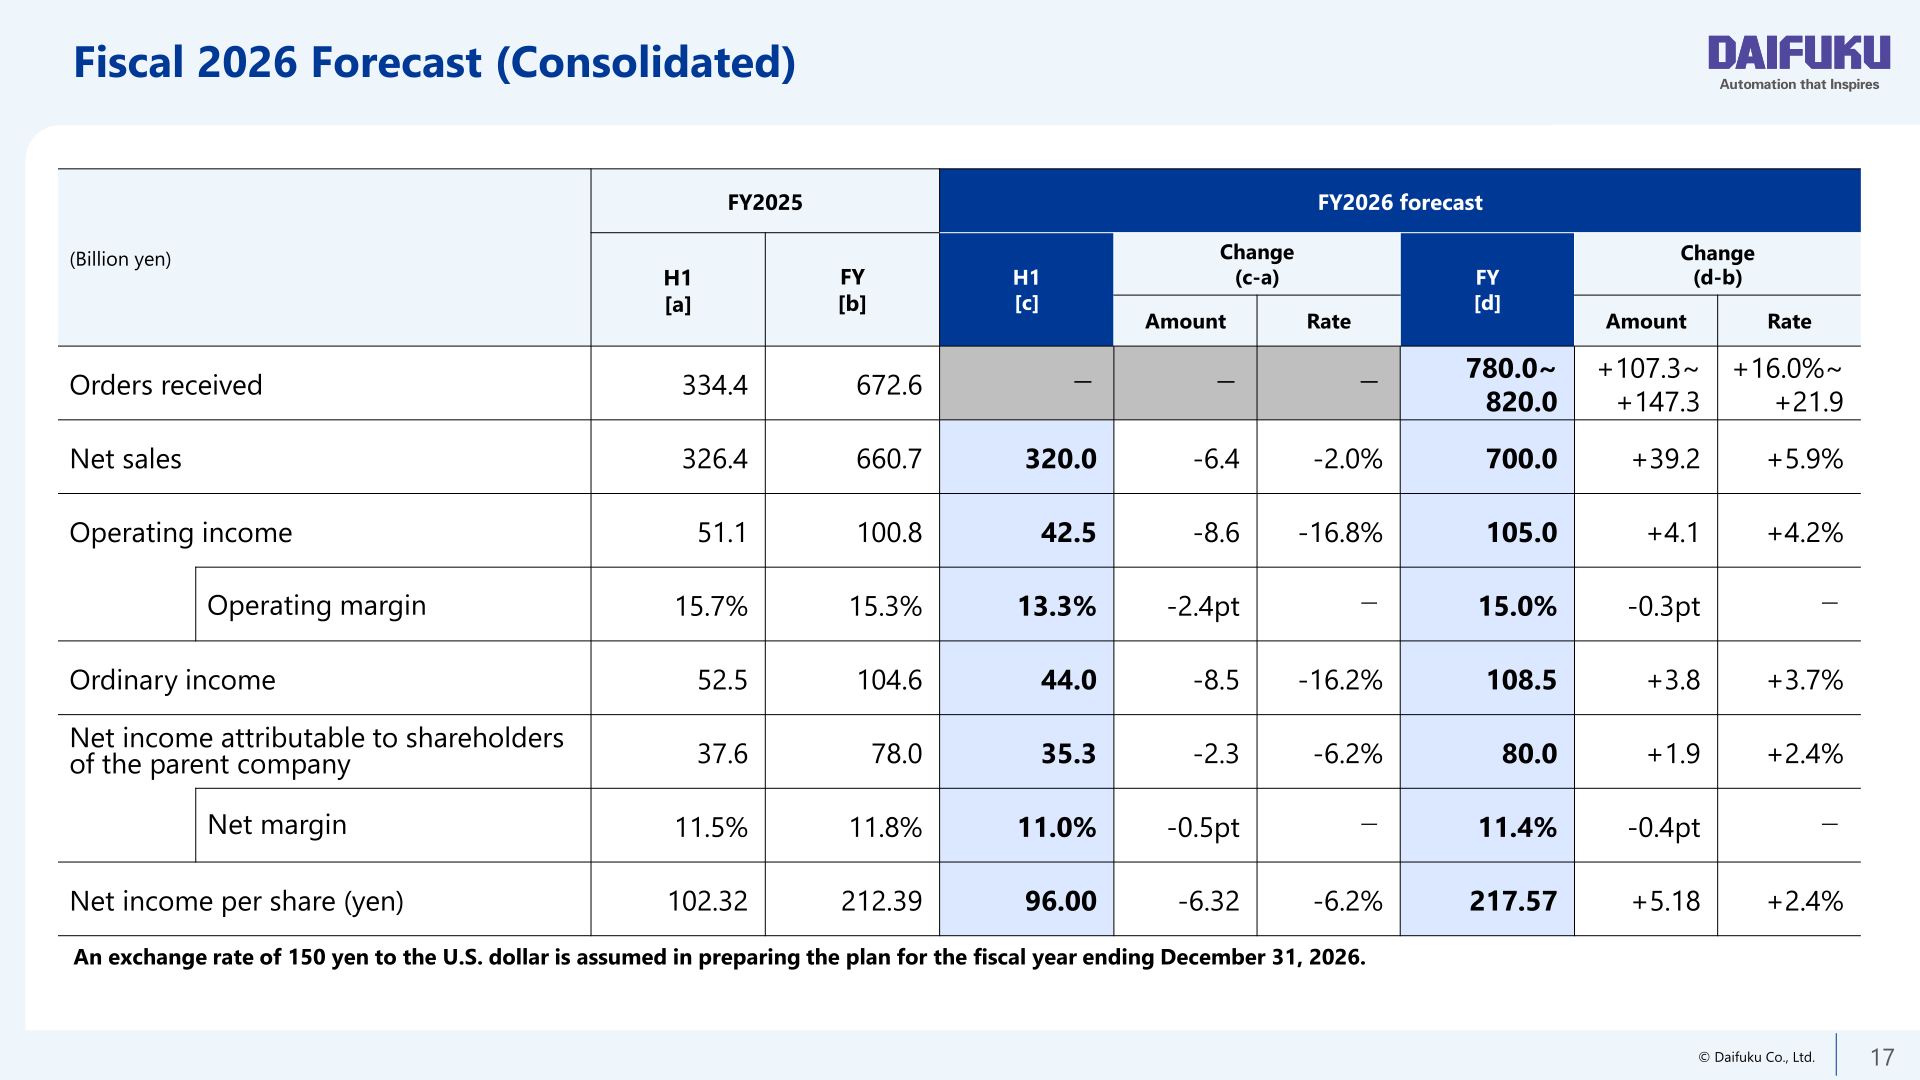
For FY2026 (the fiscal year ending December 31, 2026), Daifuku forecasts orders received of ¥780.0~820.0 billion (+¥107.3~147.3 billion, +16.0~+21.9%), net sales of ¥700.0 billion (+¥39.2 billion, +5.9%), operating income of ¥105.0 billion (+¥4.1 billion, +4.2%) and an operating margin of 15.0% (-0.3pt). Ordinary income is forecast at 108.5 billion yen (+3.7%) and net income attributable to shareholders of the parent company at 80.0 billion yen (+2.4%), for net income per share of 217.57 yen. The company expects automation investment to continue across the manufacturing and distribution industry, semiconductor industry, and airports, driven by labor shortages, rising labor costs, and rapidly expanding advanced semiconductor investment related to generative AI; in the automotive industry, demand is expected to materialize from investments in flexible production systems and projects deferred from the previous fiscal year. Sales are expected to grow steadily based on an extensive order backlog from the end of the previous fiscal year, and the operating margin is expected to remain at a high level. For the first half of FY2026, the company forecasts net sales of 320.0 billion yen (-2.0% versus H1 FY2025) and operating income of 42.5 billion yen (-16.8%). An exchange rate of 150 yen to the U.S. dollar is assumed in preparing the plan. Capital investment is planned at 18.8 billion yen for FY2026 after 33.3 billion yen in FY2025, which increased significantly, reflecting an investment of approximately 22.0 billion yen in the redevelopment of Shiga Works and approximately 5.0 billion yen in the new plant in the United States; R&D expenses are planned at 18.2 billion yen (2.6% of net sales) after 13.1 billion yen in FY2025, with development capabilities for growth-driving technologies including physical AI and robotics strengthened.
| Item (Billion Yen) | FY2025 (Actual) | FY2026 Forecast | Change (Amount) | Change (Rate) |
|---|---|---|---|---|
| Orders received | 672.6 | 780.0~820.0 | +107.3~+147.3 | +16.0%~+21.9% |
| Net sales | 660.7 | 700.0 | +39.2 | +5.9% |
| Operating income | 100.8 | 105.0 | +4.1 | +4.2% |
| Operating margin | 15.3% | 15.0% | -0.3pt | − |
| Ordinary income | 104.6 | 108.5 | +3.8 | +3.7% |
| Net income attributable to shareholders of the parent company | 78.0 | 80.0 | +1.9 | +2.4% |
| Net margin | 11.8% | 11.4% | -0.4pt | − |
| Net income per share (yen) | 212.39 | 217.57 | +5.18 | +2.4% |
Shareholder Returns
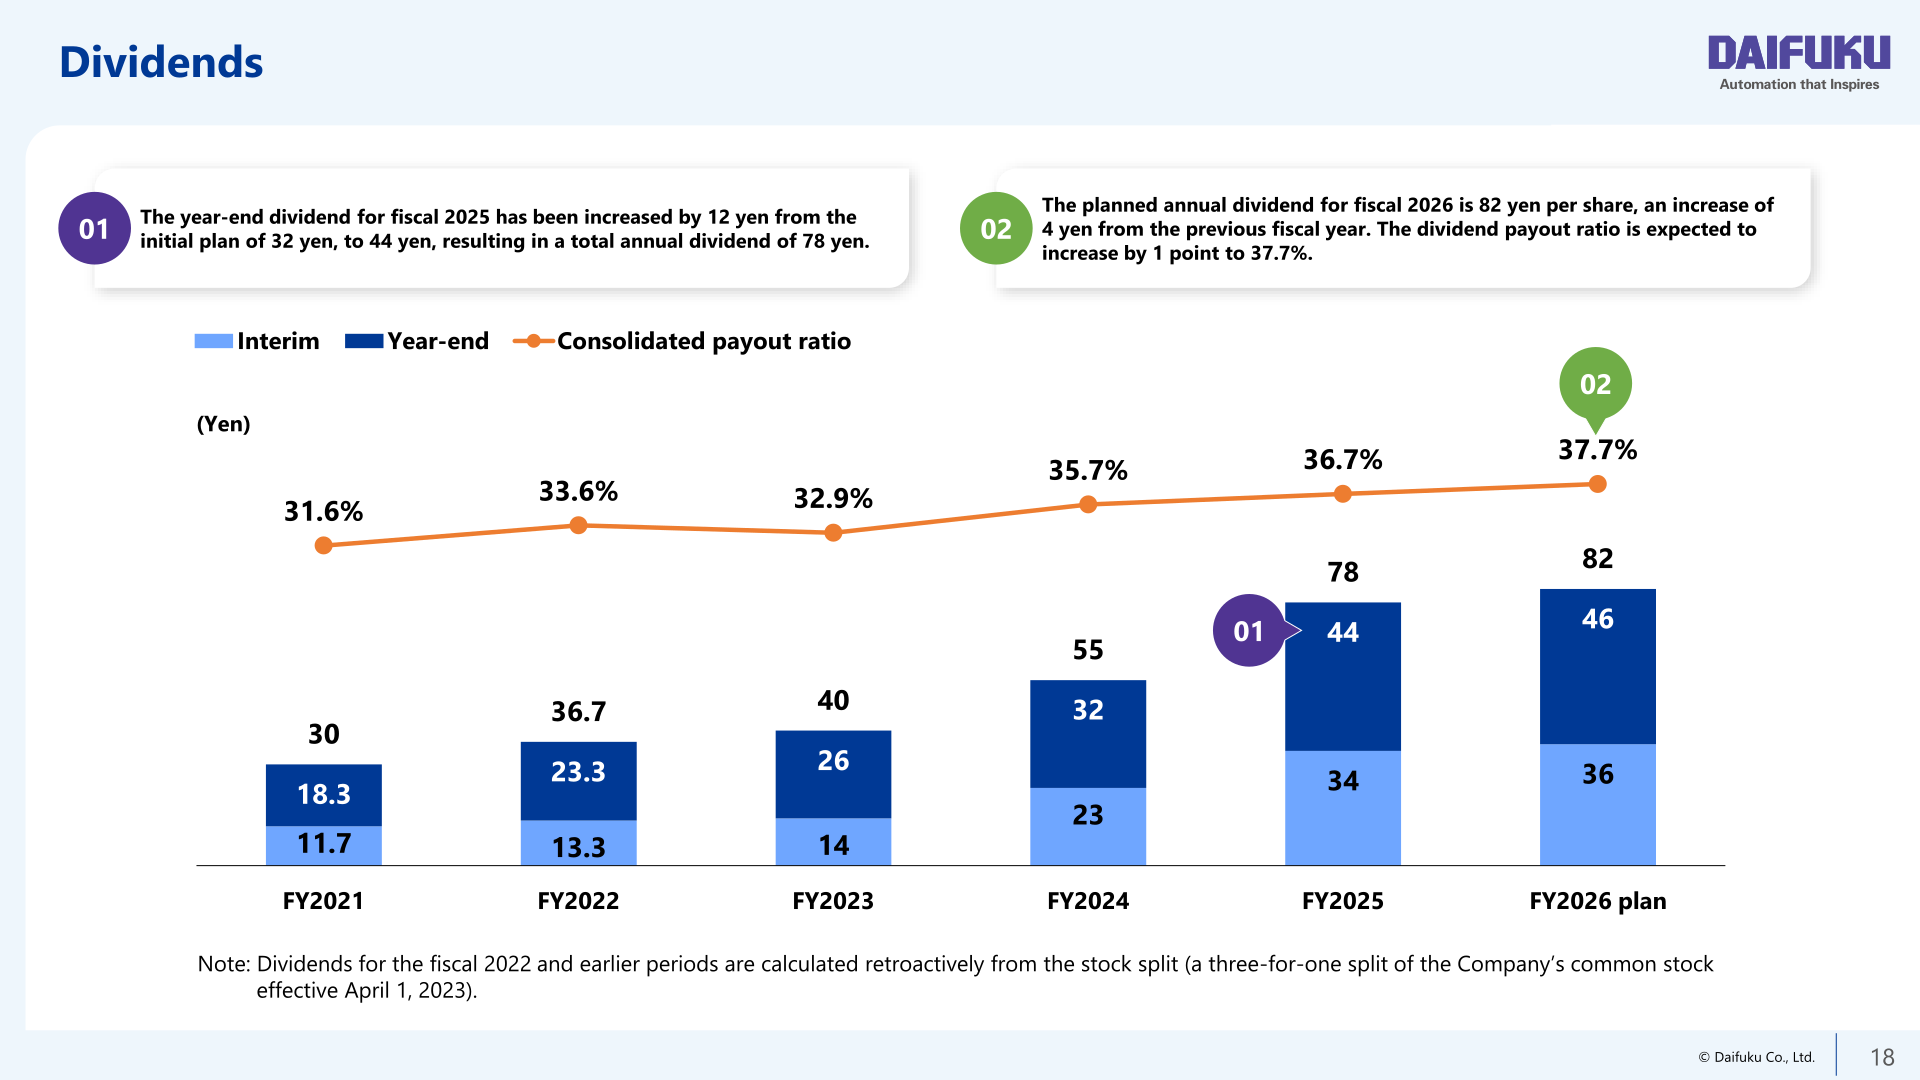
The year-end dividend for fiscal 2025 has been increased by 12 yen from the initial plan of 32 yen, to 44 yen, resulting in a total annual dividend of 78 yen (interim 34 yen, year-end 44 yen), with a consolidated payout ratio of 36.7%. The planned annual dividend for fiscal 2026 is 82 yen per share (interim 36 yen, year-end 46 yen), an increase of 4 yen from the previous fiscal year, and the dividend payout ratio is expected to increase by 1 point to 37.7%. The company notes that dividends for fiscal 2022 and earlier periods are calculated retroactively from the stock split (a three-for-one split of the Company’s common stock effective April 1, 2023).
| Item | FY2024 | FY2025 | FY2026 plan |
|---|---|---|---|
| Interim dividend (yen) | 23 | 34 | 36 |
| Year-end dividend (yen) | 32 | 44 | 46 |
| Annual dividend (yen) | 55 | 78 | 82 |
| Consolidated payout ratio | 35.7% | 36.7% | 37.7% |
2030 Vision and Business Plan for 2027
In its executive summary the company states that profitability targets were achieved ahead of schedule, prompting an upward revision of profit targets for 2027 and 2030 and marking a transition to a higher growth stage. With a view to achieving sales of JPY 1 trillion and operating income of JPY 150 billion by 2030, Daifuku aims to achieve both growth and high profitability through advanced technologies, new businesses, global expansion, and a further strengthening of the profit structure. Structural trends including labor shortages, rising labor costs, and growing demand for advanced semiconductors are expected to drive increased automation investment, which the company sees as a growth opportunity to achieve a significant expansion in orders. Details of the revised 2027 and 2030 targets beyond these headline figures cannot be confirmed from the materials.
This article is an analysis based on publicly available information and is not a recommendation to buy or sell any specific securities. Investment decisions are your own responsibility.
![[Obayashi] Investors’ Guide 2026 — The Complete 24-Article Breakdown](https://japan-equity.com/wp-content/uploads/2026/07/hub_cover-1024x1024.png)
![[Obayashi] IR & SR Policy — Feeding Dialogue Back into Management](https://japan-equity.com/wp-content/uploads/2026/07/p32_sq-1024x1024.jpg)
![[Obayashi] Domestic Civil Engineering — Resilience Spending Supports 9.6% Margin](https://japan-equity.com/wp-content/uploads/2026/07/p11_sq-1024x1024.jpg)
![[Obayashi] Overseas Construction — Orders Reach ¥1.2tn](https://japan-equity.com/wp-content/uploads/2026/07/p15_sq-1024x1024.jpg)
![[Obayashi] Share Price & External Ratings — vs TOPIX, ESG Index Inclusion](https://japan-equity.com/wp-content/uploads/2026/07/p40_sq-1024x1024.jpg)
![[Construction] ¥75.5tn Investment, Shrinking Workforce — Big-5 Market Share](https://japan-equity.com/wp-content/uploads/2026/07/p12_sq-1024x1024.jpg)



![[Obayashi] Capital Policy & Shareholder Returns — ROE 10%+, DOE ~5%, ¥100bn Buyback](https://japan-equity.com/wp-content/uploads/2026/07/p27_sq-1024x1024.jpg)
![[Obayashi] Reducing Cross-Shareholdings — ¥285.2bn Sold in Five Years](https://japan-equity.com/wp-content/uploads/2026/07/p29_sq-1024x1024.jpg)
![[Obayashi] ¥750bn Investment Plan — ¥300bn to Development, ¥190bn to Tech/DX](https://japan-equity.com/wp-content/uploads/2026/07/p30_sq-1024x1024.jpg)
![[Obayashi] MTP2022 KPIs — Operating Profit ~2x Target, ROE 14.4%](https://japan-equity.com/wp-content/uploads/2026/07/p25_sq-1024x1024.jpg)
![[Obayashi] Cash Allocation — ¥420bn Investment CF Over Five Years](https://japan-equity.com/wp-content/uploads/2026/07/p26_sq-1024x1024.jpg)
![[Obayashi] Green Energy — 44 Plants, 344MW, and the Green Hydrogen Challenge](https://japan-equity.com/wp-content/uploads/2026/07/p21_sq-1024x1024.jpg)
![[Obayashi] Tackling the Labor Shortage — Robotics Construction®](https://japan-equity.com/wp-content/uploads/2026/07/p14_sq-1024x1024.jpg)
