
This article is based on publicly available IR materials and is not a recommendation to buy or sell any specific securities.
Note: Kurita Water Industries labels its fiscal years by the month of the period-end (e.g., “FY 03/2026” for the fiscal year ended March 31, 2026). This site classifies that year as FY2025; the labels used in the company’s materials are retained in the body, tables, and segment data below.
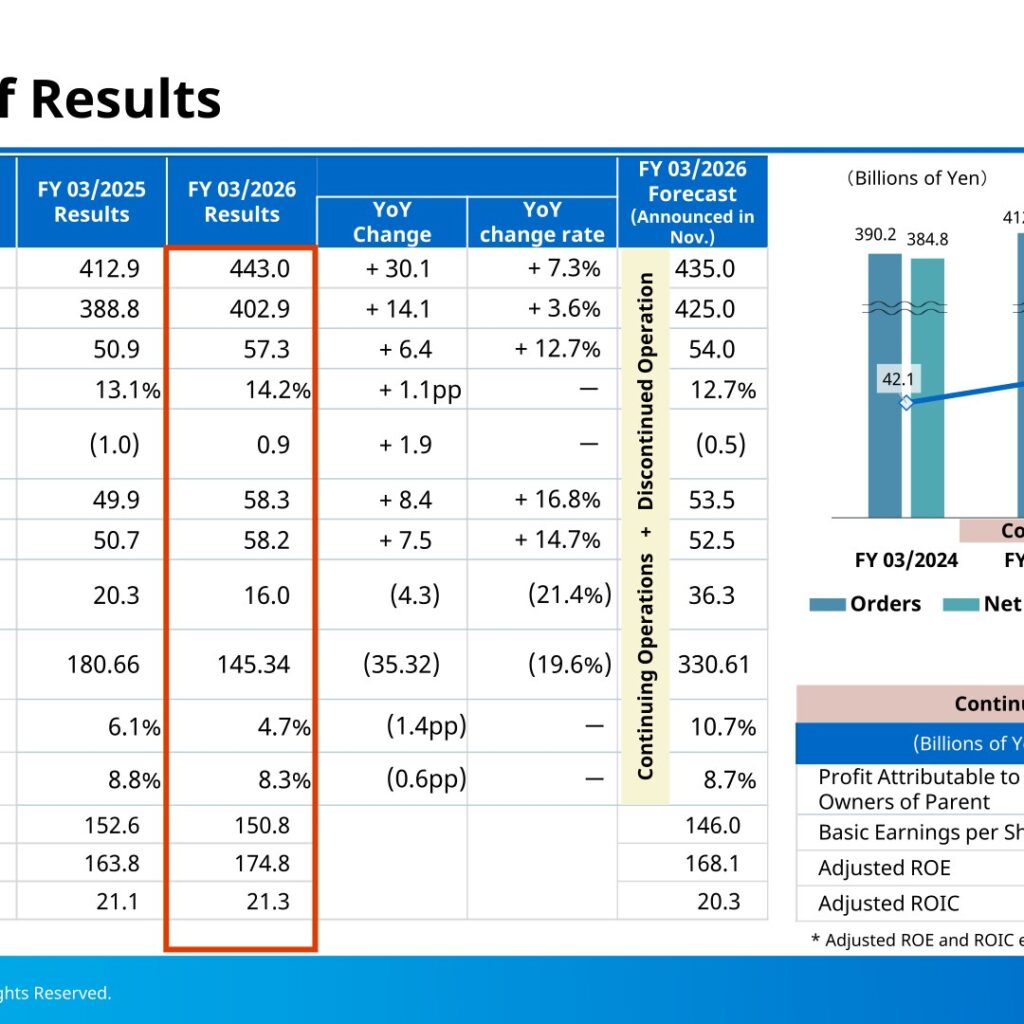
Kurita Water Industries Ltd. (6370) released its “Results Presentation for the Fiscal Year Ended March 31, 2026” dated May 18, 2026. On a continuing operations basis, FY 03/2026 orders rose 7.3% year on year to 443.0 billion yen, net sales rose 3.6% to 402.9 billion yen, and business profit rose 12.7% to 57.3 billion yen, lifting the business profit margin to 14.2% from 13.1%. The company attributes the gains to orders for facility projects acquired globally and to improved profitability led by the growth of service businesses centered on maintenance. Following the execution of a share transfer agreement for Pentagon Technologies Group, Inc. on May 13, 2026, the overseas precision tool cleaning business has been classified as a discontinued operation, and results up to profit before tax are presented on a continuing operations basis.
Consolidated Results (FY 03/2026 Actual)
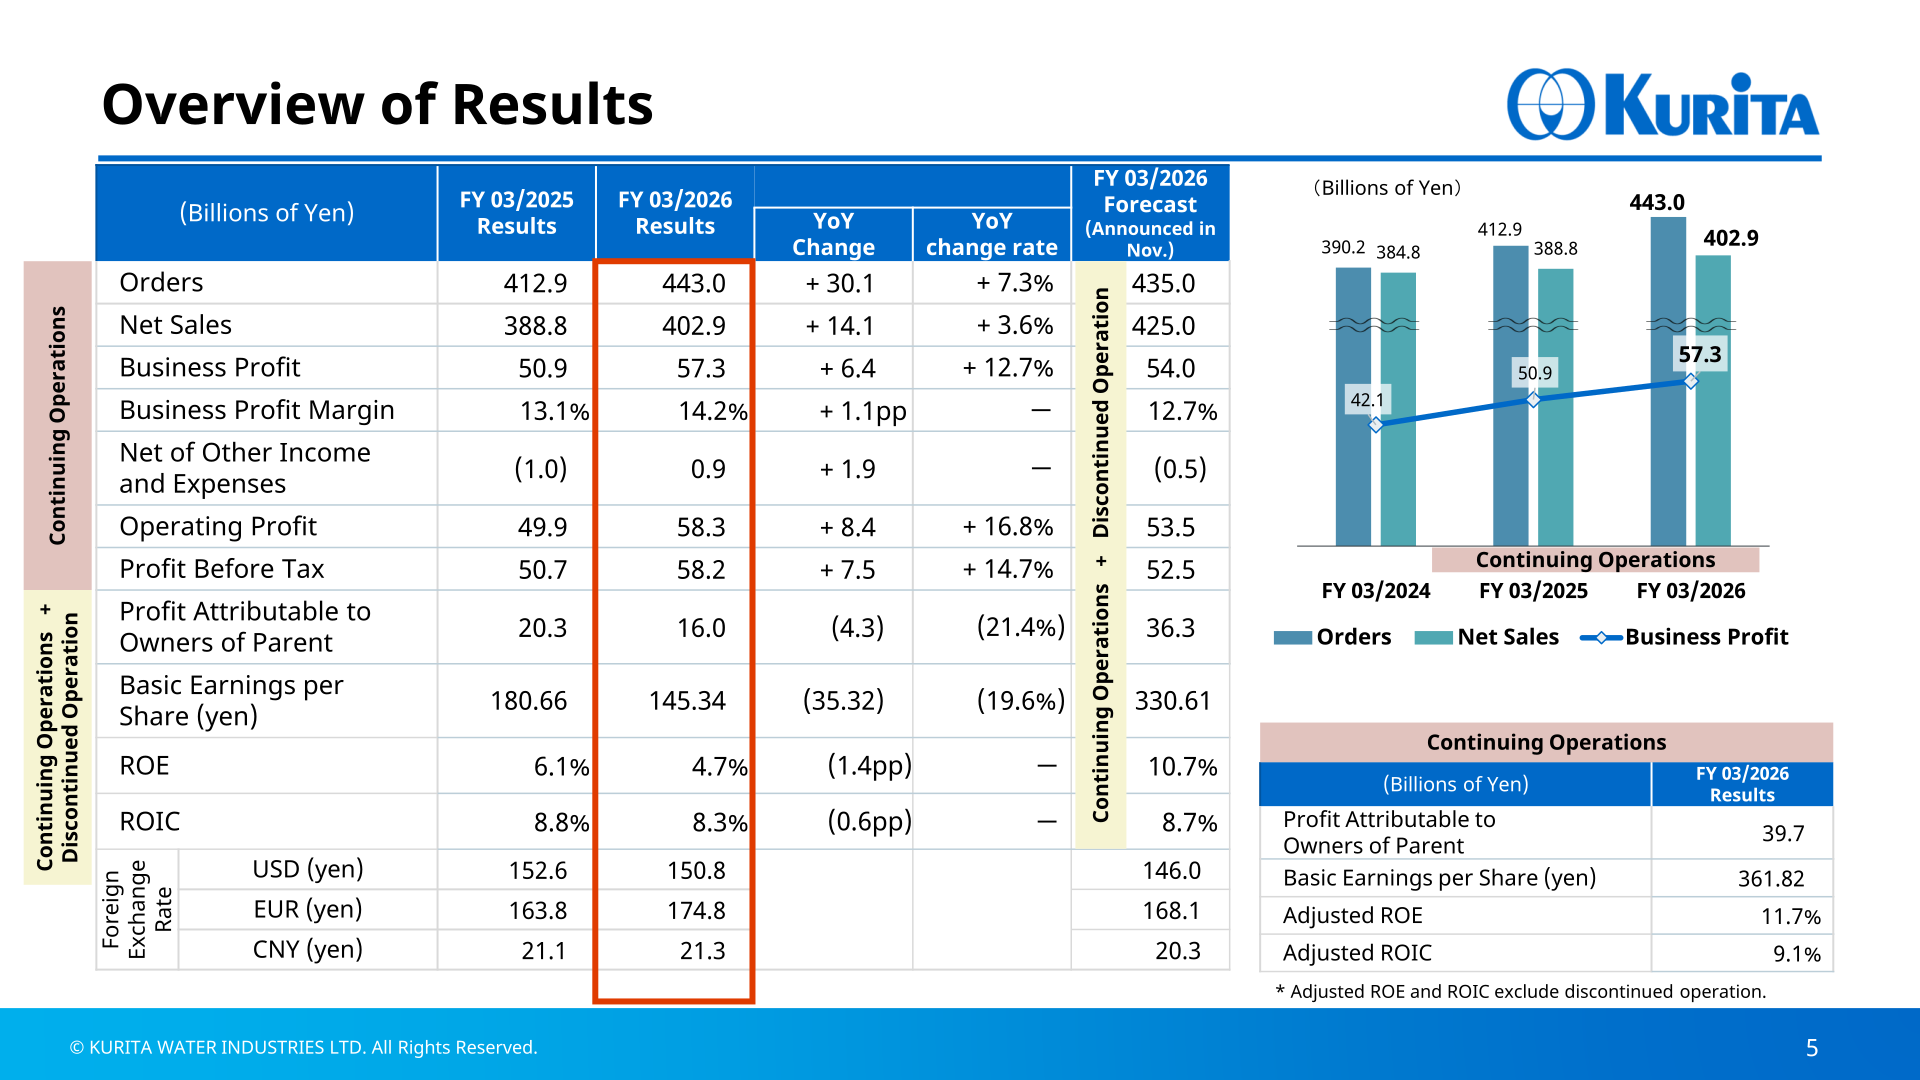
Operating profit (continuing operations) increased 16.8% to 58.3 billion yen and profit before tax increased 14.7% to 58.2 billion yen. Profit attributable to owners of parent on a continuing operations basis was 16.0 billion yen, down 4.3 billion yen (21.4%) from 20.3 billion yen, with basic earnings per share of 145.34 yen. Including the discontinued operation, profit attributable to owners of parent was 39.7 billion yen and basic earnings per share was 361.82 yen; adjusted ROE, which excludes the discontinued operation, was 11.7% and adjusted ROIC was 9.1%. Business profit rose by 6.4 billion yen year on year (organic change +6.0 billion yen), comprising +4.5 billion yen from increased sales, +3.9 billion yen from an improved cost of sales ratio, (2.4) billion yen from higher SG&A expenses (increases in personnel and digital-related expenses), and +0.4 billion yen from foreign exchange. Average exchange rates were 150.8 yen to the US dollar, 174.8 yen to the euro, and 21.3 yen to the yuan.
| Item (Billions of Yen, continuing operations) | FY 03/2025 Results | FY 03/2026 Results | YoY Change | YoY change rate |
|---|---|---|---|---|
| Orders | 412.9 | 443.0 | + 30.1 | + 7.3% |
| Net Sales | 388.8 | 402.9 | + 14.1 | + 3.6% |
| Business Profit | 50.9 | 57.3 | + 6.4 | + 12.7% |
| Business Profit Margin | 13.1% | 14.2% | + 1.1pp | - |
| Operating Profit | 49.9 | 58.3 | + 8.4 | + 16.8% |
| Profit Before Tax | 50.7 | 58.2 | + 7.5 | + 14.7% |
| Profit Attributable to Owners of Parent | 20.3 | 16.0 | (4.3) | (21.4%) |
| Basic Earnings per Share (yen) | 180.66 | 145.34 | (35.32) | (19.6%) |
| ROE | 6.1% | 4.7% | (1.4pp) | - |
| ROIC | 8.8% | 8.3% | (0.6pp) | - |
Against the forecast announced in November (orders 435.0 billion yen, net sales 425.0 billion yen, business profit 54.0 billion yen), orders and business profit exceeded the forecast while net sales fell short. The CSV business, which the company reports including the discontinued operation as its impact is immaterial, posted net sales of 58.5 billion yen, up 11.2 billion yen from 47.3 billion yen (Electronics Industry 15.1 billion yen, General Industry 43.4 billion yen), and the number of CSV business models rose by 32 to 128 at the end of March 2026. Capital expenditures (property, plant and equipment, including right-of-use assets) decreased to 21.9 billion yen from 37.2 billion yen, reflecting the high level of investment in the previous fiscal year for water supply services; depreciation was 30.0 billion yen and R&D expenses were 8.1 billion yen.
Segment Results
In the Electronics Industry segment (continuing operations), orders increased 14.6 billion yen to 209.0 billion yen, mainly due to the acquisition of large-scale facility projects in Japan, South Korea, and North America, while net sales rose 2.3 billion yen to 171.8 billion yen as facility sales decreased on the absence of large-scale projects in China recorded in the previous fiscal year. Maintenance orders and net sales increased in all regions, primarily in Asia. Segment business profit rose 1.5 billion yen to 27.7 billion yen, with the margin improving to 16.1% from 15.4%, helped by an improved business mix from a higher sales ratio of service businesses and improved profitability in the facility business.
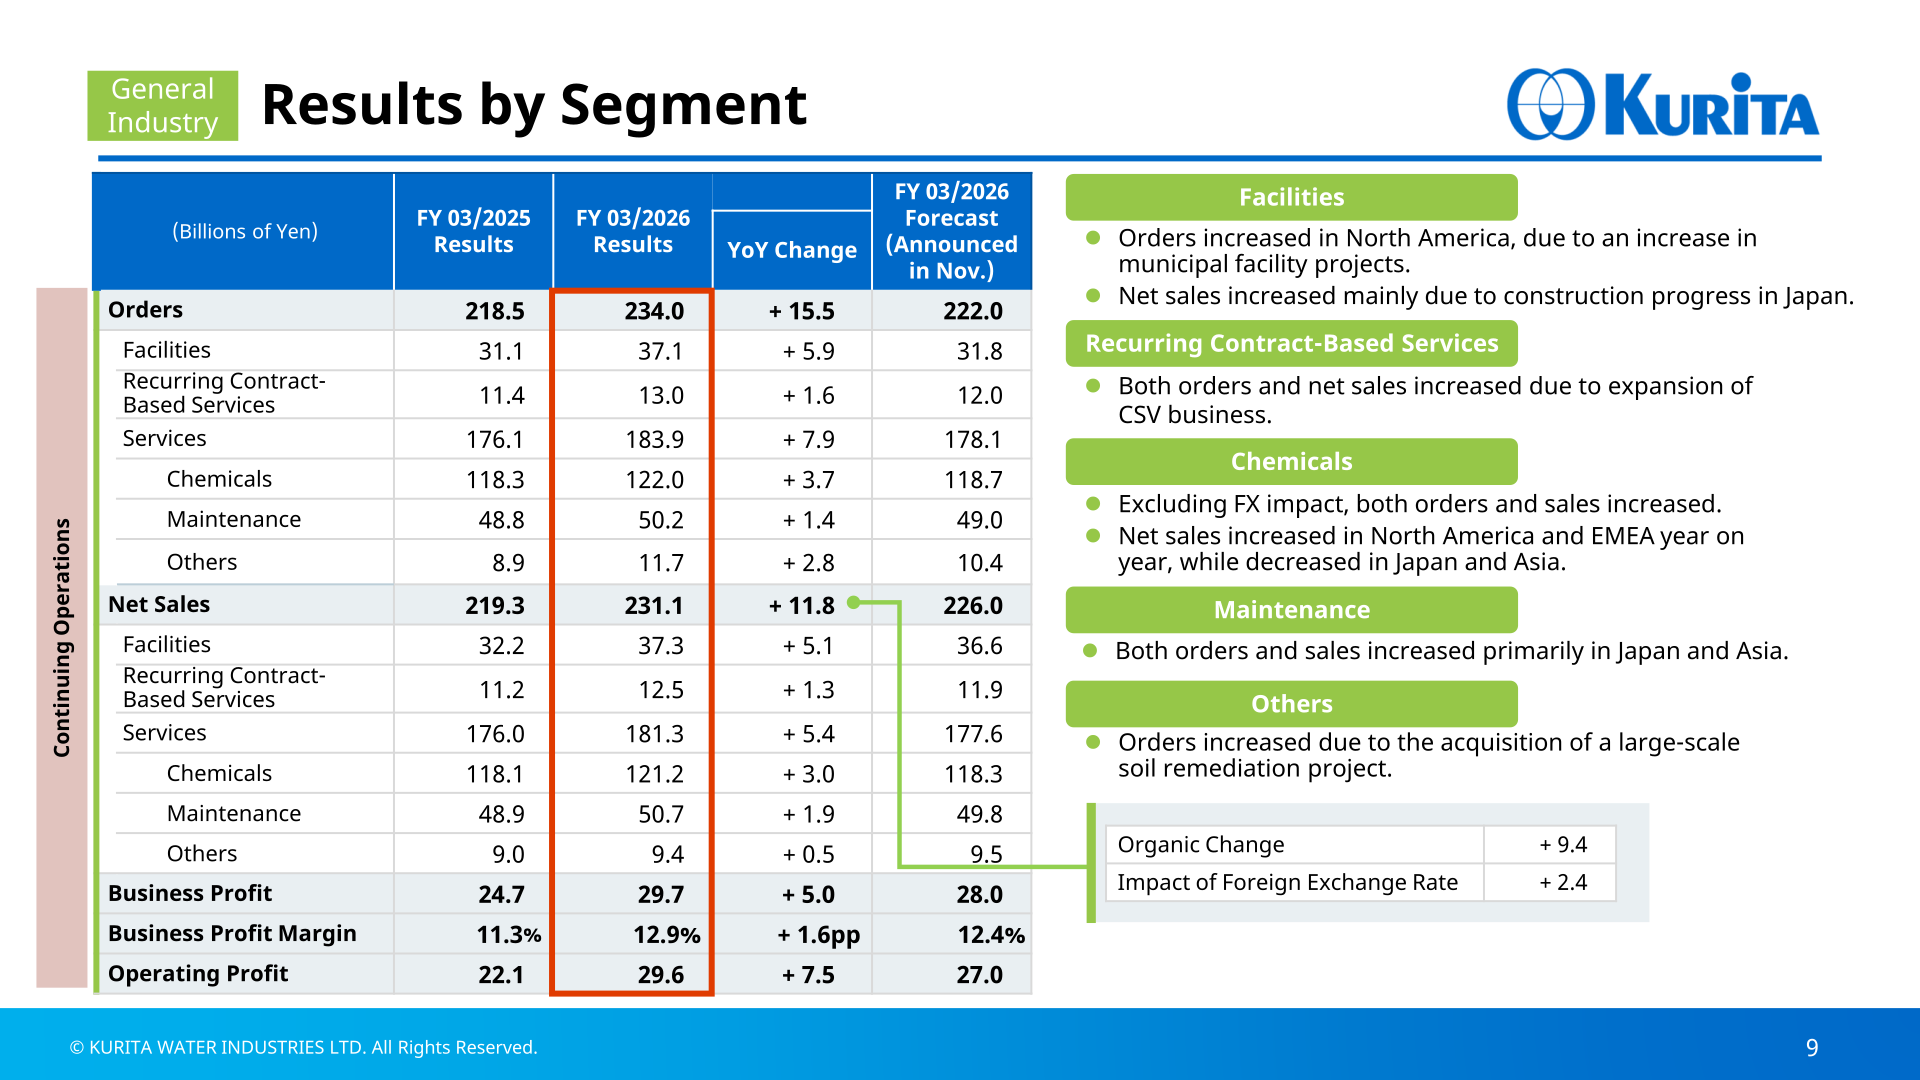
In the General Industry segment, orders increased 15.5 billion yen to 234.0 billion yen and net sales increased 11.8 billion yen to 231.1 billion yen (organic change +9.4 billion yen; foreign exchange impact +2.4 billion yen). Chemicals orders and net sales both increased on the expansion of the CSV business, facilities orders rose on an increase in municipal facility projects in North America, and maintenance orders and sales rose primarily in Japan and Asia. Segment business profit increased 5.0 billion yen to 29.7 billion yen, with the margin improving to 12.9% from 11.3%, driven by the expansion of the CSV business and optimization of product composition.
| Segment (Billions of Yen, continuing operations) | Item | FY 03/2025 Results | FY 03/2026 Results | YoY Change |
|---|---|---|---|---|
| Electronics Industry | Orders | 194.3 | 209.0 | + 14.6 |
| Electronics Industry | Net Sales | 169.5 | 171.8 | + 2.3 |
| Electronics Industry | Business Profit | 26.2 | 27.7 | + 1.5 |
| Electronics Industry | Business Profit Margin | 15.4% | 16.1% | + 0.7pp |
| General Industry | Orders | 218.5 | 234.0 | + 15.5 |
| General Industry | Net Sales | 219.3 | 231.1 | + 11.8 |
| General Industry | Business Profit | 24.7 | 29.7 | + 5.0 |
| General Industry | Business Profit Margin | 11.3% | 12.9% | + 1.6pp |
By region (consolidated, continuing operations), net sales in Japan rose 15.3 billion yen to 211.9 billion yen, North & South America rose 2.1 billion yen to 57.1 billion yen, and EMEA rose 7.3 billion yen to 44.0 billion yen, while Asia fell 10.6 billion yen to 89.9 billion yen on the absence of large-scale projects in China in the Electronics Industry segment. The company notes that certain figures for the previous fiscal year have been reclassified due to a revision of segment and regional classifications.
Financial Condition
Total assets at the end of March 2026 were 564.4 billion yen, up 15.5 billion yen from 548.9 billion yen a year earlier. Trade and other receivables increased 19.2 billion yen to 145.6 billion yen, mainly in contract assets, while property, plant and equipment decreased 8.7 billion yen to 186.8 billion yen due to impairment of fixed assets. Total liabilities rose 10.0 billion yen to 220.4 billion yen on increased borrowings. Equity attributable to owners of parent rose 5.1 billion yen to 341.2 billion yen, as higher retained earnings were partly offset by the impact of FX rates and share repurchases. Assets held for sale of 8.2 billion yen and associated liabilities of 10.3 billion yen were recorded at the end of March 2026.
FY 03/2027 Forecast
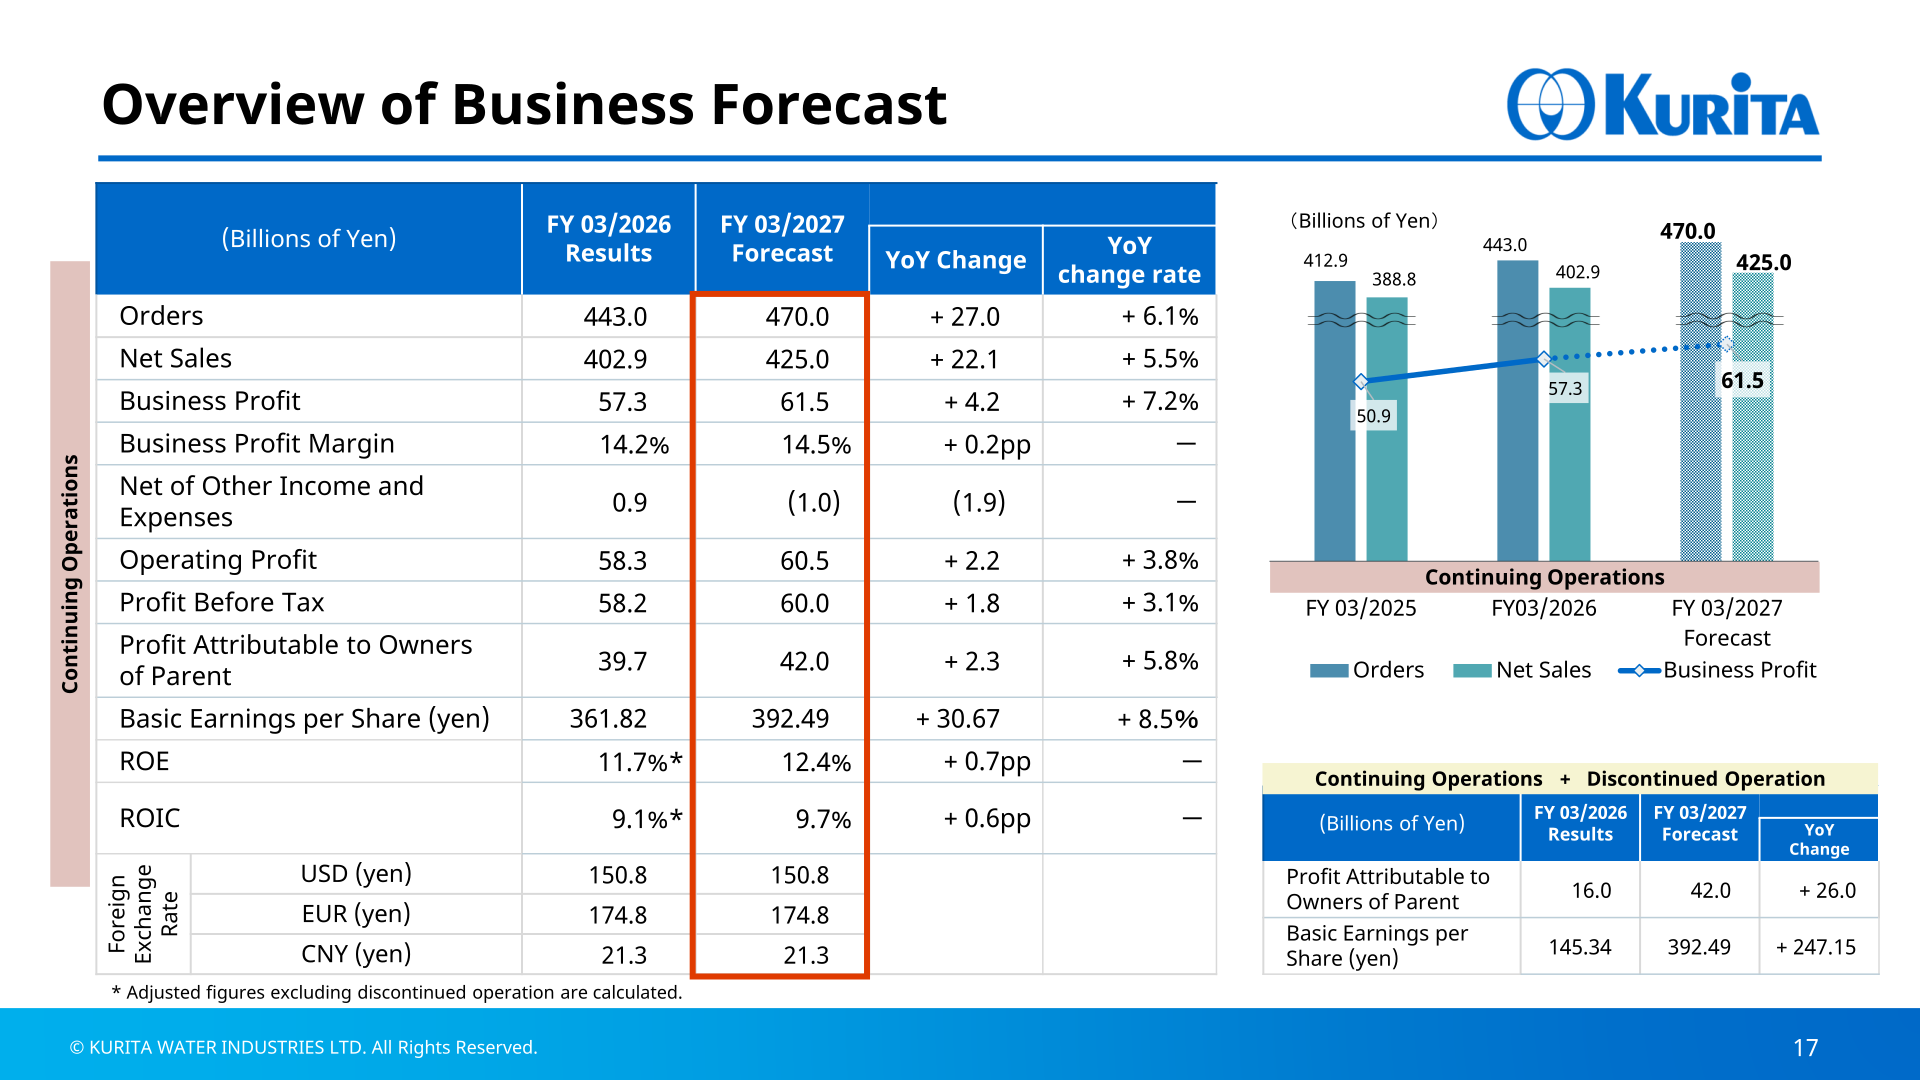
For the fiscal year ending March 31, 2027, Kurita forecasts orders of 470.0 billion yen (+6.1%), net sales of 425.0 billion yen (+5.5%), and business profit of 61.5 billion yen (+7.2%), for a business profit margin of 14.5%. Operating profit is forecast at 60.5 billion yen (+3.8%) and profit before tax at 60.0 billion yen (+3.1%). Profit attributable to owners of parent is forecast at 42.0 billion yen, up 5.8% from the 39.7 billion yen reported including the discontinued operation, with basic earnings per share of 392.49 yen; ROE is forecast at 12.4% and ROIC at 9.7%. Exchange rate assumptions are unchanged from FY 03/2026 at 150.8 yen to the US dollar, 174.8 yen to the euro, and 21.3 yen to the yuan. The company expects orders to remain at a high level supported by continued semiconductor investment globally, with both net sales and business profit rising on sales growth in facilities and maintenance. It also flags an estimated impact from tensions in the Middle East of (5.0) billion yen on consolidated orders and net sales and (2.5) billion yen on profit, concentrated in the General Industry segment’s chemicals business in the first half, with improvement expected in the second half.
| Item (Billions of Yen, continuing operations) | FY 03/2026 Results | FY 03/2027 Forecast | YoY Change | YoY change rate |
|---|---|---|---|---|
| Orders | 443.0 | 470.0 | + 27.0 | + 6.1% |
| Net Sales | 402.9 | 425.0 | + 22.1 | + 5.5% |
| Business Profit | 57.3 | 61.5 | + 4.2 | + 7.2% |
| Business Profit Margin | 14.2% | 14.5% | + 0.2pp | - |
| Operating Profit | 58.3 | 60.5 | + 2.2 | + 3.8% |
| Profit Before Tax | 58.2 | 60.0 | + 1.8 | + 3.1% |
| Profit Attributable to Owners of Parent (incl. discontinued operation for FY 03/2026) | 39.7 | 42.0 | + 2.3 | + 5.8% |
| Basic Earnings per Share (yen) | 361.82 | 392.49 | + 30.67 | + 8.5% |
| ROE | 11.7%* | 12.4% | + 0.7pp | - |
| ROIC | 9.1%* | 9.7% | + 0.6pp | - |
* Adjusted figures excluding the discontinued operation. By segment, Electronics Industry orders are forecast at 240.0 billion yen (+31.0 billion yen), net sales at 195.0 billion yen (+23.2 billion yen) on construction progress for projects in North America and Taiwan, and business profit at 30.5 billion yen (+2.8 billion yen), with the margin easing to 15.6% as the service business sales composition declines. General Industry orders are forecast at 230.0 billion yen ((4.0) billion yen) reflecting a rebound from the North American municipal facility projects and the absence of the large-scale soil remediation project, net sales at 230.0 billion yen ((1.1) billion yen) with the CSV business expanding across regions despite the Middle East impact, and business profit at 31.0 billion yen (+1.3 billion yen) for a margin of 13.5%. Consolidated CSV business net sales are forecast to rise 9.5 billion yen to 68.0 billion yen.
Shareholder Returns
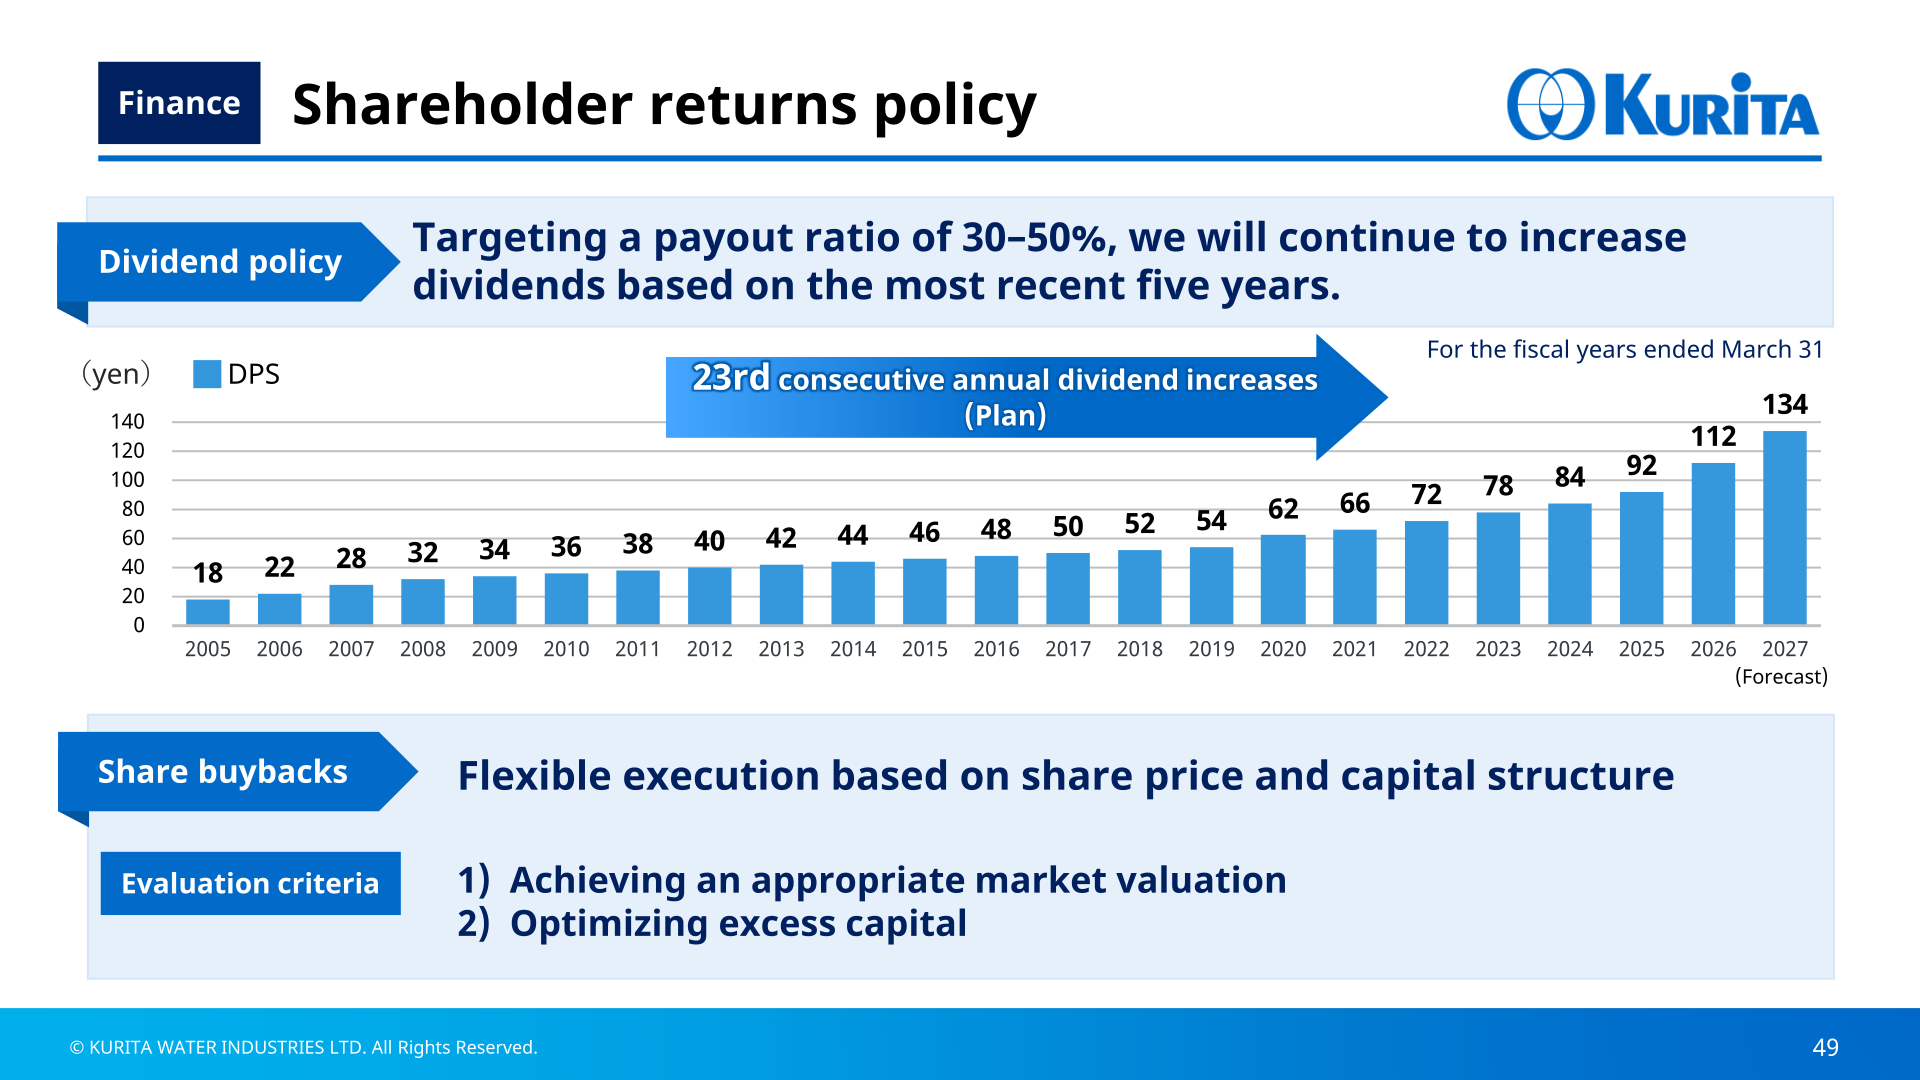
Kurita’s dividend policy targets a payout ratio of 30–50% and continued dividend increases based on the most recent five years. The dividends per share chart shows 92 yen for the fiscal year ended March 2025, 112 yen for the fiscal year ended March 2026, and a forecast of 134 yen for the fiscal year ending March 2027, which the company describes as the 23rd consecutive annual dividend increase (plan). Share buybacks are to be executed flexibly based on share price and capital structure, with the evaluation criteria being an appropriate market valuation and optimization of excess capital; the cash allocation slide notes share buybacks of 35 billion yen from May 2026. For FY03/27–FY03/28, the cash allocation policy envisages 140 billion yen of operating cash flow and 60 billion yen of debt financing as sources, against indicative uses of 25 billion yen for maintenance and renewal investments, 100 billion yen plus alpha for growth investment, and 65 billion yen plus alpha for shareholder returns, with a medium- to long-term equity ratio target of approximately 50%.
| Fiscal year ended March 31 | 2024 | 2025 | 2026 | 2027 (Forecast) |
|---|---|---|---|---|
| Dividends per share (yen) | 84 | 92 | 112 | 134 |
Medium-Term Plan (PSV-27) and Topics
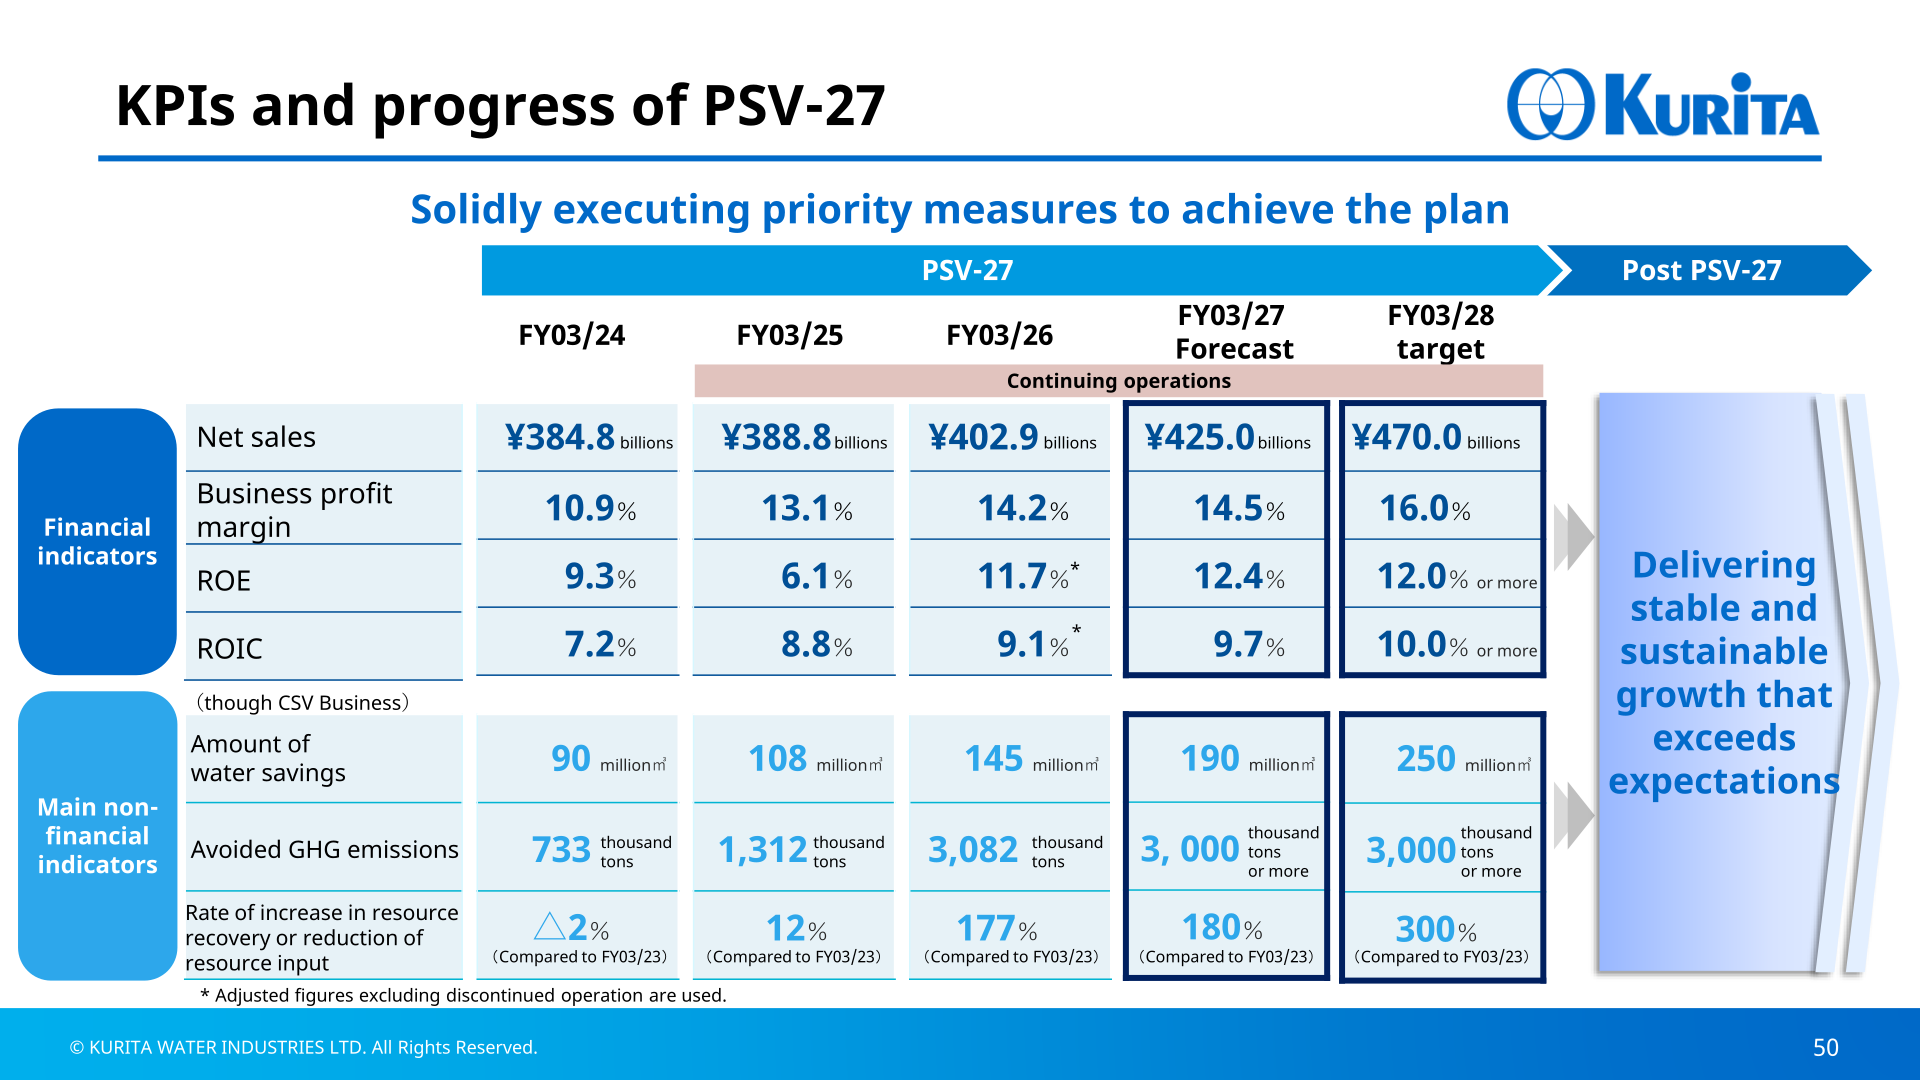
Under the PSV-27 medium-term management plan, Kurita targets for the fiscal year ending March 31, 2028 net sales of 470.0 billion yen, a business profit margin of 16.0%, ROE of 12.0% or more, and ROIC of 10.0% or more, alongside non-financial targets of 250 million cubic meters of water savings, 3,000 thousand tons or more of avoided GHG emissions, and a 300% rate of increase in resource recovery or reduction of resource input (all through the CSV business, compared to FY03/23). Progress in FY03/26 was net sales of 402.9 billion yen, a 14.2% business profit margin, adjusted ROE of 11.7%, adjusted ROIC of 9.1%, water savings of 145 million cubic meters, avoided GHG emissions of 3,082 thousand tons, and a 177% resource recovery rate. The company describes the results as steady progress toward the next growth phase beyond PSV-27, with priorities including a balanced mix of project-based and recurring business in the Electronics Industry segment, CSV business expansion and advanced maintenance enabled by NEXTANCE in the General Industry segment, and new businesses such as PFAS removal and treatment (investment in Cyclopure, Inc.), space-related water reclamation, and direct lithium extraction. On portfolio optimization, the company executed share transfer agreements for Kurita Creation Co., Ltd. (March 2026) and Pentagon Technologies Group, Inc. (May 2026), and established a water treatment chemicals company in Mexico in December 2025. Investment discipline is defined by a hurdle rate of a 9% base rate plus a deal-specific risk premium.
This article is an analysis based on publicly available information and is not a recommendation to buy or sell any specific securities. Investment decisions are your own responsibility.
![[Obayashi] Investors’ Guide 2026 — The Complete 24-Article Breakdown](https://japan-equity.com/wp-content/uploads/2026/07/hub_cover-1024x1024.png)
![[Obayashi] IR & SR Policy — Feeding Dialogue Back into Management](https://japan-equity.com/wp-content/uploads/2026/07/p32_sq-1024x1024.jpg)
![[Obayashi] Real Estate Development — 18.7% Margin, ¥287.7bn Unrealized Gains](https://japan-equity.com/wp-content/uploads/2026/07/p20_sq-1024x1024.jpg)
![[Obayashi] Domestic Civil Engineering — Resilience Spending Supports 9.6% Margin](https://japan-equity.com/wp-content/uploads/2026/07/p11_sq-1024x1024.jpg)
![[Obayashi] Share Price & External Ratings — vs TOPIX, ESG Index Inclusion](https://japan-equity.com/wp-content/uploads/2026/07/p40_sq-1024x1024.jpg)
![[Construction] ¥75.5tn Investment, Shrinking Workforce — Big-5 Market Share](https://japan-equity.com/wp-content/uploads/2026/07/p12_sq-1024x1024.jpg)



![[Obayashi] Capital Policy & Shareholder Returns — ROE 10%+, DOE ~5%, ¥100bn Buyback](https://japan-equity.com/wp-content/uploads/2026/07/p27_sq-1024x1024.jpg)
![[Obayashi] Reducing Cross-Shareholdings — ¥285.2bn Sold in Five Years](https://japan-equity.com/wp-content/uploads/2026/07/p29_sq-1024x1024.jpg)
![[Obayashi] ¥750bn Investment Plan — ¥300bn to Development, ¥190bn to Tech/DX](https://japan-equity.com/wp-content/uploads/2026/07/p30_sq-1024x1024.jpg)
![[Obayashi] MTP2022 KPIs — Operating Profit ~2x Target, ROE 14.4%](https://japan-equity.com/wp-content/uploads/2026/07/p25_sq-1024x1024.jpg)
![[Obayashi] Cash Allocation — ¥420bn Investment CF Over Five Years](https://japan-equity.com/wp-content/uploads/2026/07/p26_sq-1024x1024.jpg)
![[Obayashi] Green Energy — 44 Plants, 344MW, and the Green Hydrogen Challenge](https://japan-equity.com/wp-content/uploads/2026/07/p21_sq-1024x1024.jpg)
![[Obayashi] Tackling the Labor Shortage — Robotics Construction®](https://japan-equity.com/wp-content/uploads/2026/07/p14_sq-1024x1024.jpg)
