
This article is based on publicly available IR materials and is not a recommendation to buy or sell any specific securities.
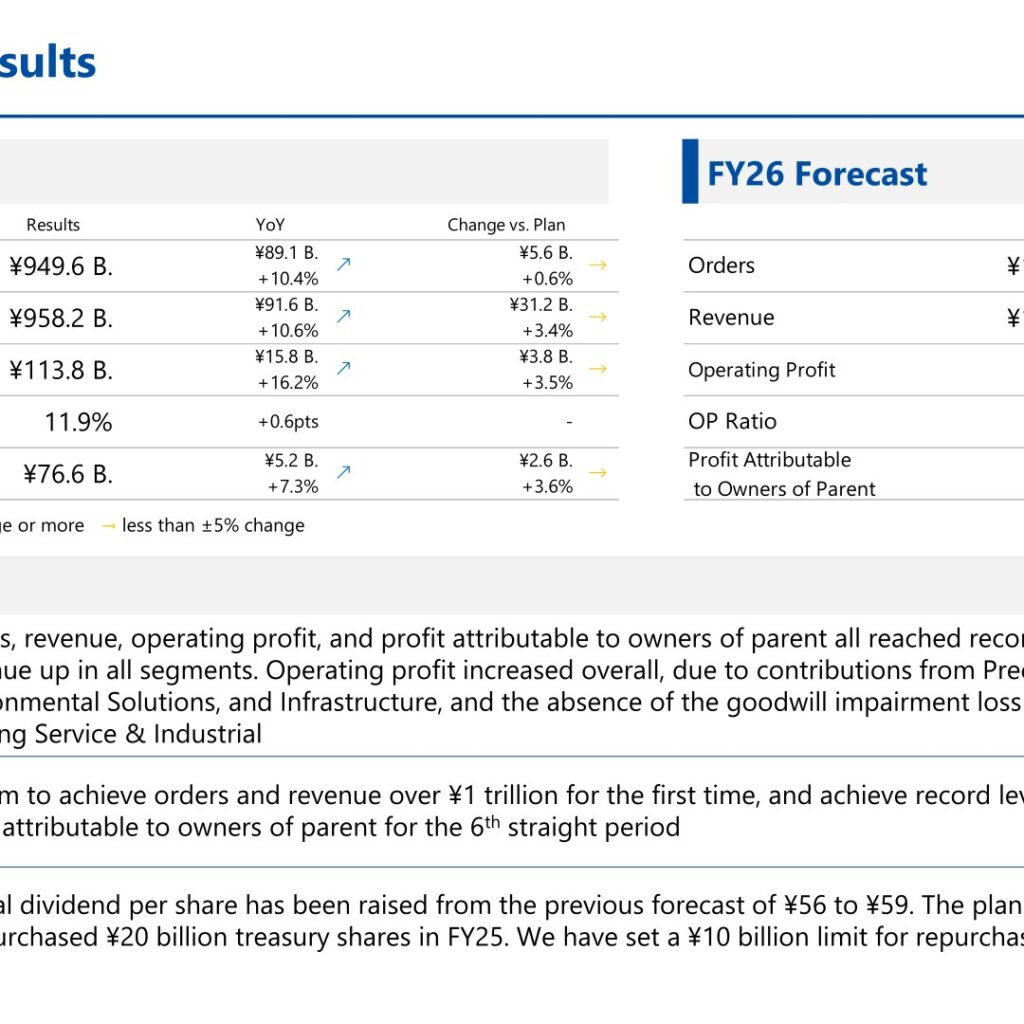
Note: EBARA’s fiscal year ends on December 31. The company labels the fiscal year ended December 31, 2025 as “FY25” and the fiscal year ending December 31, 2026 as “FY26”; the text and tables below keep the company’s own labels. For FY25, EBARA CORPORATION reported IFRS-based orders of ¥949.6 billion (+10.4% year on year), revenue of ¥958.2 billion (+10.6%), operating profit of ¥113.8 billion (+16.2%) and profit attributable to owners of parent of ¥76.6 billion (+7.3%), with orders, revenue, operating profit and profit attributable to owners of parent all reaching record highs. Revenue rose in all segments, and the annual dividend per share was raised from the previous forecast of ¥56 to ¥59. For FY26, the company plans orders of ¥1,070.0 billion and revenue of ¥1,020.0 billion, aiming to exceed ¥1 trillion in both for the first time, with operating profit of ¥125.0 billion and an annual dividend of ¥66.
Consolidated Results (Full-Year Actual)
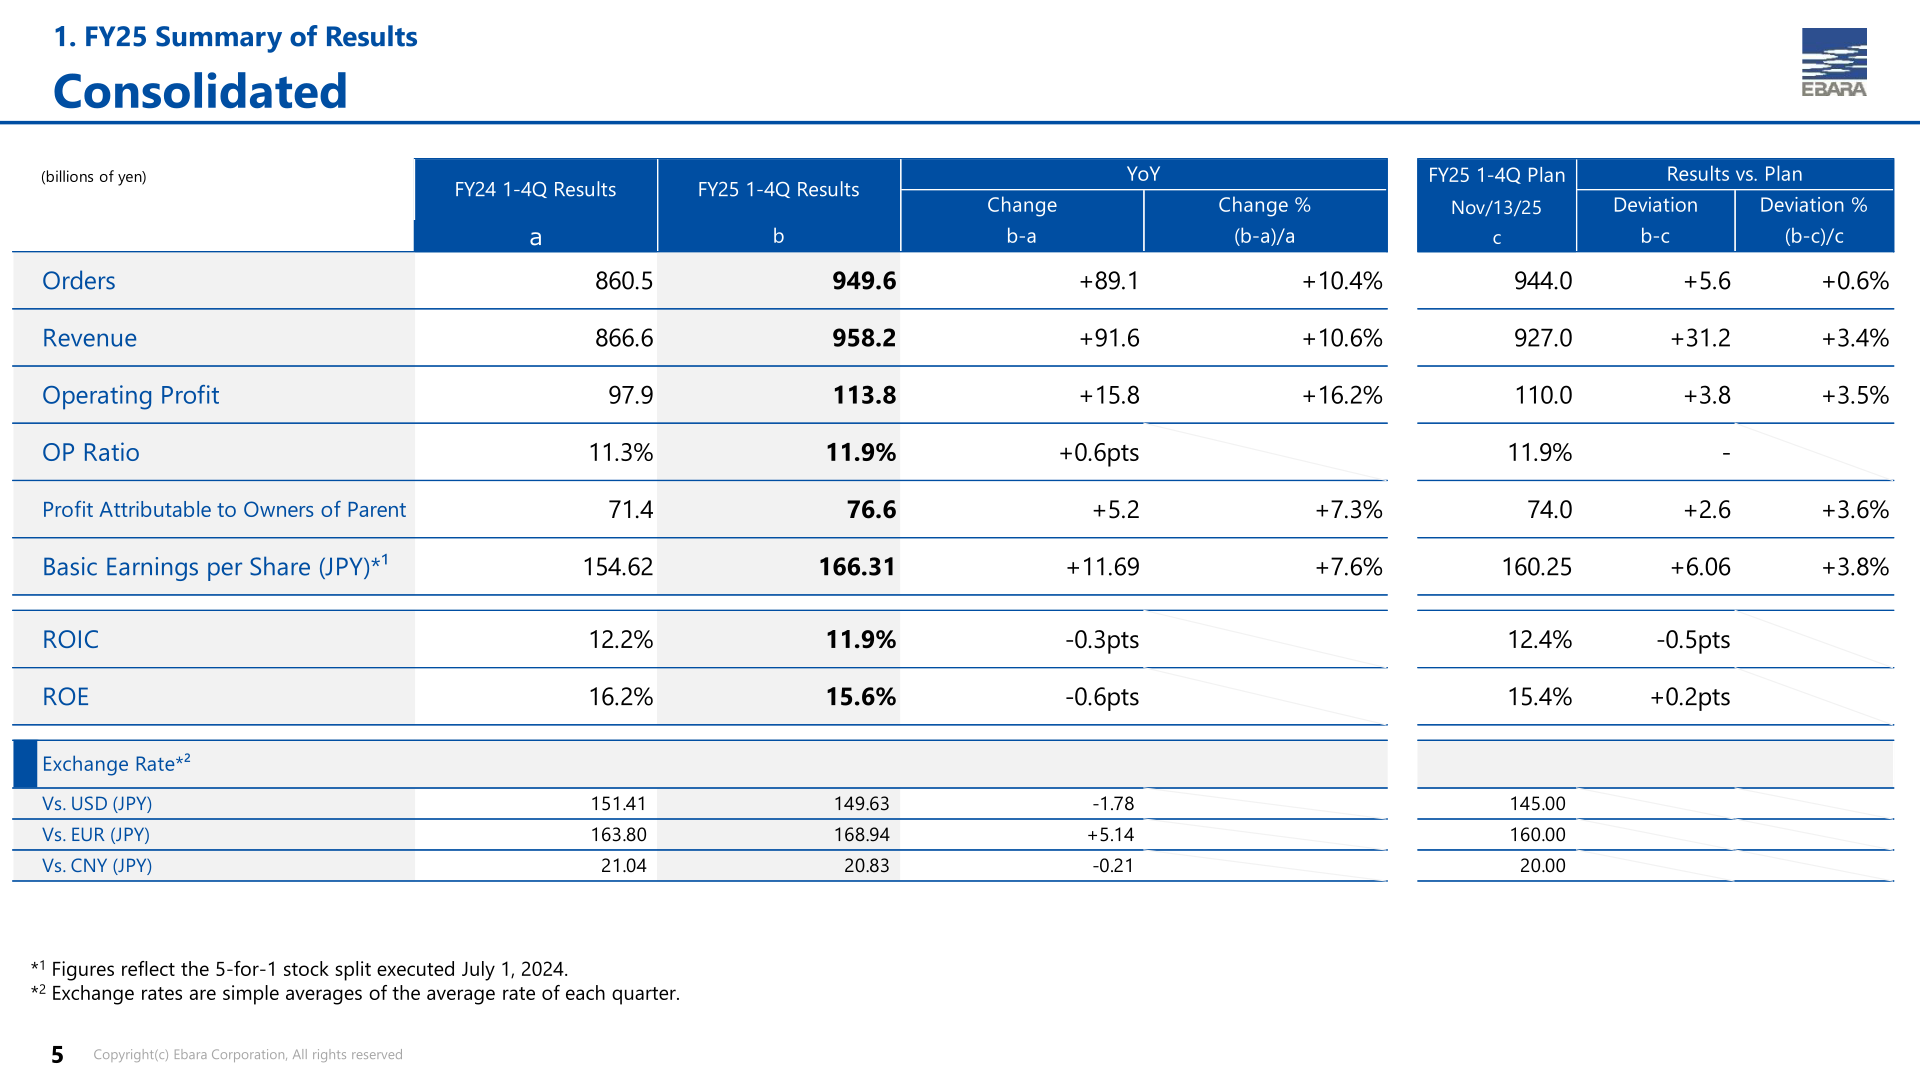
Orders for FY25 1-4Q were ¥949.6 billion, up ¥89.1 billion (+10.4%) from ¥860.5 billion in FY24, and ¥5.6 billion (+0.6%) above the plan of ¥944.0 billion announced on November 13, 2025. Revenue increased ¥91.6 billion (+10.6%) to ¥958.2 billion, ¥31.2 billion (+3.4%) above the ¥927.0 billion plan. Operating profit rose ¥15.8 billion (+16.2%) to ¥113.8 billion, lifting the OP ratio by 0.6 points to 11.9%; this was ¥3.8 billion (+3.5%) above the ¥110.0 billion plan. Profit attributable to owners of parent increased ¥5.2 billion (+7.3%) to ¥76.6 billion, and basic earnings per share rose ¥11.69 (+7.6%) to ¥166.31 (figures reflect the 5-for-1 stock split executed July 1, 2024). ROIC was 11.9% (-0.3 points) and ROE was 15.6% (-0.6 points). The company stated that operating profit increased overall due to contributions from Precision Machinery, Environmental Solutions and Infrastructure, and the absence of the goodwill impairment loss recorded last year by Building Service & Industrial; revenue growth outpaced increases in fixed costs. In the breakdown of changes in operating profit (from ¥97.9 billion to ¥113.7 billion), revenue contributed +¥42.6 billion, profitability -¥4.4 billion, fixed cost -¥26.0 billion, foreign exchange -¥0.6 billion and others +¥4.2 billion.
| Item (billions of yen) | FY24 1-4Q Results | FY25 1-4Q Results | YoY Change | YoY Change % | Plan (Nov/13/25) | Deviation |
|---|---|---|---|---|---|---|
| Orders | 860.5 | 949.6 | +89.1 | +10.4% | 944.0 | +5.6 (+0.6%) |
| Revenue | 866.6 | 958.2 | +91.6 | +10.6% | 927.0 | +31.2 (+3.4%) |
| Operating Profit | 97.9 | 113.8 | +15.8 | +16.2% | 110.0 | +3.8 (+3.5%) |
| OP Ratio | 11.3% | 11.9% | +0.6pts | – | 11.9% | – |
| Profit Attributable to Owners of Parent | 71.4 | 76.6 | +5.2 | +7.3% | 74.0 | +2.6 (+3.6%) |
| Basic Earnings per Share (JPY) | 154.62 | 166.31 | +11.69 | +7.6% | 160.25 | +6.06 (+3.8%) |
| ROIC | 12.2% | 11.9% | -0.3pts | – | 12.4% | -0.5pts |
| ROE | 16.2% | 15.6% | -0.6pts | – | 15.4% | +0.2pts |
By region, revenue in Japan was ¥320.3 billion (+10.2%) and overseas revenue was ¥637.9 billion (+10.8%); overseas accounted for 67% of revenue. Among overseas regions, Taiwan, South Korea and other Asia grew +49.9% to ¥193.5 billion, while China declined -4.8% to ¥181.1 billion and North America declined -5.7% to ¥116.6 billion. Exchange rates used were ¥149.63 vs. USD (FY24: ¥151.41), ¥168.94 vs. EUR (¥163.80) and ¥20.83 vs. CNY (¥21.04).
Segment Results
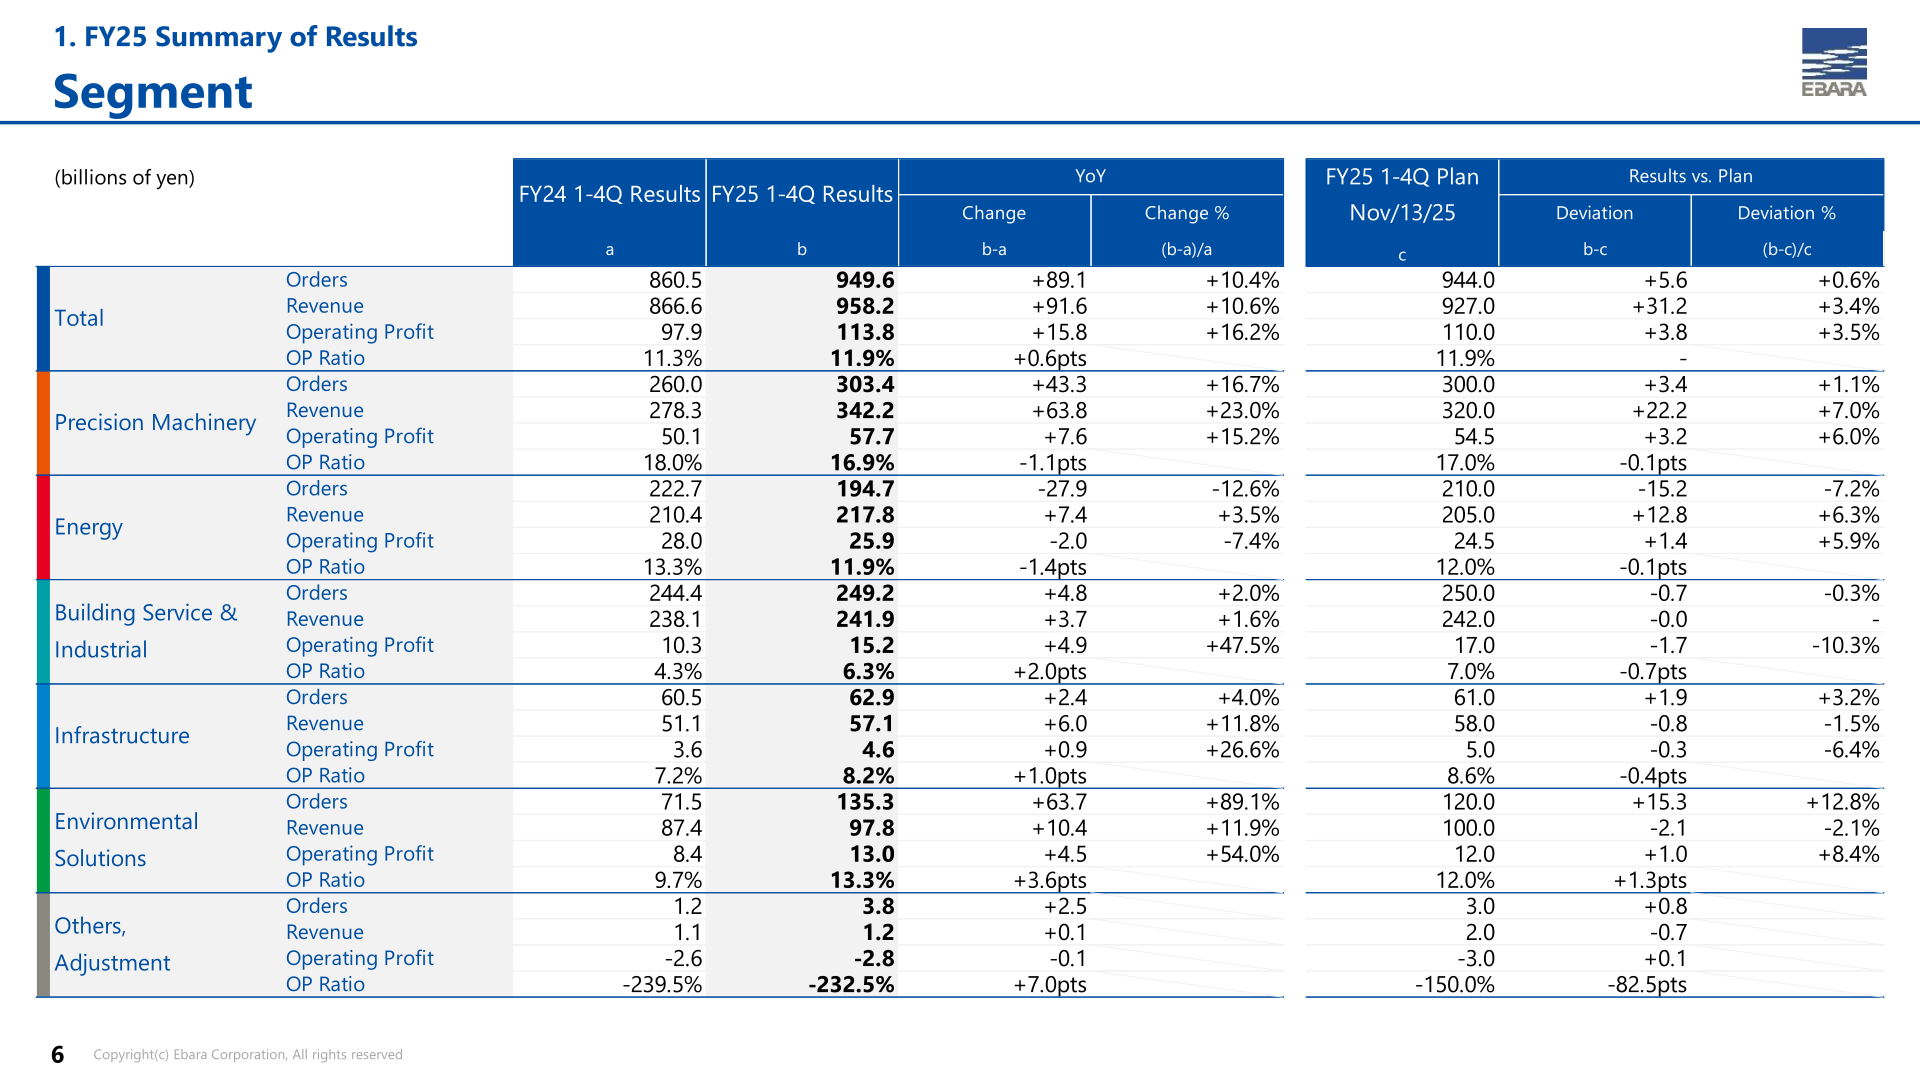
Precision Machinery posted orders of ¥303.4 billion (+16.7%), revenue of ¥342.2 billion (+23.0%) and operating profit of ¥57.7 billion (+15.2%), with the OP ratio declining 1.1 points to 16.9%. Both products and S&S increased due to the recovery in demand for CMP and Components, while profitability declined due to project mix and a lower S&S ratio (FY25 S&S ratio 28% vs. 31% in FY24), and labor and R&D costs were higher. Energy recorded orders of ¥194.7 billion (-12.6%) on fewer petrochemical projects, revenue of ¥217.8 billion (+3.5%) and operating profit of ¥25.9 billion (-7.4%), reflecting higher labor costs and the absence of the one-time gain from land sales recorded in the previous year. Building Service & Industrial reported orders of ¥249.2 billion (+2.0%), revenue of ¥241.9 billion (+1.6%) and operating profit of ¥15.2 billion (+47.5%); higher S&S revenue in Japan offset the decline in China, and the absence of the goodwill impairment from Turkish subsidiary Vansan recorded in FY24 contributed, partly offset by a one-time provision for doubtful accounts due to a U.S. customer bankruptcy in FY25 2Q. Infrastructure posted orders of ¥62.9 billion (+4.0%), revenue of ¥57.1 billion (+11.8%) and operating profit of ¥4.6 billion (+26.6%), as backlogged public sector orders and overseas orders were steadily fulfilled. Environmental Solutions secured four large-scale projects, lifting orders to ¥135.3 billion (+89.1%), with revenue of ¥97.8 billion (+11.9%) and operating profit of ¥13.0 billion (+54.0%), helped by an O&M mix change and the reversal of contingencies on completed EPC projects.
| Segment (billions of yen) | Metric | FY24 1-4Q | FY25 1-4Q | YoY Change | YoY Change % |
|---|---|---|---|---|---|
| Precision Machinery | Orders | 260.0 | 303.4 | +43.3 | +16.7% |
| Precision Machinery | Revenue | 278.3 | 342.2 | +63.8 | +23.0% |
| Precision Machinery | Operating Profit | 50.1 | 57.7 | +7.6 | +15.2% |
| Precision Machinery | OP Ratio | 18.0% | 16.9% | -1.1pts | – |
| Energy | Orders | 222.7 | 194.7 | -27.9 | -12.6% |
| Energy | Revenue | 210.4 | 217.8 | +7.4 | +3.5% |
| Energy | Operating Profit | 28.0 | 25.9 | -2.0 | -7.4% |
| Energy | OP Ratio | 13.3% | 11.9% | -1.4pts | – |
| Building Service & Industrial | Orders | 244.4 | 249.2 | +4.8 | +2.0% |
| Building Service & Industrial | Revenue | 238.1 | 241.9 | +3.7 | +1.6% |
| Building Service & Industrial | Operating Profit | 10.3 | 15.2 | +4.9 | +47.5% |
| Building Service & Industrial | OP Ratio | 4.3% | 6.3% | +2.0pts | – |
| Infrastructure | Orders | 60.5 | 62.9 | +2.4 | +4.0% |
| Infrastructure | Revenue | 51.1 | 57.1 | +6.0 | +11.8% |
| Infrastructure | Operating Profit | 3.6 | 4.6 | +0.9 | +26.6% |
| Infrastructure | OP Ratio | 7.2% | 8.2% | +1.0pts | – |
| Environmental Solutions | Orders | 71.5 | 135.3 | +63.7 | +89.1% |
| Environmental Solutions | Revenue | 87.4 | 97.8 | +10.4 | +11.9% |
| Environmental Solutions | Operating Profit | 8.4 | 13.0 | +4.5 | +54.0% |
| Environmental Solutions | OP Ratio | 9.7% | 13.3% | +3.6pts | – |
| Others, Adjustment | Orders | 1.2 | 3.8 | +2.5 | – |
| Others, Adjustment | Revenue | 1.1 | 1.2 | +0.1 | – |
| Others, Adjustment | Operating Profit | -2.6 | -2.8 | -0.1 | – |
FY26 Forecast
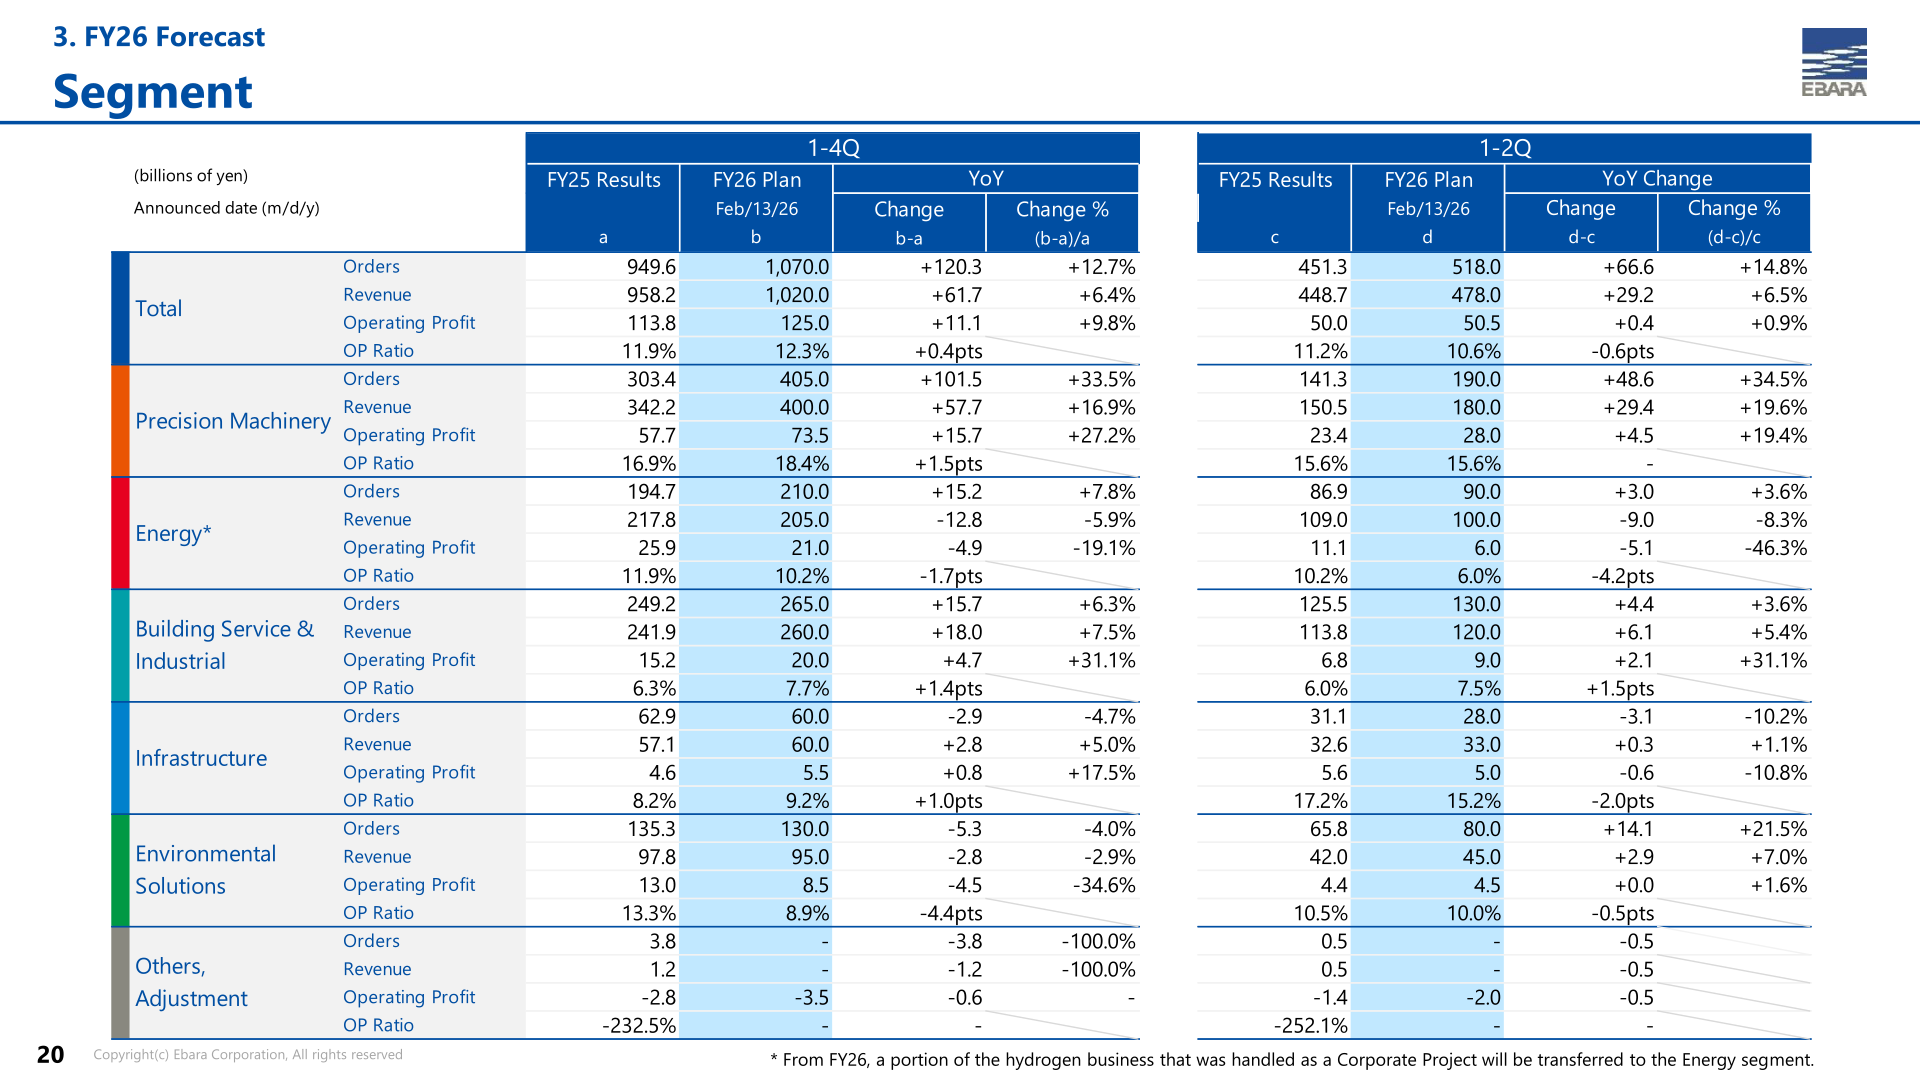
For FY26 (fiscal year ending December 31, 2026), the plan announced on February 13, 2026 calls for orders of ¥1,070.0 billion (+12.7%), revenue of ¥1,020.0 billion (+6.4%), operating profit of ¥125.0 billion (+9.8%), an OP ratio of 12.3% (+0.4 points) and profit attributable to owners of parent of ¥86.6 billion (+13.0%). The company aims to exceed ¥1 trillion in orders and revenue for the first time and to achieve record levels of operating profit and profit attributable to owners of parent for the 6th straight period. Basic earnings per share are planned at ¥189.67 (+14.0%), ROIC at 12.0% and ROE at 16.5%. Assumed exchange rates are ¥145.00 vs. USD, ¥175.00 vs. EUR and ¥20.00 vs. CNY. By segment, Precision Machinery is planned to drive growth with orders of ¥405.0 billion (+33.5%), revenue of ¥400.0 billion (+16.9%) and operating profit of ¥73.5 billion (+27.2%) on higher revenue driven by sustained demand, particularly in generative AI. Energy operating profit is planned to decline to ¥21.0 billion (-19.1%) on lower revenue and higher fixed costs, including the transfer of a portion of the hydrogen business (from FY26, a portion of the hydrogen business that was handled as a Corporate Project will be transferred to the Energy segment). Building Service & Industrial operating profit is planned at ¥20.0 billion (+31.1%), Infrastructure at ¥5.5 billion (+17.5%) and Environmental Solutions at ¥8.5 billion (-34.6%), the latter reflecting lower revenue and higher fixed costs including increased depreciation for the chemical-recycling pilot plant and higher R&D expenses. In the company’s market outlook for FY26, global wafer fab equipment is expected to grow more than 10%, global LNG in the 6%-range and ethylene in the 3%-range.
| Item (billions of yen) | FY25 Results | FY26 Plan (Feb/13/26) | Change | Change % |
|---|---|---|---|---|
| Orders | 949.6 | 1,070.0 | +120.3 | +12.7% |
| Revenue | 958.2 | 1,020.0 | +61.7 | +6.4% |
| Operating Profit | 113.8 | 125.0 | +11.1 | +9.8% |
| OP Ratio | 11.9% | 12.3% | +0.4pts | – |
| Profit Attributable to Owners of Parent | 76.6 | 86.6 | +9.9 | +13.0% |
| ROIC | 11.9% | 12.0% | +0.1pts | – |
| ROE | 15.6% | 16.5% | +0.9pts | – |
| Basic Earnings per Share (JPY) | 166.31 | 189.67 | +23.36 | +14.0% |
| Annual Dividend per Share (JPY) | 59.0 | 66.0 | +7.0 | – |
| Segment (billions of yen) | Metric | FY25 Results | FY26 Plan | Change | Change % |
|---|---|---|---|---|---|
| Precision Machinery | Orders | 303.4 | 405.0 | +101.5 | +33.5% |
| Precision Machinery | Revenue | 342.2 | 400.0 | +57.7 | +16.9% |
| Precision Machinery | Operating Profit | 57.7 | 73.5 | +15.7 | +27.2% |
| Energy | Orders | 194.7 | 210.0 | +15.2 | +7.8% |
| Energy | Revenue | 217.8 | 205.0 | -12.8 | -5.9% |
| Energy | Operating Profit | 25.9 | 21.0 | -4.9 | -19.1% |
| Building Service & Industrial | Orders | 249.2 | 265.0 | +15.7 | +6.3% |
| Building Service & Industrial | Revenue | 241.9 | 260.0 | +18.0 | +7.5% |
| Building Service & Industrial | Operating Profit | 15.2 | 20.0 | +4.7 | +31.1% |
| Infrastructure | Orders | 62.9 | 60.0 | -2.9 | -4.7% |
| Infrastructure | Revenue | 57.1 | 60.0 | +2.8 | +5.0% |
| Infrastructure | Operating Profit | 4.6 | 5.5 | +0.8 | +17.5% |
| Environmental Solutions | Orders | 135.3 | 130.0 | -5.3 | -4.0% |
| Environmental Solutions | Revenue | 97.8 | 95.0 | -2.8 | -2.9% |
| Environmental Solutions | Operating Profit | 13.0 | 8.5 | -4.5 | -34.6% |
| Others, Adjustment | Operating Profit | -2.8 | -3.5 | -0.6 | – |
Shareholder Returns
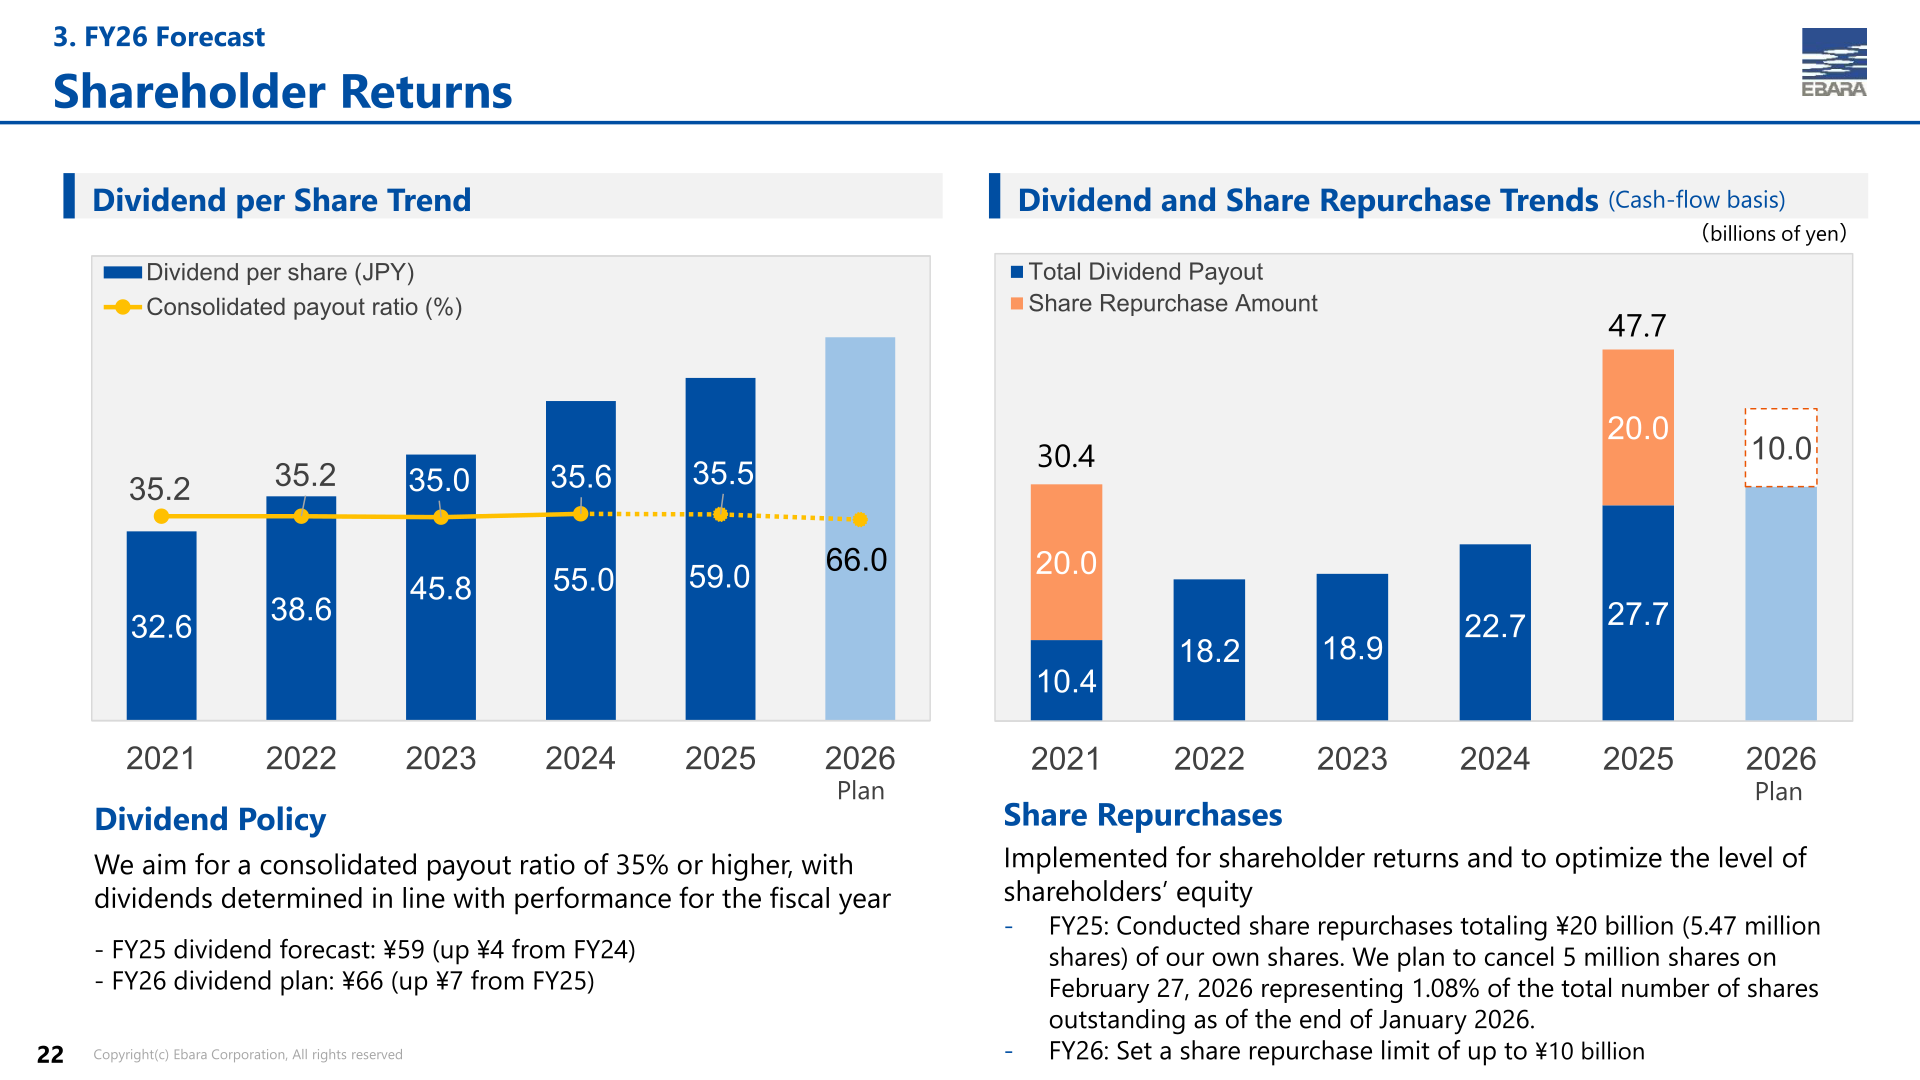
EBARA’s dividend policy aims for a consolidated payout ratio of 35% or higher, with dividends determined in line with performance for the fiscal year. The FY25 annual dividend per share was raised from the previous forecast of ¥56 to ¥59 (up ¥4 from FY24’s ¥55), and the FY26 dividend plan is ¥66 (up ¥7 from FY25). Share repurchases are implemented for shareholder returns and to optimize the level of shareholders’ equity: in FY25 the company conducted share repurchases totaling ¥20 billion (5.47 million shares) and plans to cancel 5 million shares on February 27, 2026, representing 1.08% of the total number of shares outstanding as of the end of January 2026. For FY26, a share repurchase limit of up to ¥10 billion has been set.
| Item | FY24 | FY25 | FY26 (Plan) |
|---|---|---|---|
| Dividend per share (JPY) | 55 | 59 | 66 |
| Share repurchases | – | ¥20 billion (5.47 million shares) | Limit of up to ¥10 billion |
Balance Sheet, Cash Flows and Investment
Total assets at the end of FY25 4Q were ¥1,082.2 billion (+¥77.1 billion from FY24 4Q), with total equity of ¥521.6 billion (+¥36.3 billion) and an equity ratio of 47.0% (-0.1 points). Interest-bearing debt increased ¥74.3 billion to ¥224.7 billion, and the debt-to-equity ratio rose from 0.32 to 0.44. Cash flow from operating activities was ¥40.7 billion (FY24: ¥100.9 billion), cash flow from investing activities was -¥91.2 billion, and free cash flow was -¥50.4 billion (FY24: ¥52.3 billion). For FY26, the company plans operating cash flow of ¥100.0 billion and FCF of ¥20.0 billion. CAPEX rose to ¥100.7 billion in FY25 (FY24: ¥58.6 billion), including ¥34.0 billion in Precision Machinery, and is planned at ¥99.0 billion for FY26; D&A was ¥34.8 billion (FY26 plan: ¥42.0 billion) and R&D expenses were ¥23.2 billion (FY26 plan: ¥25.0 billion).
This article is an analysis based on publicly available information and is not a recommendation to buy or sell any specific securities. Investment decisions are your own responsibility.
![[Obayashi] Investors’ Guide 2026 — The Complete 24-Article Breakdown](https://japan-equity.com/wp-content/uploads/2026/07/hub_cover-1024x1024.png)
![[Obayashi] IR & SR Policy — Feeding Dialogue Back into Management](https://japan-equity.com/wp-content/uploads/2026/07/p32_sq-1024x1024.jpg)
![[Obayashi] Real Estate Development — 18.7% Margin, ¥287.7bn Unrealized Gains](https://japan-equity.com/wp-content/uploads/2026/07/p20_sq-1024x1024.jpg)
![[Obayashi] Domestic Civil Engineering — Resilience Spending Supports 9.6% Margin](https://japan-equity.com/wp-content/uploads/2026/07/p11_sq-1024x1024.jpg)
![[Obayashi] Share Price & External Ratings — vs TOPIX, ESG Index Inclusion](https://japan-equity.com/wp-content/uploads/2026/07/p40_sq-1024x1024.jpg)
![[Construction] ¥75.5tn Investment, Shrinking Workforce — Big-5 Market Share](https://japan-equity.com/wp-content/uploads/2026/07/p12_sq-1024x1024.jpg)



![[Obayashi] Capital Policy & Shareholder Returns — ROE 10%+, DOE ~5%, ¥100bn Buyback](https://japan-equity.com/wp-content/uploads/2026/07/p27_sq-1024x1024.jpg)
![[Obayashi] Reducing Cross-Shareholdings — ¥285.2bn Sold in Five Years](https://japan-equity.com/wp-content/uploads/2026/07/p29_sq-1024x1024.jpg)
![[Obayashi] ¥750bn Investment Plan — ¥300bn to Development, ¥190bn to Tech/DX](https://japan-equity.com/wp-content/uploads/2026/07/p30_sq-1024x1024.jpg)
![[Obayashi] MTP2022 KPIs — Operating Profit ~2x Target, ROE 14.4%](https://japan-equity.com/wp-content/uploads/2026/07/p25_sq-1024x1024.jpg)
![[Obayashi] Cash Allocation — ¥420bn Investment CF Over Five Years](https://japan-equity.com/wp-content/uploads/2026/07/p26_sq-1024x1024.jpg)
![[Obayashi] Green Energy — 44 Plants, 344MW, and the Green Hydrogen Challenge](https://japan-equity.com/wp-content/uploads/2026/07/p21_sq-1024x1024.jpg)
![[Obayashi] Tackling the Labor Shortage — Robotics Construction®](https://japan-equity.com/wp-content/uploads/2026/07/p14_sq-1024x1024.jpg)
