
This article is based on publicly available IR materials and is not a recommendation to buy or sell any specific securities.
Tsukishima Holdings reported that net sales and all profit items hit record highs in FY2025. Net sales rose to 1,490 (100 million yen) and operating profit to 98, while profit attributable to owners of parent increased sharply to 169 on gains from the sale of logistics facilities. Orders received declined to 1,542 because the Water Environmental Business passed through a transitional period between large-scale projects, but order backlog hit a record high of 3,235. For FY2026 the company forecasts record orders received, net sales and operating profit, while profit attributable to owners of parent is expected to fall on the absence of the logistics facility gain.
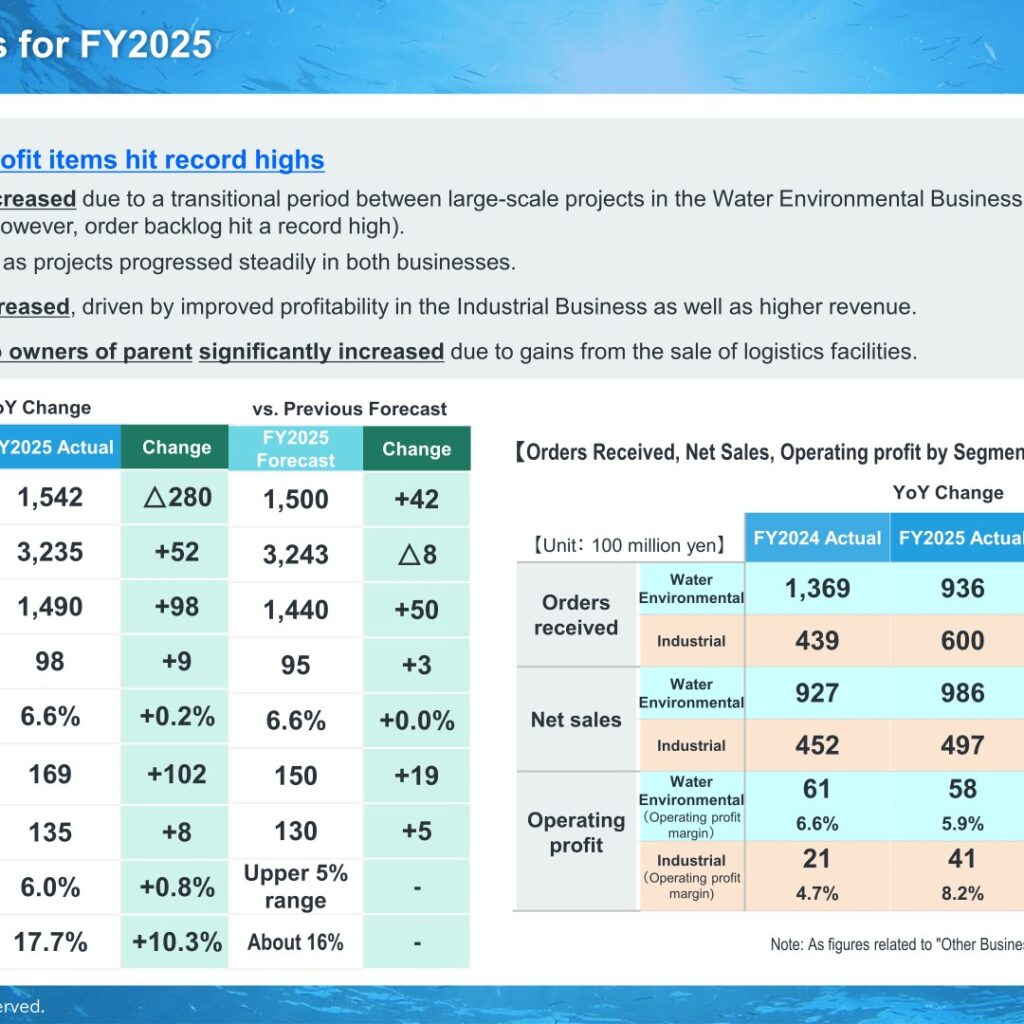
Consolidated Results (FY2025 Actual)
The company describes FY2025 as a year in which net sales and all profit items hit record highs. Orders received decreased due to a transitional period between large-scale projects in the Water Environmental Business, although the Industrial Business performed strongly and order backlog hit a record high. Net sales increased as projects progressed steadily in both businesses, and operating profit increased driven by improved profitability in the Industrial Business as well as higher revenue. Profit attributable to owners of parent increased significantly due to gains from the sale of logistics facilities. Results also came in above the previous forecast for orders received, net sales, operating profit, profit attributable to owners of parent and EBITDA.
| Item (Unit: 100 million yen) | FY2024 Actual | FY2025 Actual | Change | FY2025 Forecast | Change vs. Forecast |
|---|---|---|---|---|---|
| Orders received | 1,822 | 1,542 | △280 | 1,500 | +42 |
| Order backlog | 3,183 | 3,235 | +52 | 3,243 | △8 |
| Net sales | 1,392 | 1,490 | +98 | 1,440 | +50 |
| Operating profit | 89 | 98 | +9 | 95 | +3 |
| Operating profit margin | 6.4% | 6.6% | +0.2% | 6.6% | +0.0% |
| Profit attributable to owners of parent | 67 | 169 | +102 | 150 | +19 |
| EBITDA | 127 | 135 | +8 | 130 | +5 |
| ROIC | 5.2% | 6.0% | +0.8% | Upper 5% range | – |
| ROE | 7.4% | 17.7% | +10.3% | About 16% | – |
On the balance sheet, total assets increased by ¥10.8 billion, primarily attributable to increases in inventories, moving from 192.2 billion yen at the end of FY2024 to 203 billion yen at the end of FY2025. Liabilities increased by ¥5.4 billion due to increases in income taxes payable and accounts payable, and net assets increased by ¥5.4 billion due to increases in valuation difference on available-for-sale securities and retained earnings. The net assets ratio was 48.4% in both years. Cash flows from operating activities increased by 5.2 billion yen due to an increase in profit before income taxes, cash flows from investing activities increased by 27.2 billion yen due to proceeds from the sale of logistics facilities and investment securities, and cash flows from financing activities decreased by 21.6 billion yen due to expenditures for the acquisition of treasury shares and dividend payments. Cash and cash equivalents rose by 10.7 billion yen, from 27.5 billion yen to 38.2 billion yen.
Segment Results
The group reports two main segments, the Water Environmental Business and the Industrial Business, plus Other Business. In the Water Environmental Business, orders received fell to 936 as large-scale projects entered a transitional period, while net sales rose to 986 and operating profit fell to 58 as gross profit margin on net sales declined from 19.6% to 18.8% on a decrease in insurance income and lower profitability in certain projects, together with higher SG&A from human capital investment and R&D. In the Industrial Business, orders received rose to 600 on large-scale environmental projects, net sales rose to 497, and operating profit nearly doubled to 41 as gross profit margin on net sales improved from 23.3% to 25.4%. The company notes that figures related to Other Business are excluded, so segment totals do not match consolidated figures.
| Metric (Unit: 100 million yen) | Segment | FY2024 Actual | FY2025 Actual | Change | FY2025 Forecast | Change vs. Forecast |
|---|---|---|---|---|---|---|
| Orders received | Water Environmental | 1,369 | 936 | △433 | 900 | +36 |
| Orders received | Industrial | 439 | 600 | +161 | 594 | +6 |
| Net sales | Water Environmental | 927 | 986 | +59 | 940 | +46 |
| Net sales | Industrial | 452 | 497 | +45 | 494 | +3 |
| Operating profit | Water Environmental | 61 | 58 | △3 | 60 | △2 |
| Operating profit margin | Water Environmental | 6.6% | 5.9% | △0.7% | 6.4% | △0.5% |
| Operating profit | Industrial | 21 | 41 | +20 | 32 | +9 |
| Operating profit margin | Industrial | 4.7% | 8.2% | +3.5% | 6.5% | +1.7% |
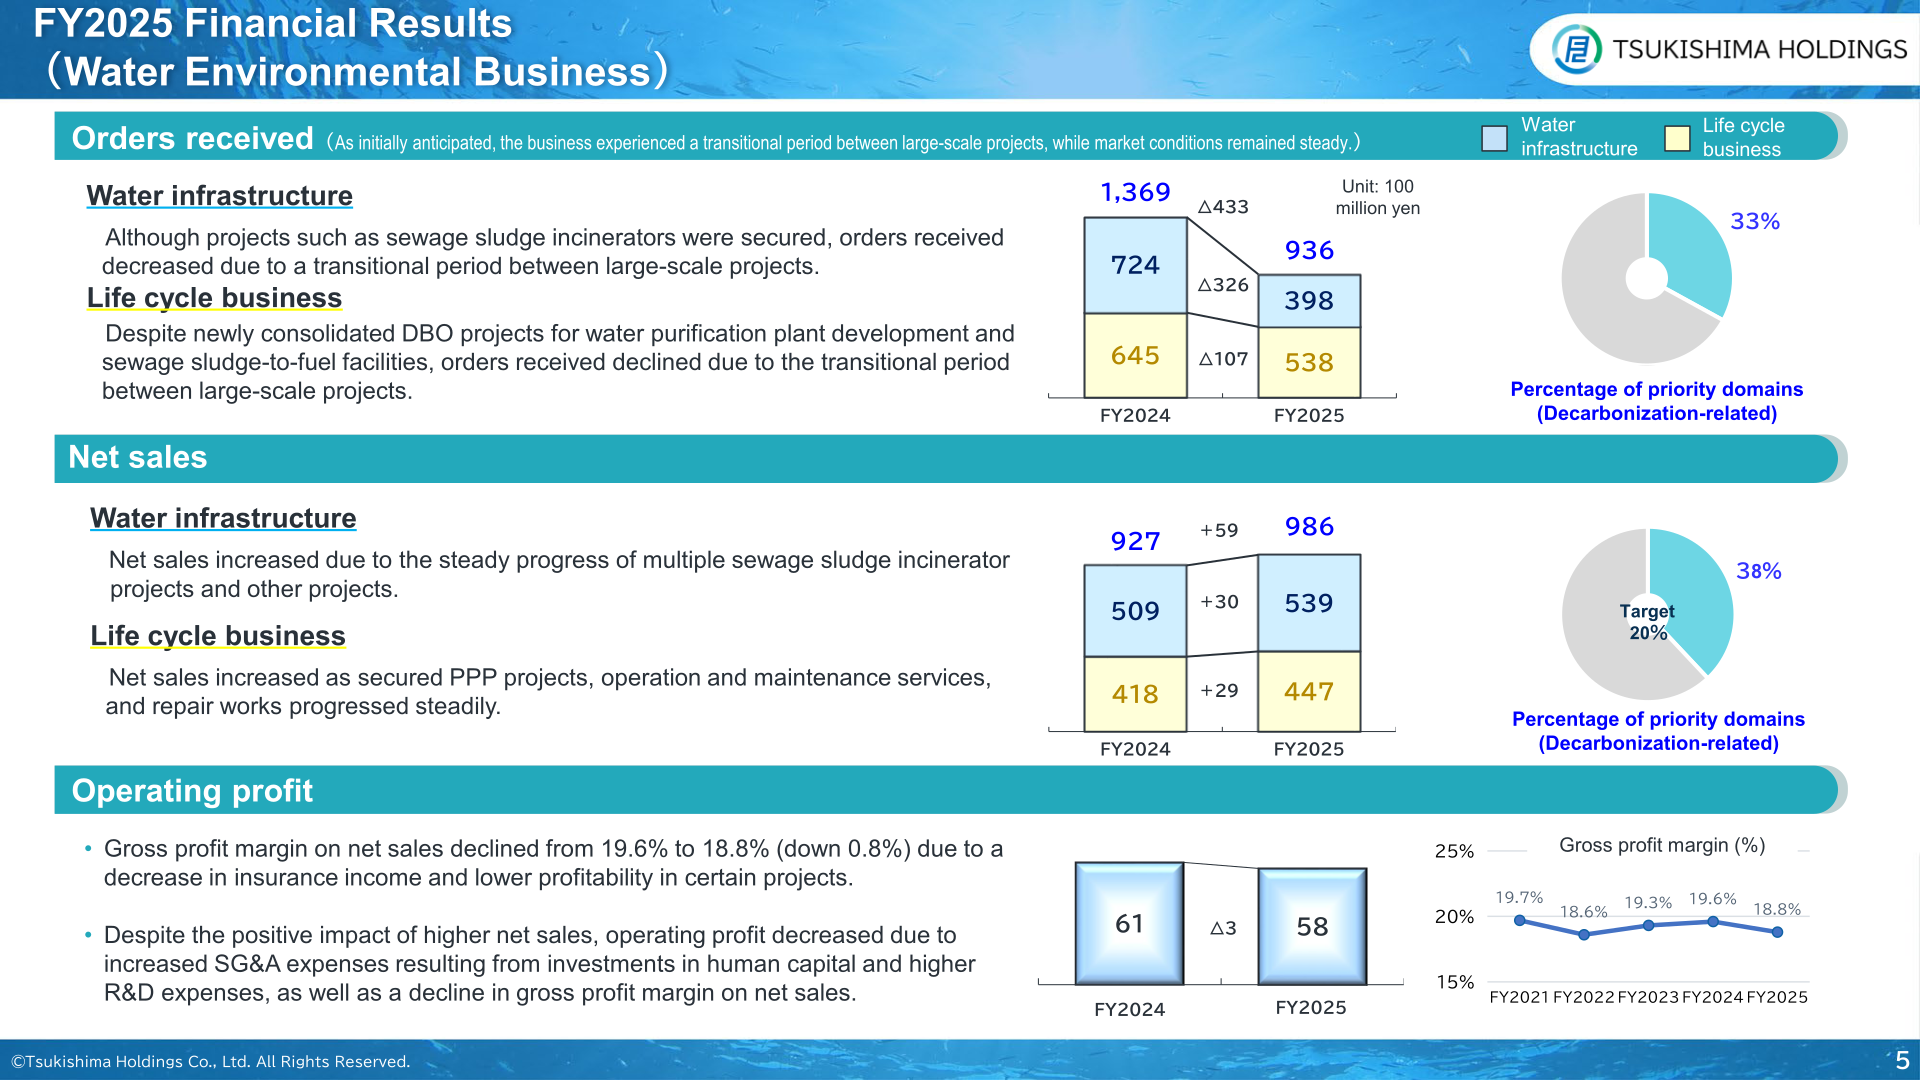
Within the Water Environmental Business, orders received in water infrastructure fell from 724 to 398 (△326) as a transitional period between large-scale projects offset newly secured work such as sewage sludge incinerators, while life cycle business orders fell from 645 to 538 (△107) despite newly consolidated DBO projects for water purification plant development and sewage sludge-to-fuel facilities. Net sales in water infrastructure rose from 509 to 539 (+30) on the steady progress of multiple sewage sludge incinerator projects, and life cycle business net sales rose from 418 to 447 (+29) as secured PPP projects, operation and maintenance services and repair works progressed.
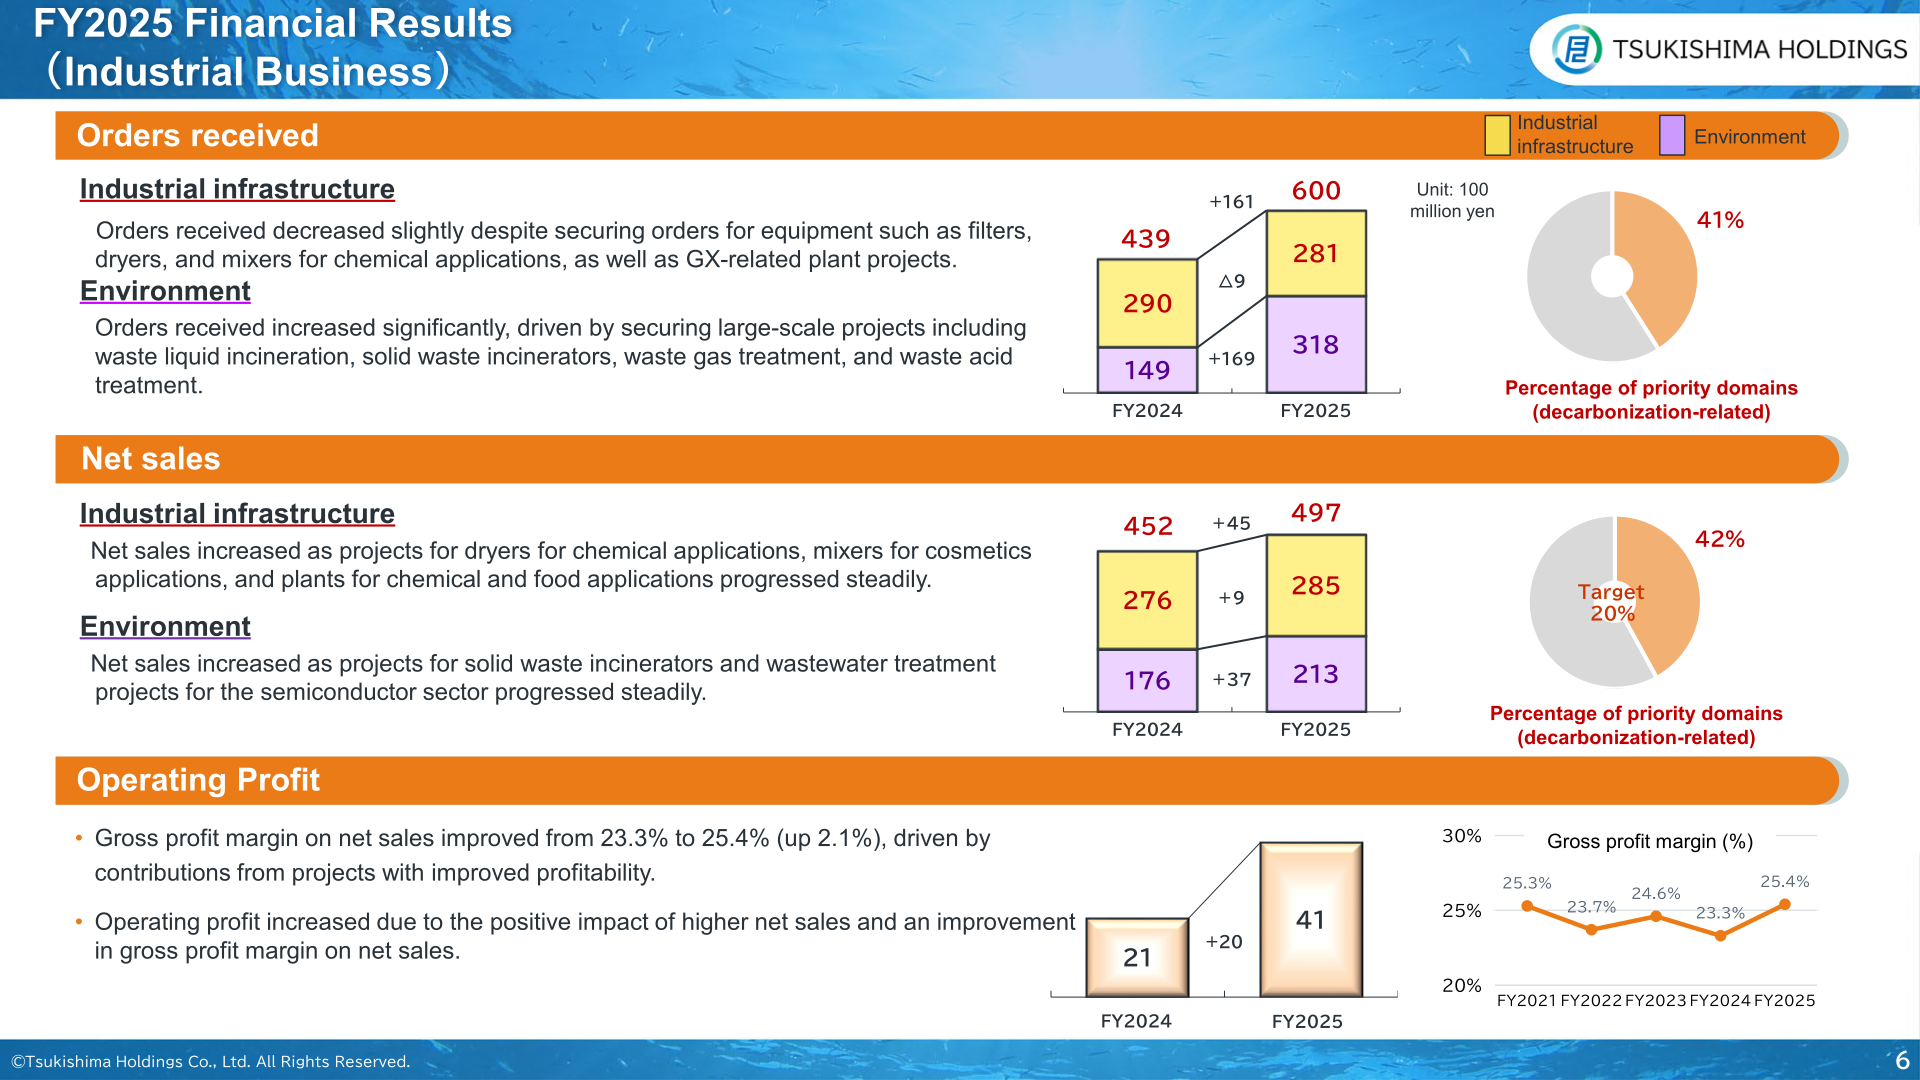
Within the Industrial Business, industrial infrastructure orders received edged down from 290 to 281 (△9) despite orders for filters, dryers and mixers for chemical applications and GX-related plant projects, while environment orders jumped from 149 to 318 (+169) on large-scale projects including waste liquid incineration, solid waste incinerators, waste gas treatment and waste acid treatment. Net sales rose from 276 to 285 (+9) in industrial infrastructure and from 176 to 213 (+37) in environment, the latter driven by solid waste incinerator projects and wastewater treatment projects for the semiconductor sector.
FY2026 Forecast
For FY2026 the company expects orders received, net sales and operating profit to hit record highs. Orders received are expected to increase, supported by large-scale projects in the Water Environmental Business and continued strong performance in the Industrial Business; net sales are expected to increase as projects in the order backlog progress in both businesses; and operating profit is expected to increase mainly due to higher profit in the Water Environmental Business. Profit attributable to owners of parent is expected to decrease due to the absence of gains from the sale of logistics facilities in the previous fiscal year. The company also notes potential impacts from military conflict in the Middle East, including effects on customers’ capital investment decisions in the Industrial Business and increased costs and delivery delays for petroleum-derived products, while stating that a significant impact on overall business performance is not expected.
| Item (Unit: 100 million yen) | FY2025 Actual | FY2026 Forecast | Change | FY2026 Targets (at the time of formulating the Medium-term Management Plan) |
|---|---|---|---|---|
| Orders received | 1,542 | 1,900 | +358 | - |
| Order backlog | 3,235 | 3,615 | +380 | - |
| Net sales | 1,490 | 1,520 | +30 | 1,600 |
| Operating profit | 98 | 110 | +12 | 120 |
| Operating profit margin | 6.6% | 7.2% | +0.6% | 7.5% |
| Profit attributable to owners of parent | 169 | 85 | △84 | 70 |
| EBITDA | 135 | 146 | +11 | 152 |
| ROIC | 6.0% | around 7% | - | 7% or higher |
| ROE | 17.7% | mid 8% range | - | 8% or higher |
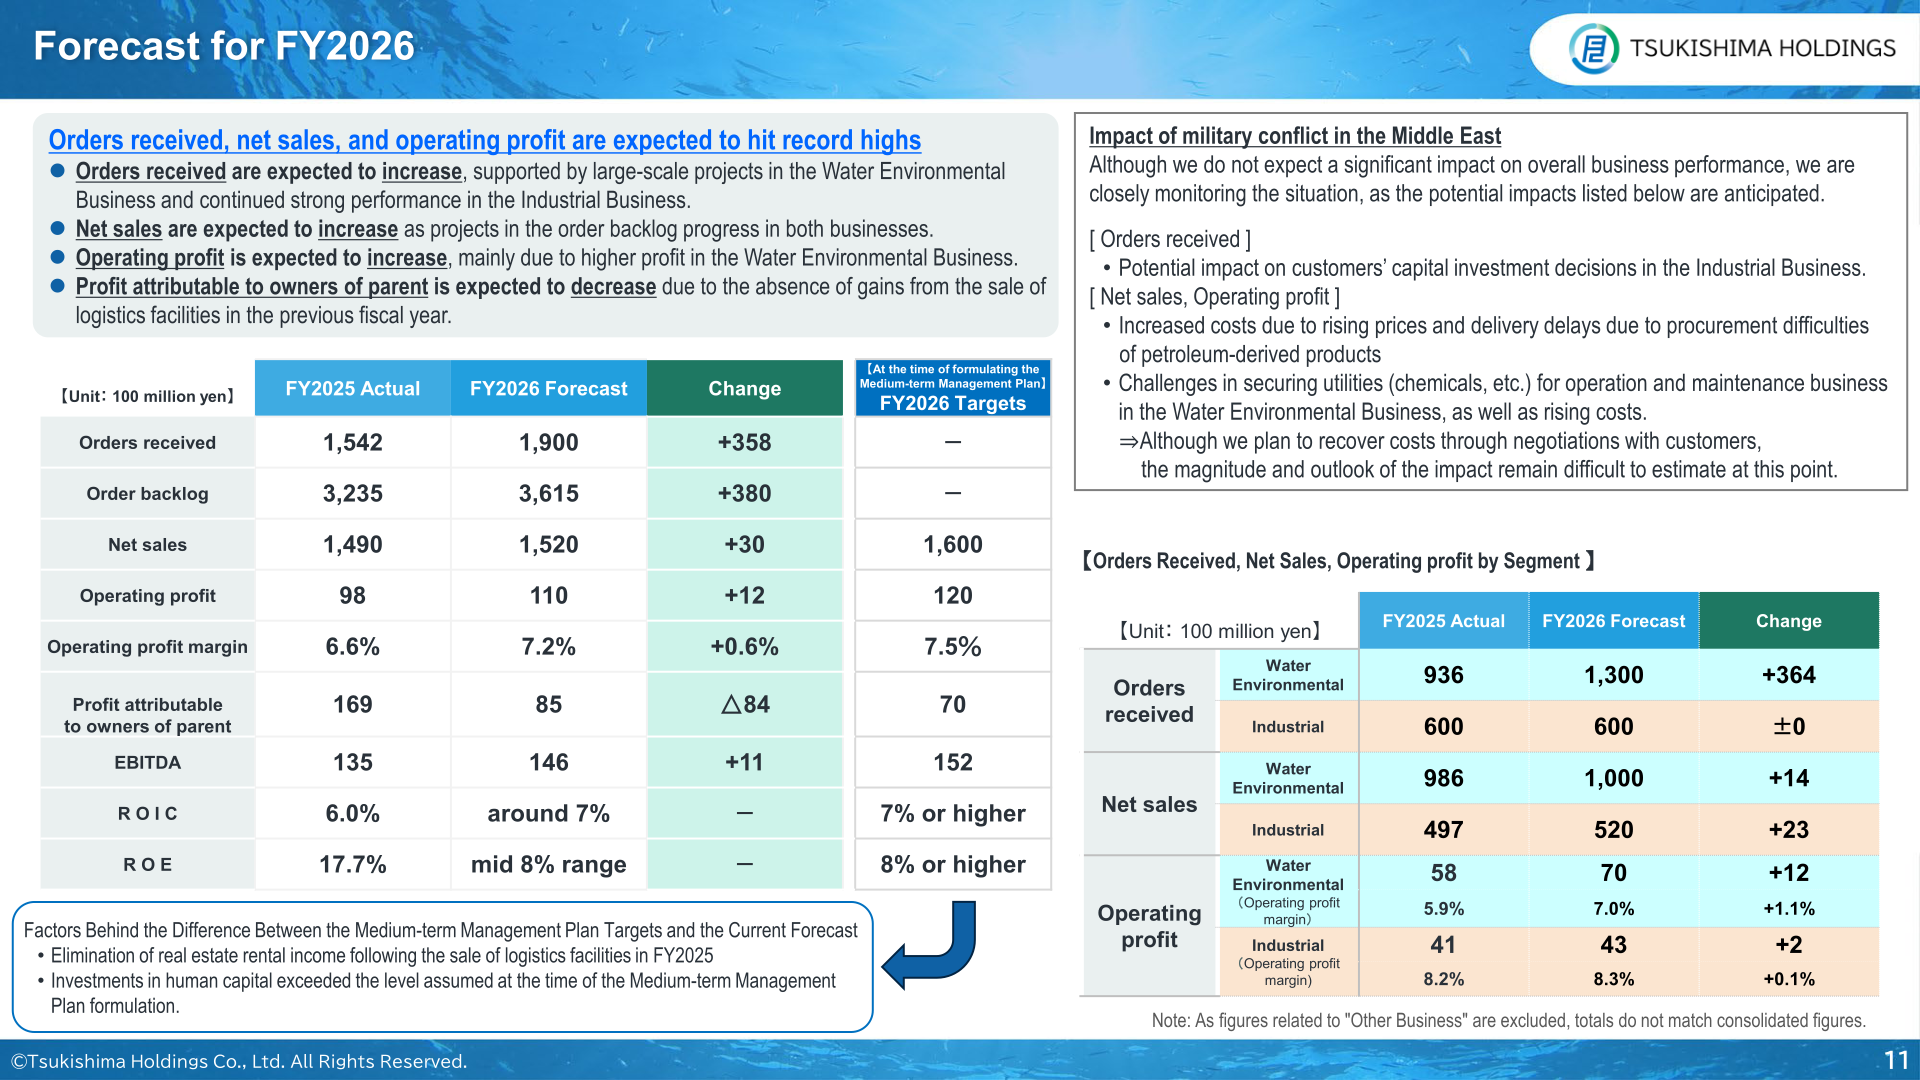
| Metric (Unit: 100 million yen) | Segment | FY2025 Actual | FY2026 Forecast | Change |
|---|---|---|---|---|
| Orders received | Water Environmental | 936 | 1,300 | +364 |
| Orders received | Industrial | 600 | 600 | ±0 |
| Net sales | Water Environmental | 986 | 1,000 | +14 |
| Net sales | Industrial | 497 | 520 | +23 |
| Operating profit | Water Environmental | 58 | 70 | +12 |
| Operating profit margin | Water Environmental | 5.9% | 7.0% | +1.1% |
| Operating profit | Industrial | 41 | 43 | +2 |
| Operating profit margin | Industrial | 8.2% | 8.3% | +0.1% |
The company explains the difference between the Medium-term Management Plan targets and the current forecast by the elimination of real estate rental income following the sale of logistics facilities in FY2025 and by investments in human capital exceeding the level assumed at the time of the plan’s formulation. In the Water Environmental Business, gross profit margin on net sales is expected to improve from 18.8% to 20.4%, mainly due to the resolution of the impact from lower profitability in certain projects in the previous fiscal year, while in the Industrial Business it is expected to decline from 25.4% to 24.9% due to differences in project mix. Order backlog at the beginning of FY2026 remains at a high level of 271.5 billion yen, with the ratio of water infrastructure (EPC) to life cycle business (O&M) at approximately 30:70.
Shareholder Returns
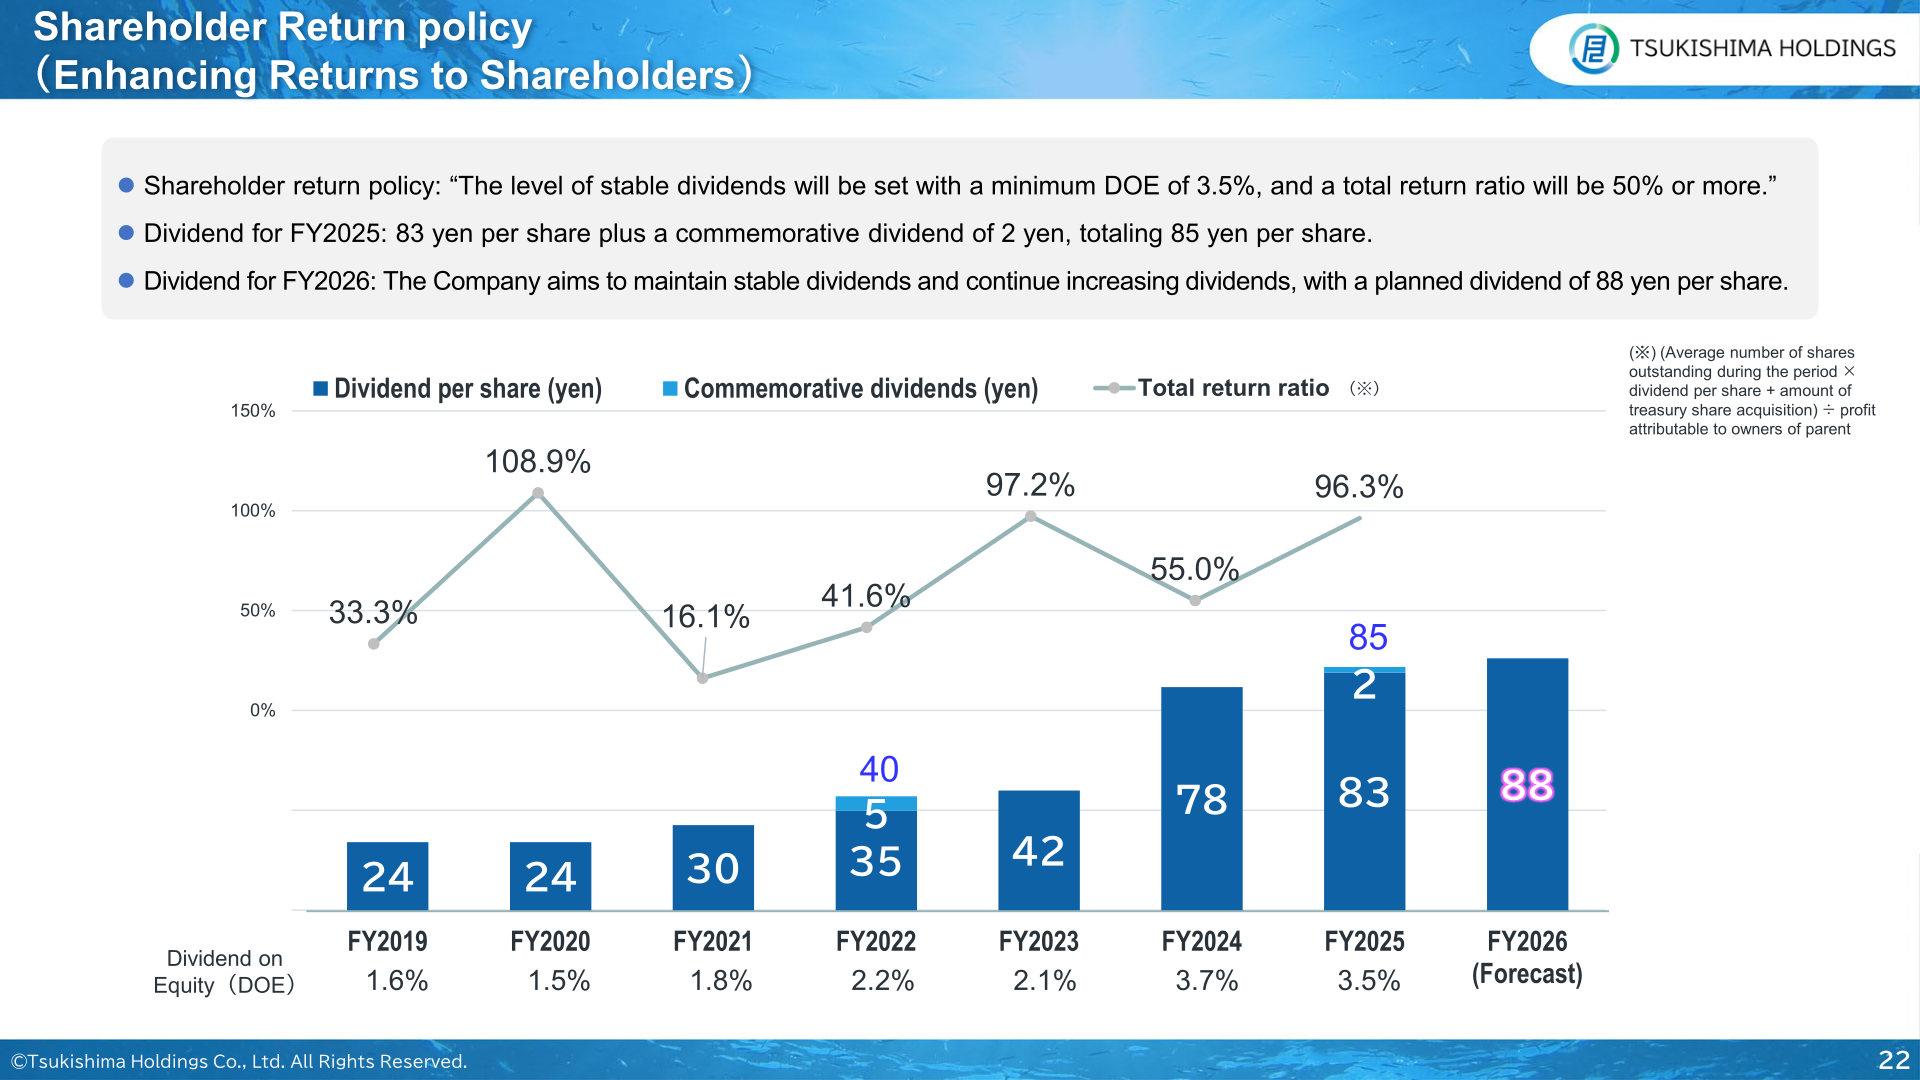
The shareholder return policy states that “the level of stable dividends will be set with a minimum DOE of 3.5%, and a total return ratio will be 50% or more.” The dividend for FY2025 is 83 yen per share plus a commemorative dividend of 2 yen, totaling 85 yen per share. For FY2026, the company aims to maintain stable dividends and continue increasing dividends, with a planned dividend of 88 yen per share. During FY2025 the company repurchased approximately 4.3 million shares of treasury stock worth 12.8 billion yen and cancelled about 4.0 million shares; total acquisitions over three years reached 13.9 billion yen, equivalent to 12.8% of total shares outstanding as of the end of FY2025. Total dividends paid over three years, including the FY2025 year-end dividend, amounted to 8.6 billion yen.
| Item | FY2023 | FY2024 | FY2025 | FY2026 (Forecast) |
|---|---|---|---|---|
| Dividend per share (yen) | 42 | 78 | 83 | 88 |
| Commemorative dividends (yen) | – | – | 2 | – |
| Total dividend per share (yen) | 42 | 78 | 85 | 88 |
| Dividend on Equity (DOE) | 2.1% | 3.7% | 3.5% | – |
| Total return ratio | 97.2% | 55.0% | 96.3% | – |
Medium-Term Management Plan and Topics
The Medium-Term Management Plan is built on three basic policies: promoting sustainability management, enhancing business domains and strengthening the group’s earning capabilities, and improving capital efficiency and enhancing returns to shareholders. Reported progress includes achieving targets for three consecutive fiscal periods of over 20% of revenue from decarbonization-related businesses and over 30% allocation of R&D expenditures to these areas, a transition to a governance structure in which outside directors constitute half of the Board of Directors, the launch of OPTINOA as a next-generation integrated digital solution, the absorption of Higashi-Nihon Engineering, expanded orders for semiconductor wastewater treatment projects, the divestment of logistics facilities and cross-shareholdings, and the introduction of a Dividend on Equity (DOE) policy.
| Segment (Unit: 100 million yen) | Item | FY2023 results | FY2024 results | FY2025 results | FY2026 targets | FY2023 – FY2026 |
|---|---|---|---|---|---|---|
| Water Environmental Business | Net sales | 810 | 927 | 986 | 1,000 | CAGR: 7.3 % |
| Water Environmental Business | Operating profit | 51 | 61 | 58 | 70 | CAGR: 11.3 % |
| Water Environmental Business | Operating profit margin | 6.3% | 6.6% | 5.9% | 7.0% | +0.7 pt |
| Industrial Business | Net sales | 419 | 452 | 497 | 520 | CAGR: 7.5 % |
| Industrial Business | Operating profit | 14 | 21 | 41 | 43 | CAGR: 46.2 % |
| Industrial Business | Operating profit margin | 3.3% | 4.7% | 8.2% | 8.3% | +5.0 pt |
| Other Business | Net sales | 13 | 13 | 6 | 0 | – |
| Other Business | Operating profit | 3 | 7 | △1 | △3 | – |
On capital allocation, the company sold its logistics facility at a transfer price of 21.7 billion yen with a gain on sale of 12.0 billion yen, and sold cross-shareholdings worth 9.3 billion yen over three years against a four-year target of more than 12 billion yen. Strategic investment in R&D, human capital and DX/IT totalled 14.3 billion yen over three years, and capital investment totalled 5.7 billion yen. Financial discipline targets are an equity-to-asset ratio of approximately 40 to 50%, a D/E ratio of 0.8 or lower, and cash on hand securing twice monthly turnover. PBR improved from 0.60 in FY2021 to 1.08 in FY2025, with a reference figure of 1.31 as of May 8, 2026, and the company notes that ROE for FY2025 increased due to extraordinary income.
This article is an analysis based on publicly available information and is not a recommendation to buy or sell any specific securities. Investment decisions are your own responsibility.
![[Obayashi] Investors’ Guide 2026 — The Complete 24-Article Breakdown](https://japan-equity.com/wp-content/uploads/2026/07/hub_cover-1024x1024.png)
![[Obayashi] IR & SR Policy — Feeding Dialogue Back into Management](https://japan-equity.com/wp-content/uploads/2026/07/p32_sq-1024x1024.jpg)
![[Obayashi] Domestic Civil Engineering — Resilience Spending Supports 9.6% Margin](https://japan-equity.com/wp-content/uploads/2026/07/p11_sq-1024x1024.jpg)
![[Obayashi] Overseas Construction — Orders Reach ¥1.2tn](https://japan-equity.com/wp-content/uploads/2026/07/p15_sq-1024x1024.jpg)
![[Obayashi] Share Price & External Ratings — vs TOPIX, ESG Index Inclusion](https://japan-equity.com/wp-content/uploads/2026/07/p40_sq-1024x1024.jpg)
![[Construction] ¥75.5tn Investment, Shrinking Workforce — Big-5 Market Share](https://japan-equity.com/wp-content/uploads/2026/07/p12_sq-1024x1024.jpg)



![[Obayashi] Capital Policy & Shareholder Returns — ROE 10%+, DOE ~5%, ¥100bn Buyback](https://japan-equity.com/wp-content/uploads/2026/07/p27_sq-1024x1024.jpg)
![[Obayashi] Reducing Cross-Shareholdings — ¥285.2bn Sold in Five Years](https://japan-equity.com/wp-content/uploads/2026/07/p29_sq-1024x1024.jpg)
![[Obayashi] ¥750bn Investment Plan — ¥300bn to Development, ¥190bn to Tech/DX](https://japan-equity.com/wp-content/uploads/2026/07/p30_sq-1024x1024.jpg)
![[Obayashi] MTP2022 KPIs — Operating Profit ~2x Target, ROE 14.4%](https://japan-equity.com/wp-content/uploads/2026/07/p25_sq-1024x1024.jpg)
![[Obayashi] Cash Allocation — ¥420bn Investment CF Over Five Years](https://japan-equity.com/wp-content/uploads/2026/07/p26_sq-1024x1024.jpg)
![[Obayashi] Green Energy — 44 Plants, 344MW, and the Green Hydrogen Challenge](https://japan-equity.com/wp-content/uploads/2026/07/p21_sq-1024x1024.jpg)
![[Obayashi] Tackling the Labor Shortage — Robotics Construction®](https://japan-equity.com/wp-content/uploads/2026/07/p14_sq-1024x1024.jpg)
