
This article is based on publicly available IR materials and is not a recommendation to buy or sell any specific securities.
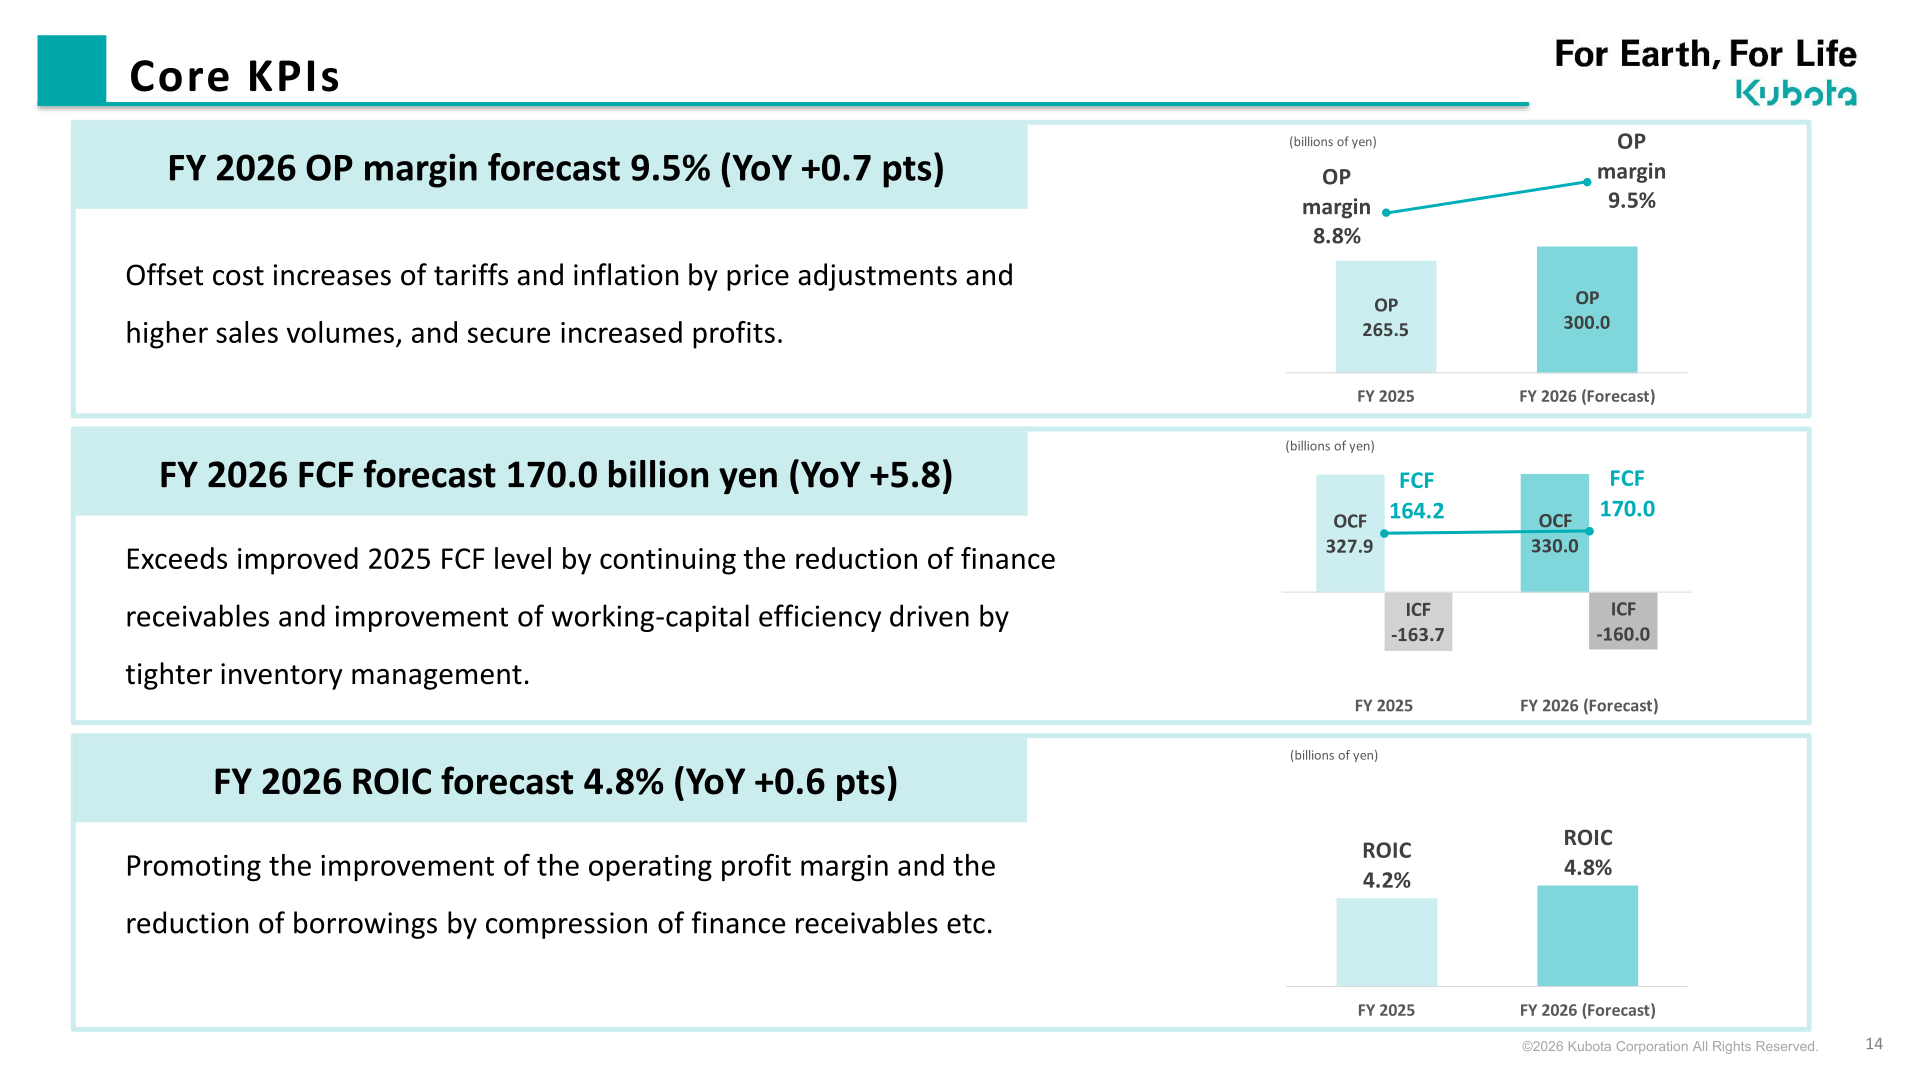
Kubota Corporation (6326) reported FY2025 (full year ended December 31, 2025) revenue of 3,018.9 billion yen, up 0.1% year on year, while operating profit declined 15.9% to 265.5 billion yen and profit attributable to owners of the parent fell 19.0% to 186.7 billion yen, reflecting the impact of U.S. tariffs and rising costs. Free cash flow (FCF) rose sharply to 164.2 billion yen (+91.0 billion yen year on year), driven by a review of the North American retail finance program that curbed the increase in finance receivables. For FY2026, Kubota forecasts revenue of 3,150.0 billion yen and operating profit of 300.0 billion yen, supported by expanded sales volume, continued price pass-through of tariff and inflation costs, and an FCF target of 170.0 billion yen.
Consolidated Results (Full-Year Actual)
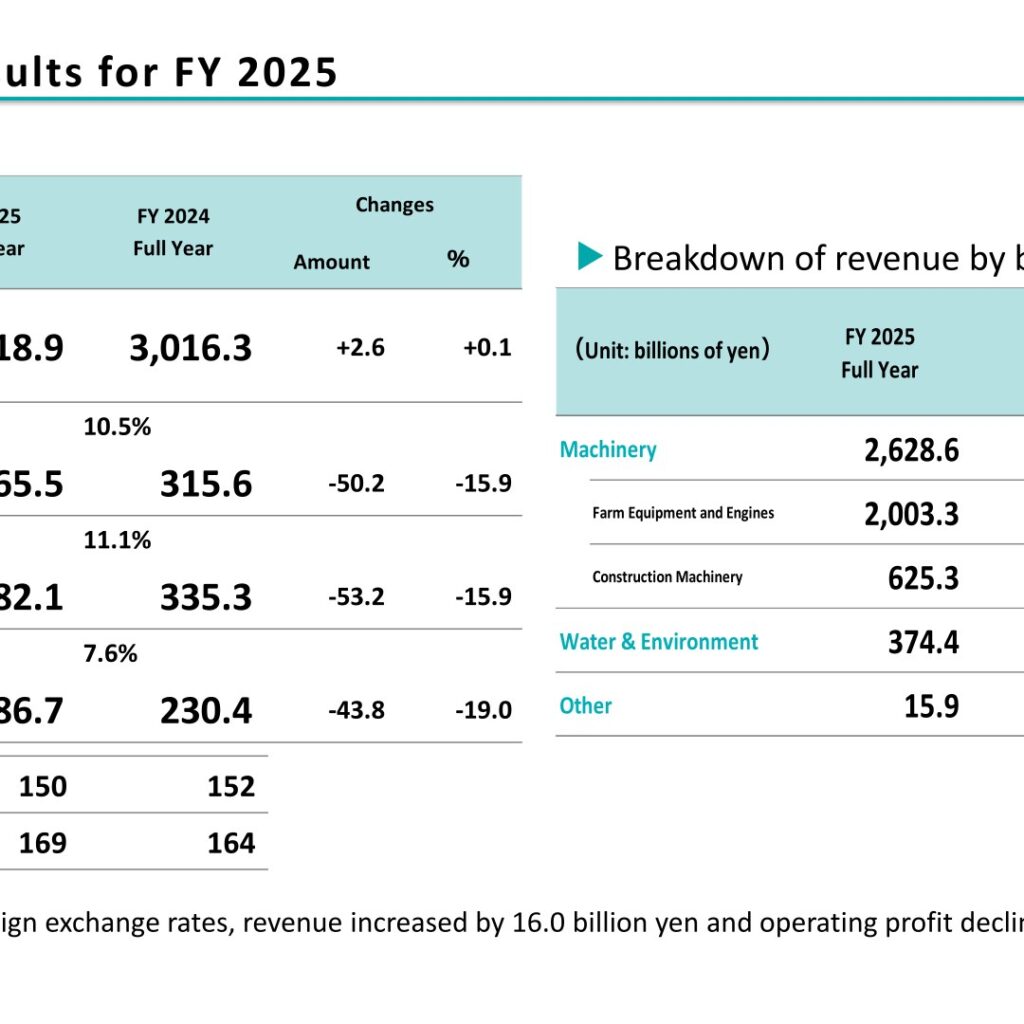
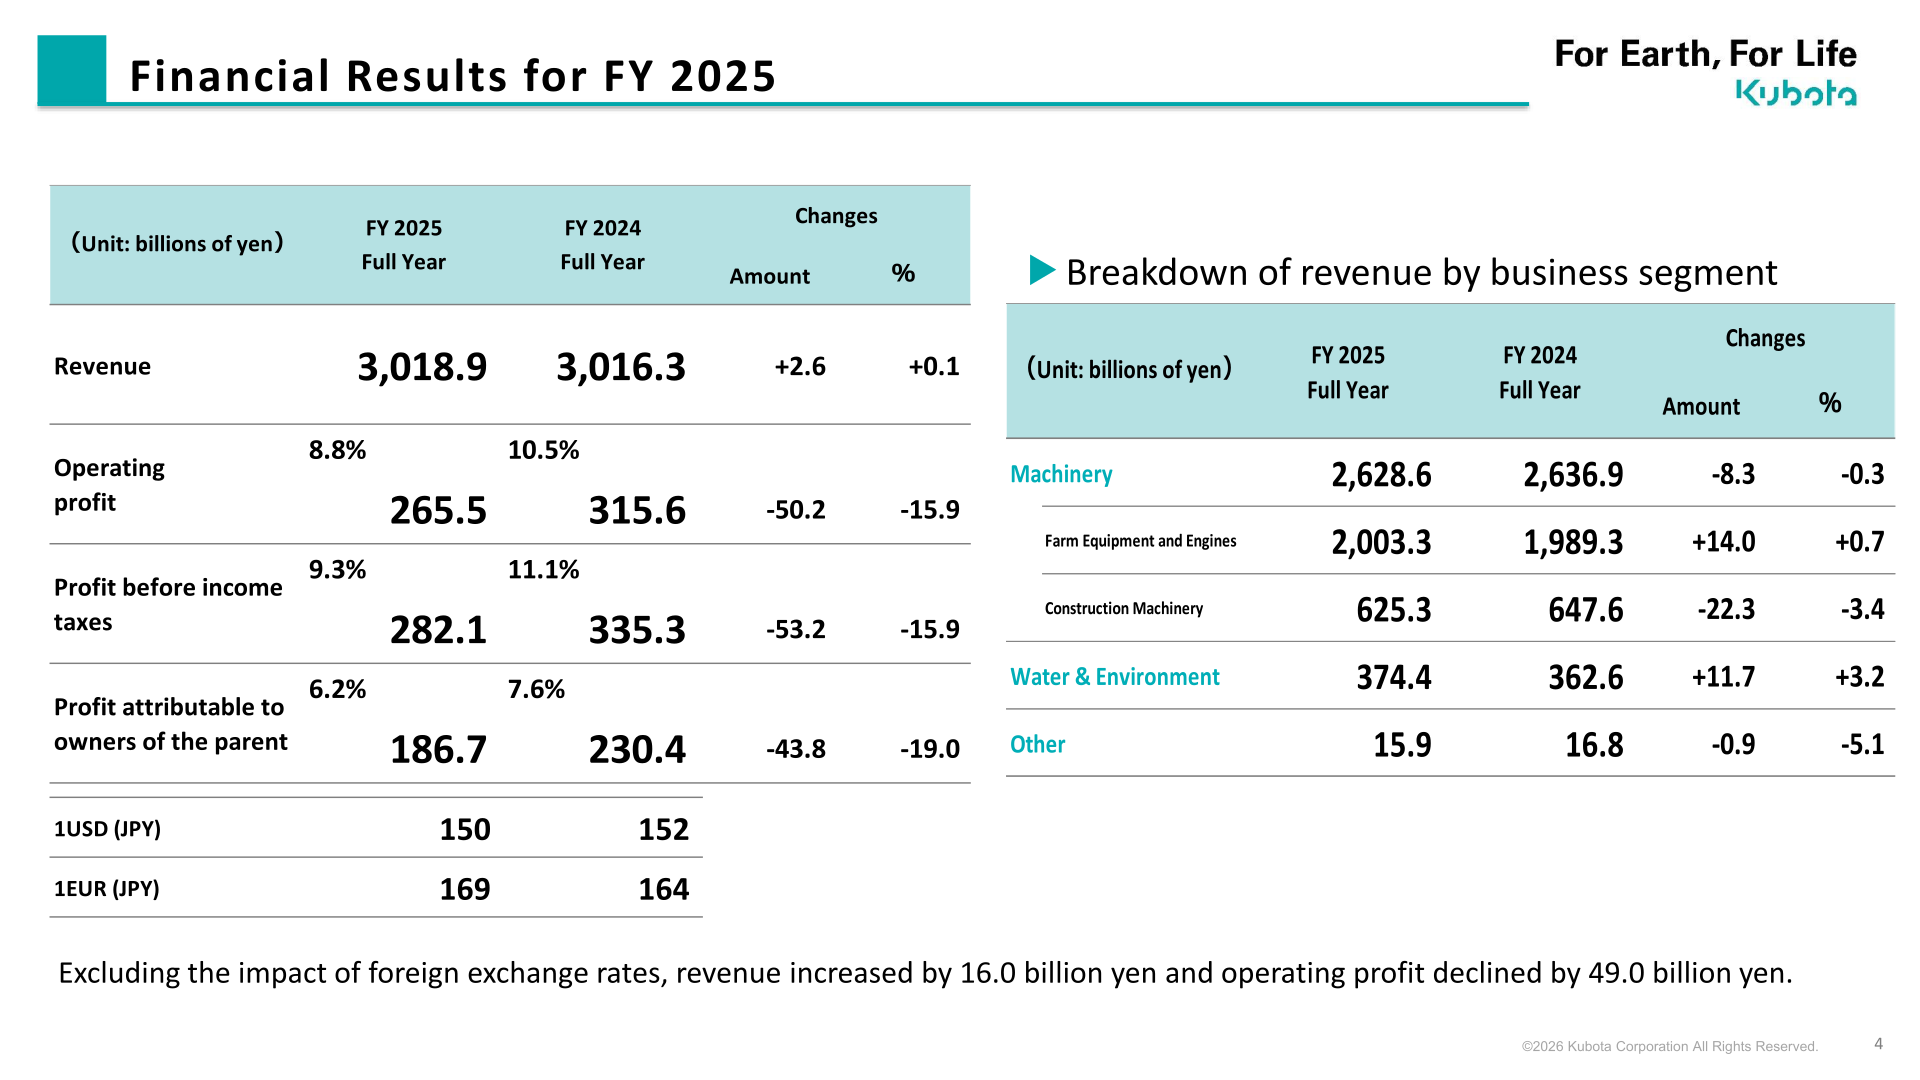
For FY2025, revenue increased 2.6 billion yen (+0.1%) year on year to 3,018.9 billion yen. Operating profit fell 50.2 billion yen (-15.9%) to 265.5 billion yen, with operating profit margin at 8.8% versus 10.5% in FY2024. Profit before income taxes was 282.1 billion yen (-15.9%), and profit attributable to owners of the parent was 186.7 billion yen (-19.0%). Exchange rate assumptions were 1 USD = 150 yen and 1 EUR = 169 yen in FY2025, compared with 1 USD = 152 yen and 1 EUR = 164 yen in FY2024. Excluding the impact of foreign exchange rates, revenue increased by 16.0 billion yen and operating profit declined by 49.0 billion yen. Compared with the interim (2Q) forecast of 220.0 billion yen, full-year FY2025 operating profit increased by 45.5 billion yen, as the impact of additional tariffs was offset through internal efforts, with yen depreciation and higher sales volume contributing further profit growth.
| Item | FY2025 (Actual) | FY2024 (Actual) | Change |
|---|---|---|---|
| Revenue | 3,018.9 | 3,016.3 | +2.6 (+0.1%) |
| Operating profit | 265.5 | 315.6 | -50.2 (-15.9%) |
| Operating profit margin | 8.8% | 10.5% | – |
| Profit before income taxes | 282.1 | 335.3 | -53.2 (-15.9%) |
| Profit attributable to owners of the parent | 186.7 | 230.4 | -43.8 (-19.0%) |
Segment Results
By business segment, Farm Equipment and Engines revenue increased 14.0 billion yen (+0.7%) to 2,003.3 billion yen, and Water & Environment revenue increased 11.7 billion yen (+3.2%) to 374.4 billion yen, while Construction Machinery revenue decreased 22.3 billion yen (-3.4%) to 625.3 billion yen. By region, Japan revenue increased 43.0 billion yen to 354.8 billion yen, supported by an agricultural machinery market that grew on higher farmers’ incomes from rising rice prices, while North America revenue decreased 57.7 billion yen to 1,195.9 billion yen amid a soft tractor market. Europe revenue increased 15.8 billion yen to 345.8 billion yen, and Asia and Others revenue decreased 9.3 billion yen to 732.1 billion yen.
| Segment | FY2025 (Actual) | FY2024 (Actual) | Change |
|---|---|---|---|
| Machinery | 2,628.6 | 2,636.9 | -8.3 (-0.3%) |
| Farm Equipment and Engines | 2,003.3 | 1,989.3 | +14.0 (+0.7%) |
| Construction Machinery | 625.3 | 647.6 | -22.3 (-3.4%) |
| Water & Environment | 374.4 | 362.6 | +11.7 (+3.2%) |
| Other | 15.9 | 16.8 | -0.9 (-5.1%) |
Cash Flow and Financial Position
FCF for FY2025 increased significantly to 164.2 billion yen, up 91.0 billion yen year on year, mainly due to a review of the North American retail finance program that curbed the increase in finance receivables and reduced the working-capital burden; capital expenditures also decreased as major investments tapered off. Operating cash flow (OCF) was 327.9 billion yen, versus 282.1 billion yen in FY2024, while investing cash flow (ICF) was -163.7 billion yen, versus -208.9 billion yen in FY2024. Reflecting the FCF improvement, bonds and borrowings decreased to 2,242.1 billion yen from 2,278.1 billion yen. Total assets were 6,204.9 billion yen (FY2024: 6,018.7 billion yen) and total equity was 2,873.0 billion yen (FY2024: 2,739.8 billion yen) as of December 31, 2025. The delinquency rate of retail finance receivables (over 90 days) was 1.1%, up from 0.8% a year earlier, as the balance of receivables rose to 2,257.6 billion yen from 2,224.3 billion yen.
FY2026 Forecast
For FY2026, Kubota forecasts revenue of 3,150.0 billion yen (+131.1 billion yen, +4.3%) and operating profit of 300.0 billion yen (+34.5 billion yen, +13.0%), citing expanded sales volume on improving market conditions in North America, Europe, Thailand and India, together with new model introductions. The company plans to continue controlling fixed-cost increases, manage operations without excessive reliance on incentives, and steadily pass through tariff and inflation costs to prices. The estimated impact of U.S. tariffs on operating profit is 65.0 billion yen in FY2025 and 90.0 billion yen in FY2026. Kubota targets FCF of 170.0 billion yen in FY2026 (+5.8 billion yen year on year), to be secured through reductions in North American retail finance receivables and continued lower inventory levels. On a management-accounting basis, Machinery segment operating profit of 226.1 billion yen in FY2025 (OP margin 8.6%) is forecast to rise to 294.0 billion yen (10.7%) in FY2026, Water & Environment operating profit of 27.6 billion yen (7.4%) is forecast to rise to 29.0 billion yen (7.5%), and Other segment operating profit of 0.8 billion yen (5.2%) is forecast to rise to 1.0 billion yen (6.3%); the Adjustment line was 11.0 billion yen in FY2025 and is forecast at -24.0 billion yen in FY2026. Kubota notes that, due to an organizational reform effective January 1, 2026, certain expenses previously included in “Adjustment” have been reallocated to each business segment, and FY2025 segment profit figures have been reclassified accordingly.
| Item | FY2026 (Forecast) | FY2025 (Actual) | Change |
|---|---|---|---|
| Revenue | 3,150.0 | 3,018.9 | +131.1 (+4.3%) |
| Operating profit | 300.0 | 265.5 | +34.5 (+13.0%) |
| Operating profit margin | 9.5% | 8.8% | +0.7pt |
| Profit before income taxes | 317.0 | 282.1 | +34.9 (+12.4%) |
| Profit attributable to owners of the parent | 210.0 | 186.7 | +23.3 (+12.5%) |
| FCF (billions of yen) | 170.0 | 164.2 | +5.8 |
| ROIC | 4.8% | 4.2% | +0.6pt |
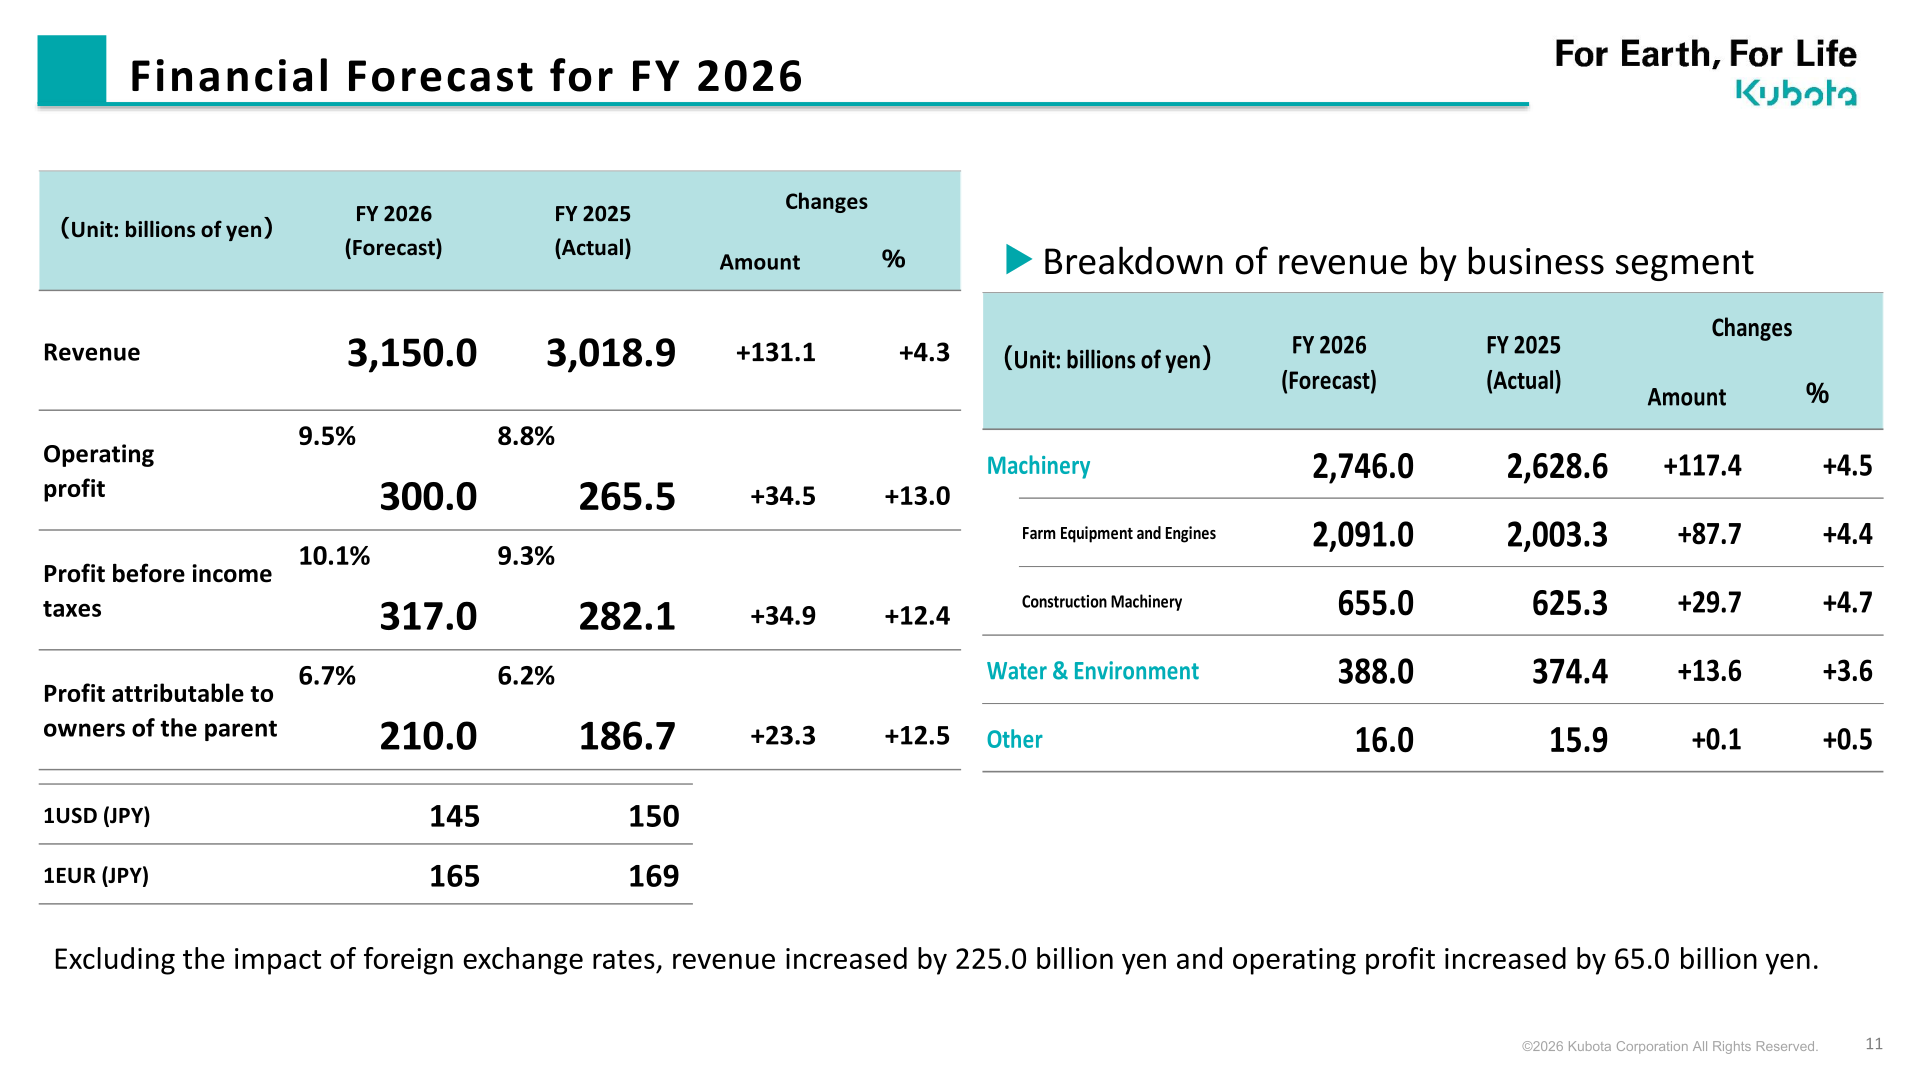
By business segment, Machinery revenue is forecast to increase 117.4 billion yen (+4.5%) to 2,746.0 billion yen, comprising Farm Equipment and Engines of 2,091.0 billion yen (+4.4%) and Construction Machinery of 655.0 billion yen (+4.7%). Water & Environment revenue is forecast to increase 13.6 billion yen (+3.6%) to 388.0 billion yen.
| Segment | FY2026 (Forecast) | FY2025 (Actual) | Change |
|---|---|---|---|
| Machinery | 2,746.0 | 2,628.6 | +117.4 (+4.5%) |
| Farm Equipment and Engines | 2,091.0 | 2,003.3 | +87.7 (+4.4%) |
| Construction Machinery | 655.0 | 625.3 | +29.7 (+4.7%) |
| Water & Environment | 388.0 | 374.4 | +13.6 (+3.6%) |
| Other | 16.0 | 15.9 | +0.1 (+0.5%) |
Shareholder Returns
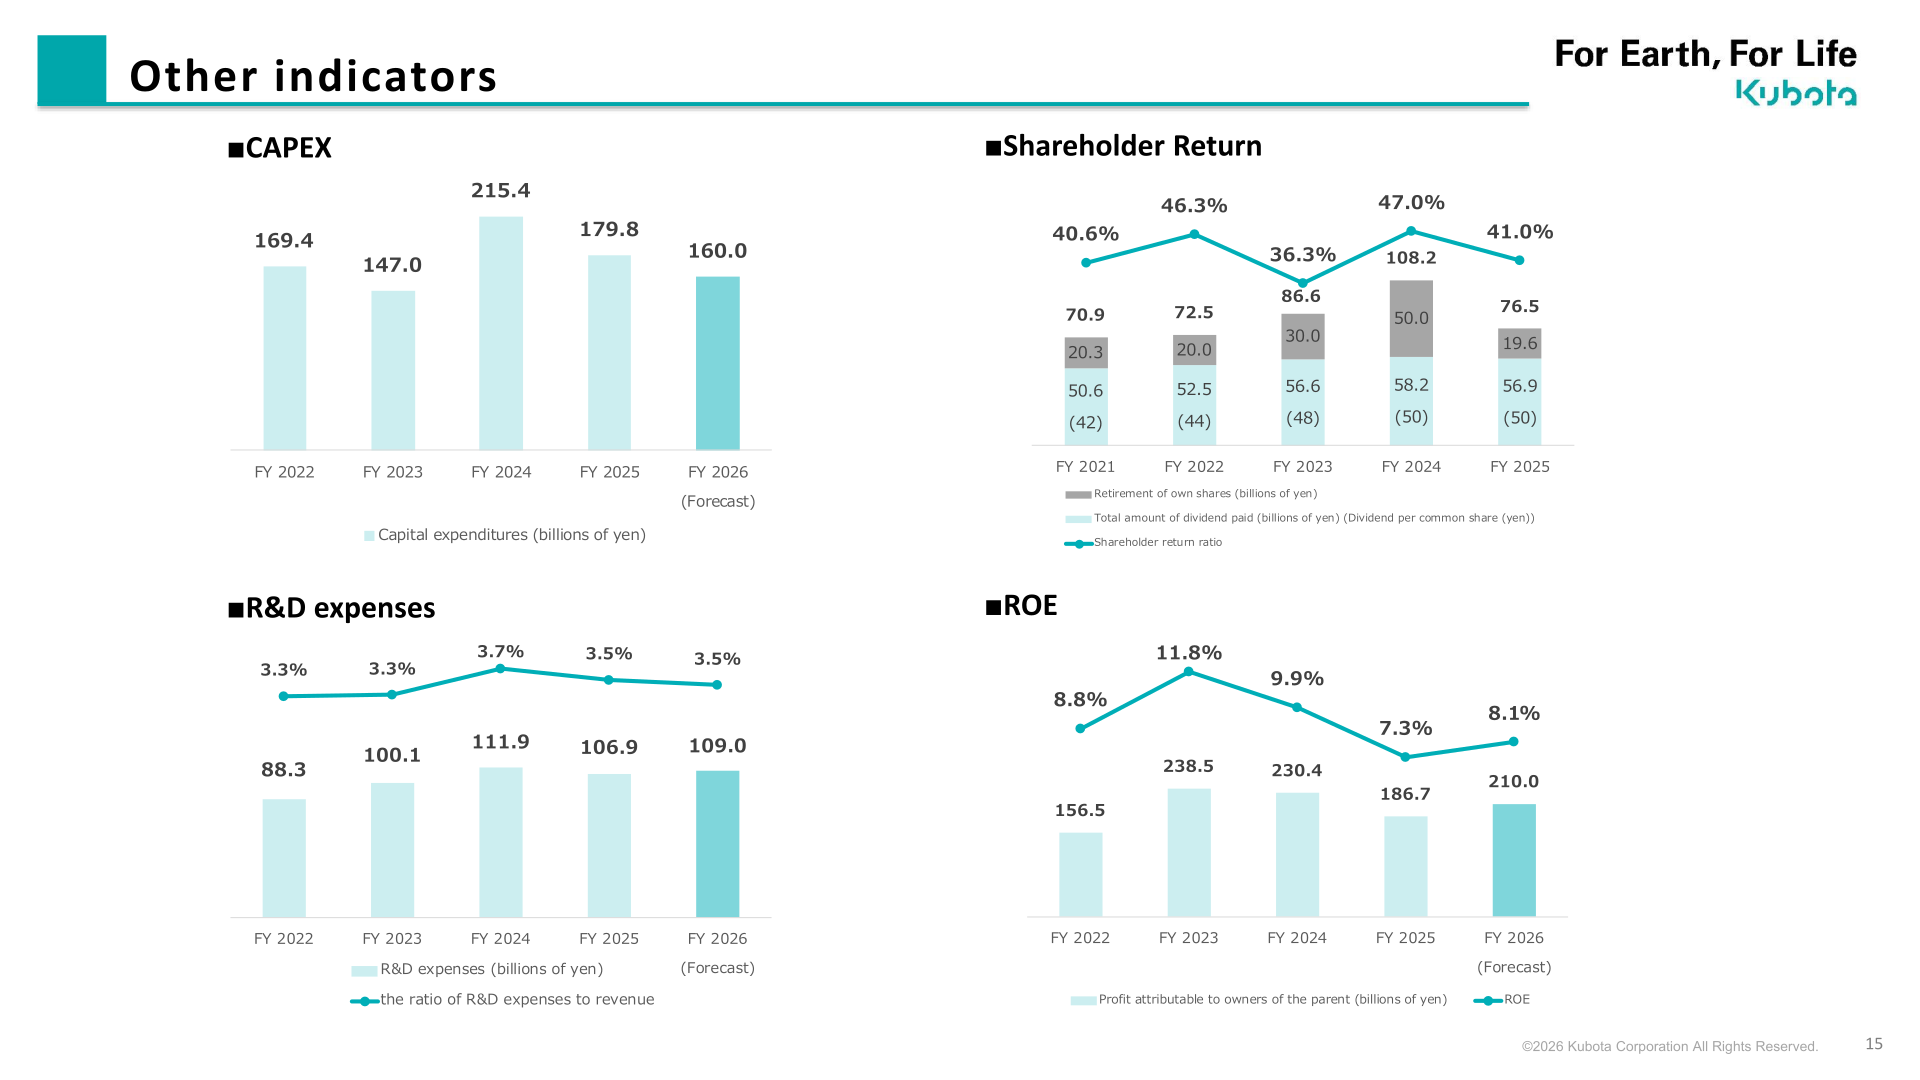
Kubota’s total dividend paid was 56.9 billion yen in FY2025 (dividend per common share: 50 yen), compared with 58.2 billion yen in FY2024 (also 50 yen per share). The retirement of own shares (share buybacks) totaled 19.6 billion yen in FY2025, down from 50.0 billion yen in FY2024, and the shareholder return ratio was 41.0%, down from 47.0% in FY2024.
| Item | FY2025 | FY2024 |
|---|---|---|
| Total dividend paid (billions of yen) | 56.9 | 58.2 |
| Dividend per common share (yen) | 50 | 50 |
| Retirement of own shares (billions of yen) | 19.6 | 50.0 |
| Shareholder return ratio | 41.0% | 47.0% |
Medium-Term Plan / Topics
Kubota states that, based on the policy of its new mid-term business plan, operations will continue to be managed with a strong focus on capital efficiency, including continued reductions in North American retail finance receivables and lower inventory levels. The company also highlighted three priorities: realizing transformation with the new management team, achieving sustainable growth while maximizing capital efficiency, and promoting financial reforms that continue to increase corporate value.
This article is an analysis based on publicly available information and is not a recommendation to buy or sell any specific securities. Investment decisions are your own responsibility.
![[Obayashi] Investors’ Guide 2026 — The Complete 24-Article Breakdown](https://japan-equity.com/wp-content/uploads/2026/07/hub_cover-1024x1024.png)
![[Obayashi] IR & SR Policy — Feeding Dialogue Back into Management](https://japan-equity.com/wp-content/uploads/2026/07/p32_sq-1024x1024.jpg)
![[Obayashi] Real Estate Development — 18.7% Margin, ¥287.7bn Unrealized Gains](https://japan-equity.com/wp-content/uploads/2026/07/p20_sq-1024x1024.jpg)
![[Obayashi] Domestic Civil Engineering — Resilience Spending Supports 9.6% Margin](https://japan-equity.com/wp-content/uploads/2026/07/p11_sq-1024x1024.jpg)
![[Obayashi] Share Price & External Ratings — vs TOPIX, ESG Index Inclusion](https://japan-equity.com/wp-content/uploads/2026/07/p40_sq-1024x1024.jpg)
![[Construction] ¥75.5tn Investment, Shrinking Workforce — Big-5 Market Share](https://japan-equity.com/wp-content/uploads/2026/07/p12_sq-1024x1024.jpg)



![[Obayashi] Capital Policy & Shareholder Returns — ROE 10%+, DOE ~5%, ¥100bn Buyback](https://japan-equity.com/wp-content/uploads/2026/07/p27_sq-1024x1024.jpg)
![[Obayashi] Reducing Cross-Shareholdings — ¥285.2bn Sold in Five Years](https://japan-equity.com/wp-content/uploads/2026/07/p29_sq-1024x1024.jpg)
![[Obayashi] ¥750bn Investment Plan — ¥300bn to Development, ¥190bn to Tech/DX](https://japan-equity.com/wp-content/uploads/2026/07/p30_sq-1024x1024.jpg)
![[Obayashi] MTP2022 KPIs — Operating Profit ~2x Target, ROE 14.4%](https://japan-equity.com/wp-content/uploads/2026/07/p25_sq-1024x1024.jpg)
![[Obayashi] Cash Allocation — ¥420bn Investment CF Over Five Years](https://japan-equity.com/wp-content/uploads/2026/07/p26_sq-1024x1024.jpg)
![[Obayashi] Green Energy — 44 Plants, 344MW, and the Green Hydrogen Challenge](https://japan-equity.com/wp-content/uploads/2026/07/p21_sq-1024x1024.jpg)
![[Obayashi] Tackling the Labor Shortage — Robotics Construction®](https://japan-equity.com/wp-content/uploads/2026/07/p14_sq-1024x1024.jpg)
