
This article is based on publicly available IR materials and is not a recommendation to buy or sell any specific securities.
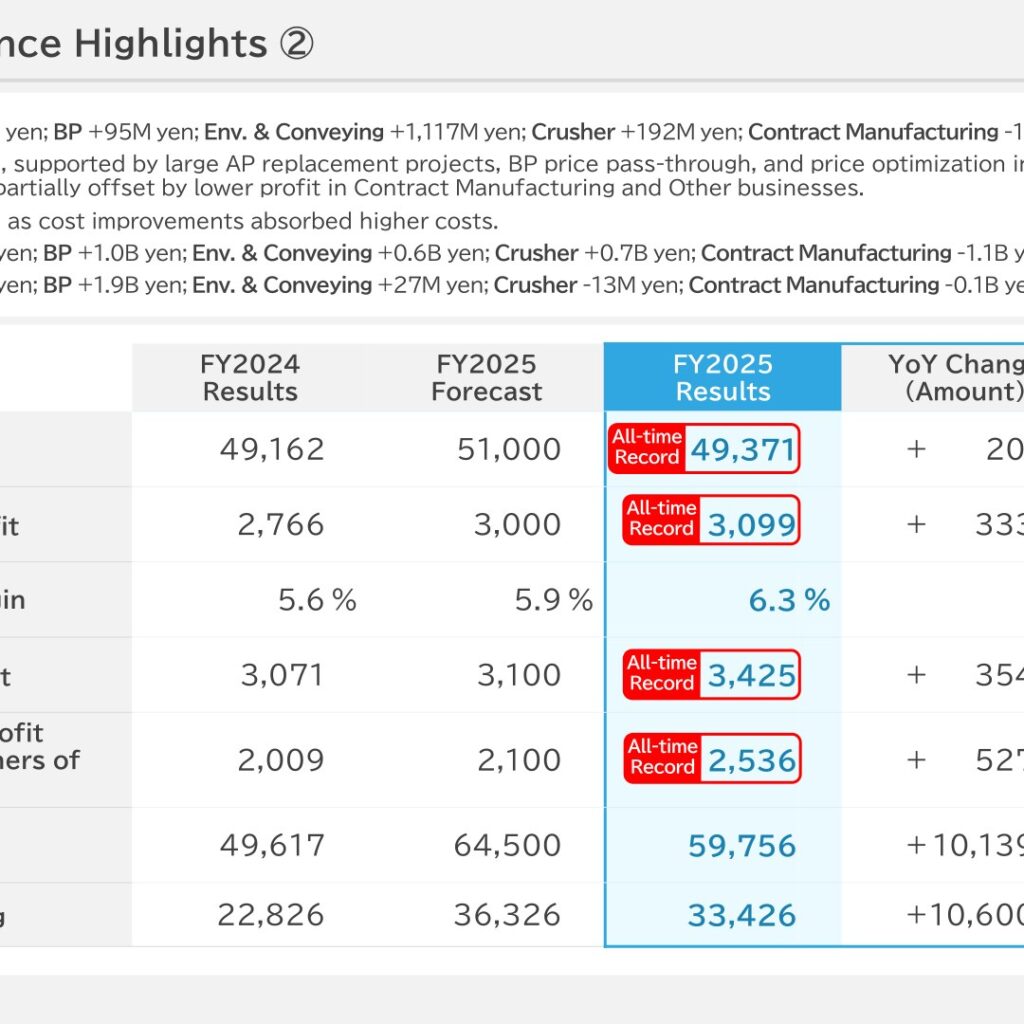
Nikko Co., Ltd., a manufacturer of asphalt mixing plants and concrete batching plants, reported FY2025 net sales of 49,371 million yen (+0.4% YoY) and operating profit of 3,099 million yen (+12.0% YoY), both of which the Company marks as all-time records. Ordinary profit rose 11.5% to 3,425 million yen and net profit attributable to owners of parent rose 26.2% to 2,536 million yen. Order intake reached 59,756 million yen (+20.4% YoY) and the order backlog at the end of the period was 33,426 million yen (+46.4% YoY). Note: in this presentation the completed fiscal year is labelled FY2025; the Company Overview page states figures as of March 31, 2026, while the cover page of the deck carries the notation “Fiscal Year ended March 31, 2025”.
Consolidated Results (Full-Year Actual)
Net sales were broadly flat against the previous fiscal year, while all profit lines increased. Results came in below the Company’s own FY2025 forecast for net sales (51,000 million yen) but above it for operating profit, ordinary profit and net profit. Operating margin improved 0.7pp to 6.3%.
| (million yen) | FY2024 Results | FY2025 Forecast | FY2025 Results | YoY Change (Amount) | YoY Change (Rate) |
|---|---|---|---|---|---|
| Net Sales | 49,162 | 51,000 | 49,371 | + 209 | + 0.4 % |
| Operating Profit | 2,766 | 3,000 | 3,099 | + 333 | + 12.0 % |
| Operating Margin | 5.6 % | 5.9 % | 6.3 % | – | + 0.7 pp |
| Ordinary Profit | 3,071 | 3,100 | 3,425 | + 354 | + 11.5 % |
| Net Profit Attributable to Owners of Parent | 2,009 | 2,100 | 2,536 | + 527 | + 26.2 % |
| Order Intake | 49,617 | 64,500 | 59,756 | + 10,139 | + 20.4 % |
| Order Backlog | 22,826 | 36,326 | 33,426 | + 10,600 | + 46.4 % |
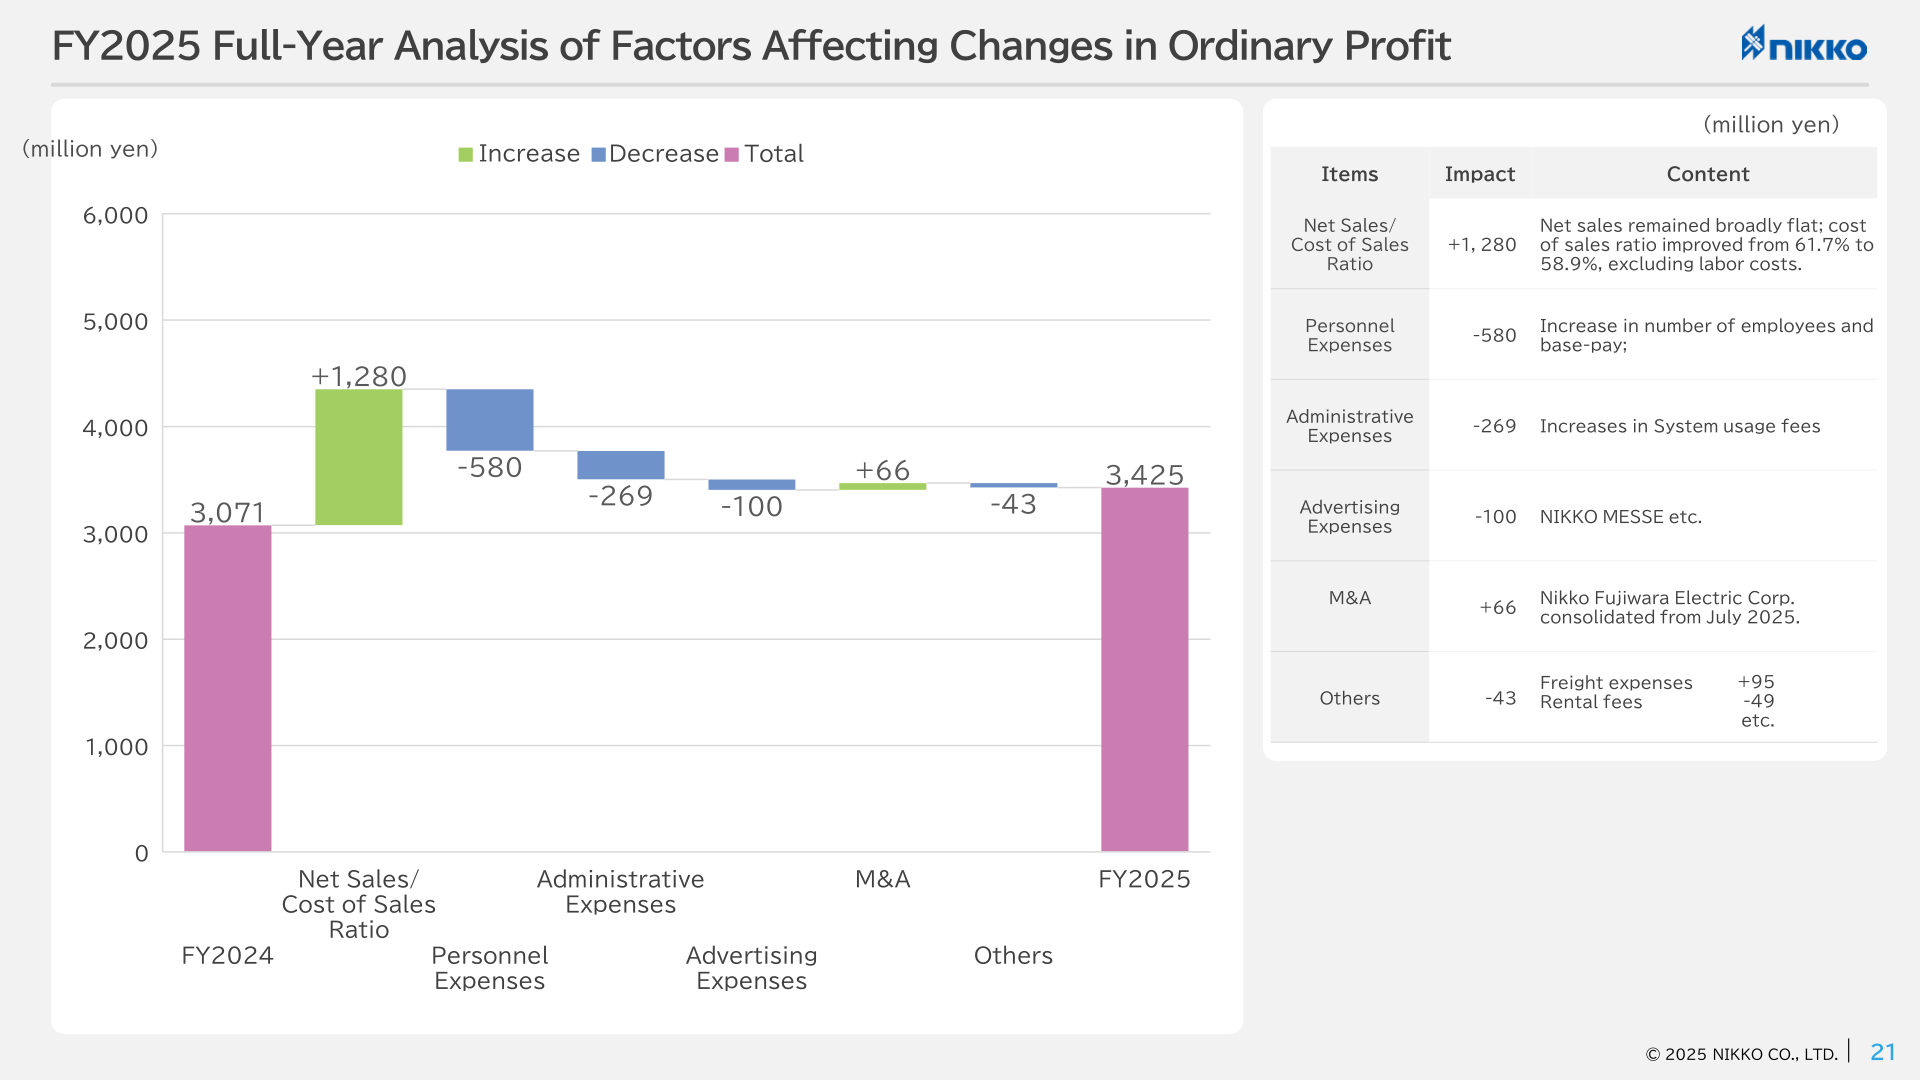
In the Company’s breakdown of the year-on-year change in ordinary profit, net sales and the cost of sales ratio contributed +1,280 million yen, with the cost of sales ratio improving from 61.7% to 58.9% excluding labor costs. Offsetting items were personnel expenses of -580 million yen (increase in the number of employees and base pay), administrative expenses of -269 million yen (system usage fees), advertising expenses of -100 million yen (NIKKO MESSE and other items) and others of -43 million yen. M&A added +66 million yen, reflecting the consolidation of Nikko Fujiwara Electric Corp. from July 2025.
Segment Results
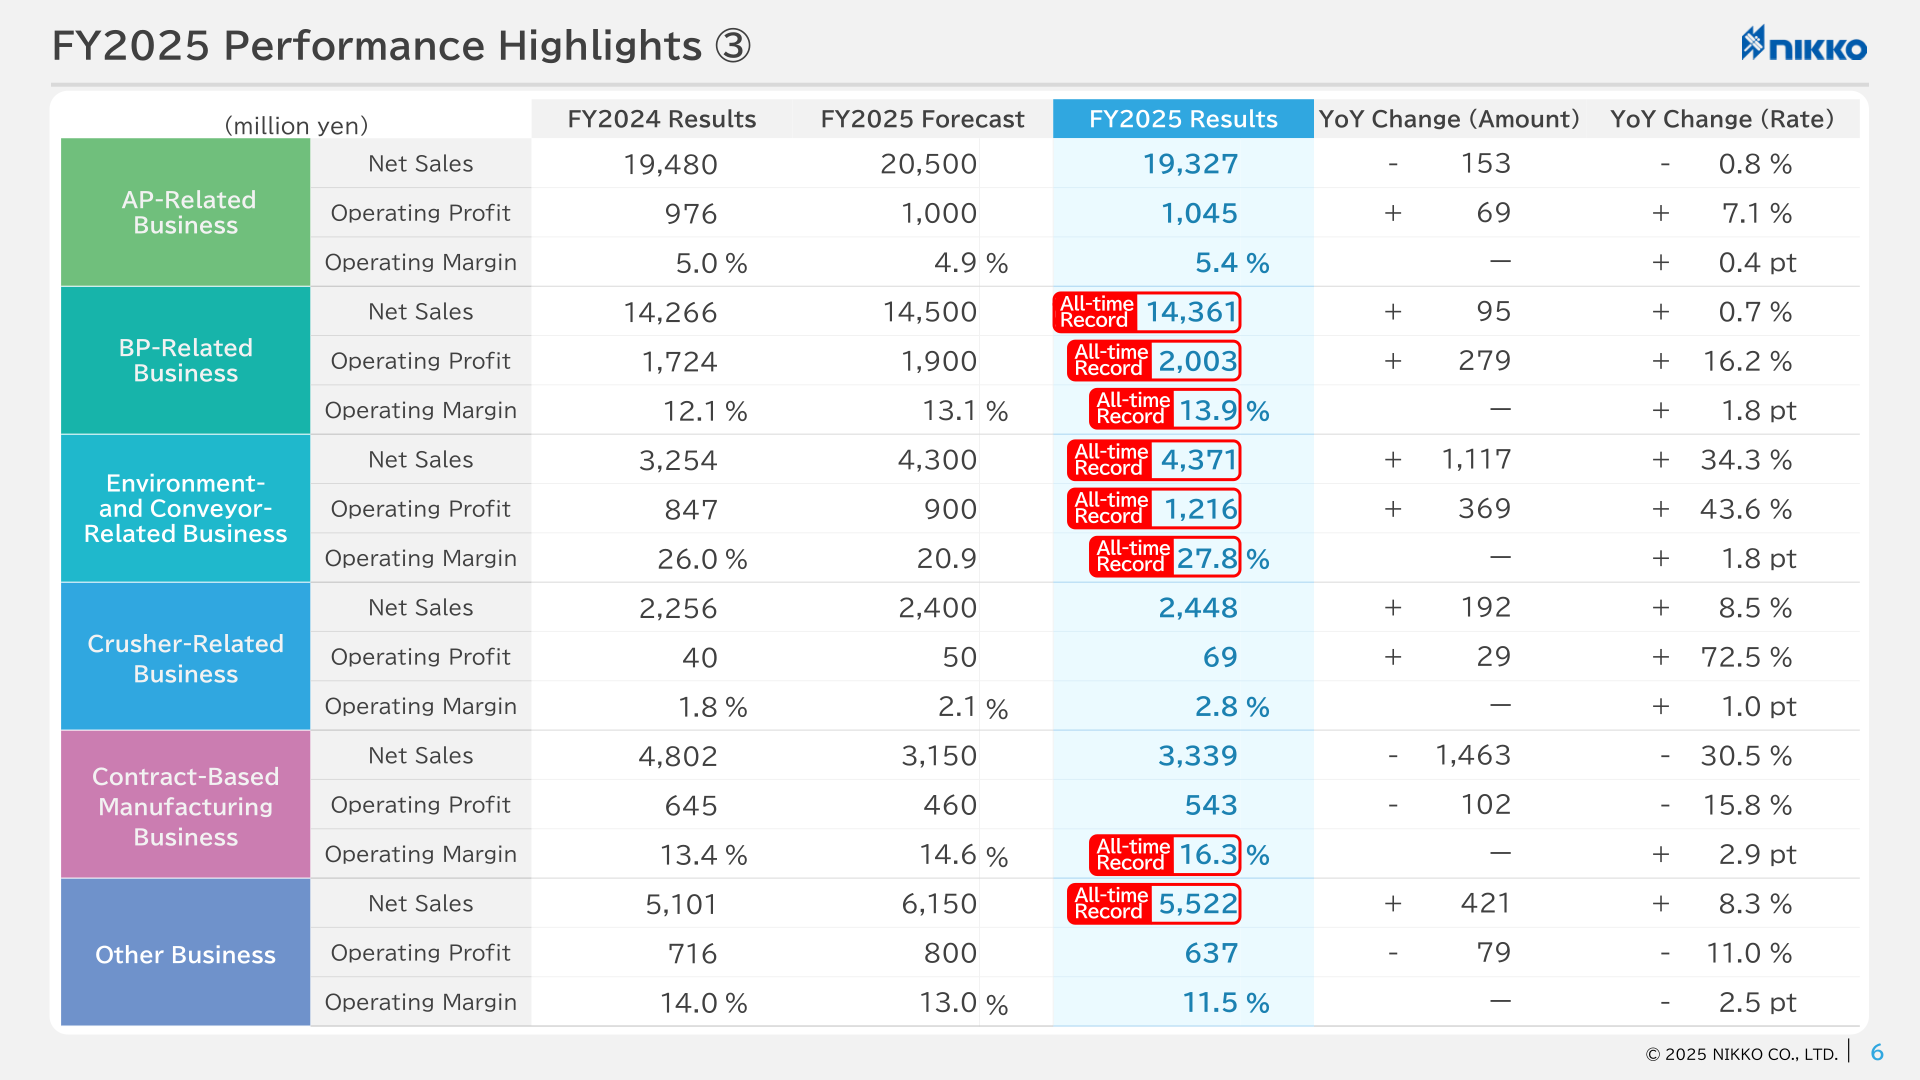
The BP-Related Business, the Environment- and Conveyor-Related Business and the Crusher-Related Business all posted higher net sales and operating profit. The AP-Related Business saw net sales decline 0.8% to 19,327 million yen but operating profit rise 7.1% to 1,045 million yen. The Contract-Based Manufacturing Business declined 30.5% in net sales on the rebound from large projects in the previous fiscal year, and Other Business operating profit fell 11.0%. Segment operating profit is presented on an internal management basis before allocation of corporate expenses.
| Segment | Metric | FY2024 Results | FY2025 Results | YoY Change (Rate) |
|---|---|---|---|---|
| AP-Related Business | Net Sales | 19,480 | 19,327 | – 0.8 % |
| AP-Related Business | Operating Profit | 976 | 1,045 | + 7.1 % |
| AP-Related Business | Operating Margin | 5.0 % | 5.4 % | + 0.4 pt |
| BP-Related Business | Net Sales | 14,266 | 14,361 | + 0.7 % |
| BP-Related Business | Operating Profit | 1,724 | 2,003 | + 16.2 % |
| BP-Related Business | Operating Margin | 12.1 % | 13.9 % | + 1.8 pt |
| Environment- and Conveyor-Related Business | Net Sales | 3,254 | 4,371 | + 34.3 % |
| Environment- and Conveyor-Related Business | Operating Profit | 847 | 1,216 | + 43.6 % |
| Environment- and Conveyor-Related Business | Operating Margin | 26.0 % | 27.8 % | + 1.8 pt |
| Crusher-Related Business | Net Sales | 2,256 | 2,448 | + 8.5 % |
| Crusher-Related Business | Operating Profit | 40 | 69 | + 72.5 % |
| Crusher-Related Business | Operating Margin | 1.8 % | 2.8 % | + 1.0 pt |
| Contract-Based Manufacturing Business | Net Sales | 4,802 | 3,339 | – 30.5 % |
| Contract-Based Manufacturing Business | Operating Profit | 645 | 543 | – 15.8 % |
| Contract-Based Manufacturing Business | Operating Margin | 13.4 % | 16.3 % | + 2.9 pt |
| Other Business | Net Sales | 5,101 | 5,522 | + 8.3 % |
| Other Business | Operating Profit | 716 | 637 | – 11.0 % |
| Other Business | Operating Margin | 14.0 % | 11.5 % | – 2.5 pt |
By segment, cumulative full-year order intake was 27,543 million yen for the AP-Related Business (FY2024: 19,512 million yen), 16,267 million yen for the BP-Related Business, 4,397 million yen for the Crusher-Related Business, 2,435 million yen for the Contract-Based Manufacturing Business, 3,202 million yen for the Environment- and Conveyor-Related Business and 5,910 million yen for Other Business. Within the AP-Related Business, domestic net sales were 15,257 million yen (YoY +0.6%) and overseas net sales were 4,070 million yen (YoY -5.7%); China net sales rose 11.5% from 2,799 million yen to 3,122 million yen, Thailand fell 33.7% from 866 million yen to 574 million yen and exports fell 41.9% from 639 million yen to 371 million yen. Overseas order intake was 4.0 billion yen (+52.9%) for China (Nikko Shanghai), 0.8 billion yen (+86.3%) for Thailand and 0.2 billion yen (-81.6%) for exports.
FY2026 Forecast
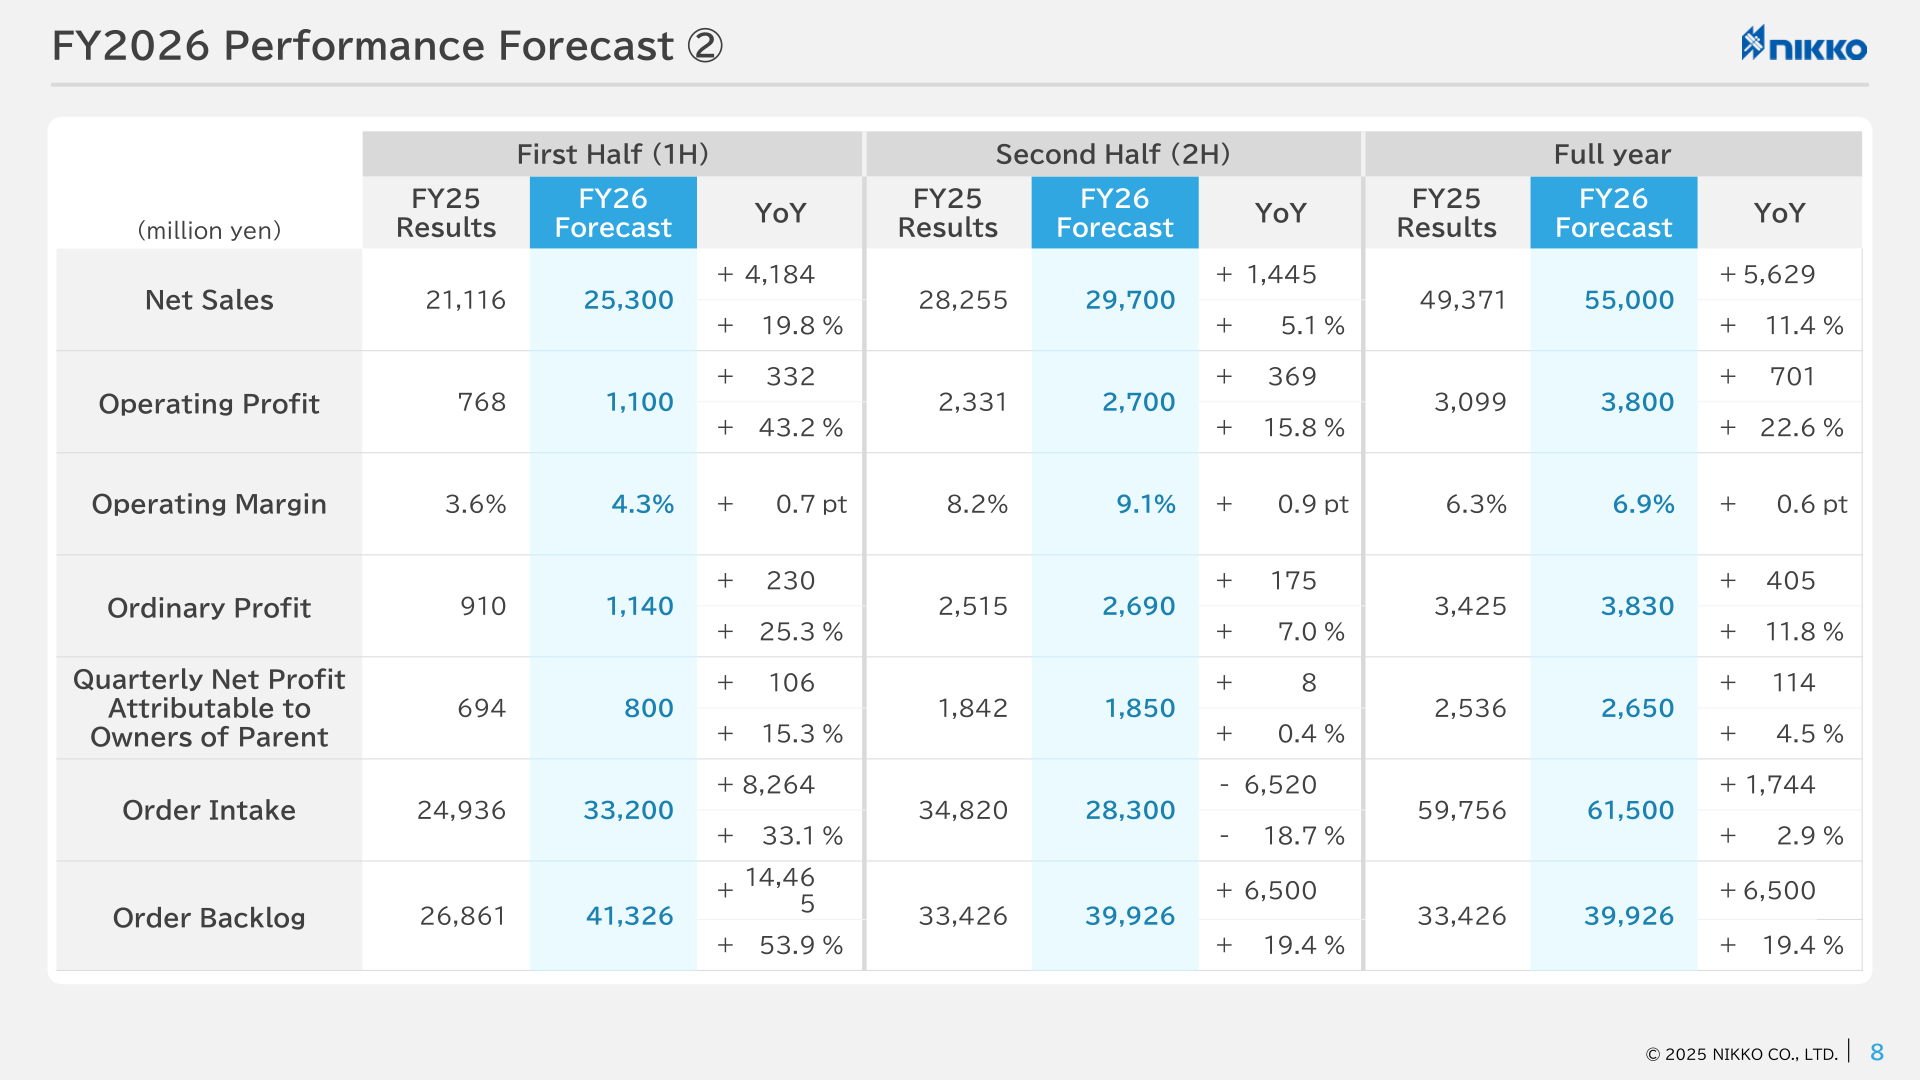
For FY2026 the Company forecasts net sales of 55,000 million yen (+11.4% YoY), operating profit of 3,800 million yen (+22.6%), ordinary profit of 3,830 million yen (+11.8%) and net profit attributable to owners of parent of 2,650 million yen (+4.5%). Operating margin is expected to improve 0.6pt to 6.9%. Order intake is forecast at 61,500 million yen and the order backlog at 39,926 million yen.
| (million yen) | FY2025 Results | FY2026 Forecast | YoY Change (Amount) | YoY Change (Rate) |
|---|---|---|---|---|
| Net Sales | 49,371 | 55,000 | + 5,629 | + 11.4 % |
| Operating Profit | 3,099 | 3,800 | + 701 | + 22.6 % |
| Operating Margin | 6.3% | 6.9% | – | + 0.6 pt |
| Ordinary Profit | 3,425 | 3,830 | + 405 | + 11.8 % |
| Net Profit Attributable to Owners of Parent | 2,536 | 2,650 | + 114 | + 4.5 % |
| Order Intake | 59,756 | 61,500 | + 1,744 | + 2.9 % |
| Order Backlog | 33,426 | 39,926 | + 6,500 | + 19.4 % |
On a segment basis, the FY2026 full-year forecast calls for net sales of 21,600 million yen (+11.8%) and operating profit of 1,530 million yen (+46.4%) in the AP-Related Business, and net sales of 16,000 million yen (+11.4%) with operating profit of 2,300 million yen (+14.8%) in the BP-Related Business. The Environment- and Conveyor-Related Business is forecast to see net sales increase 5.2% to 4,600 million yen while operating profit declines 14.5% to 1,040 million yen. In the Company’s bridge for FY2026 ordinary profit, net sales and the cost of sales ratio are expected to contribute +1,751 million yen, against personnel expenses of -650 million yen, R&D expenses of -128 million yen and others of -568 million yen.
Shareholder Returns
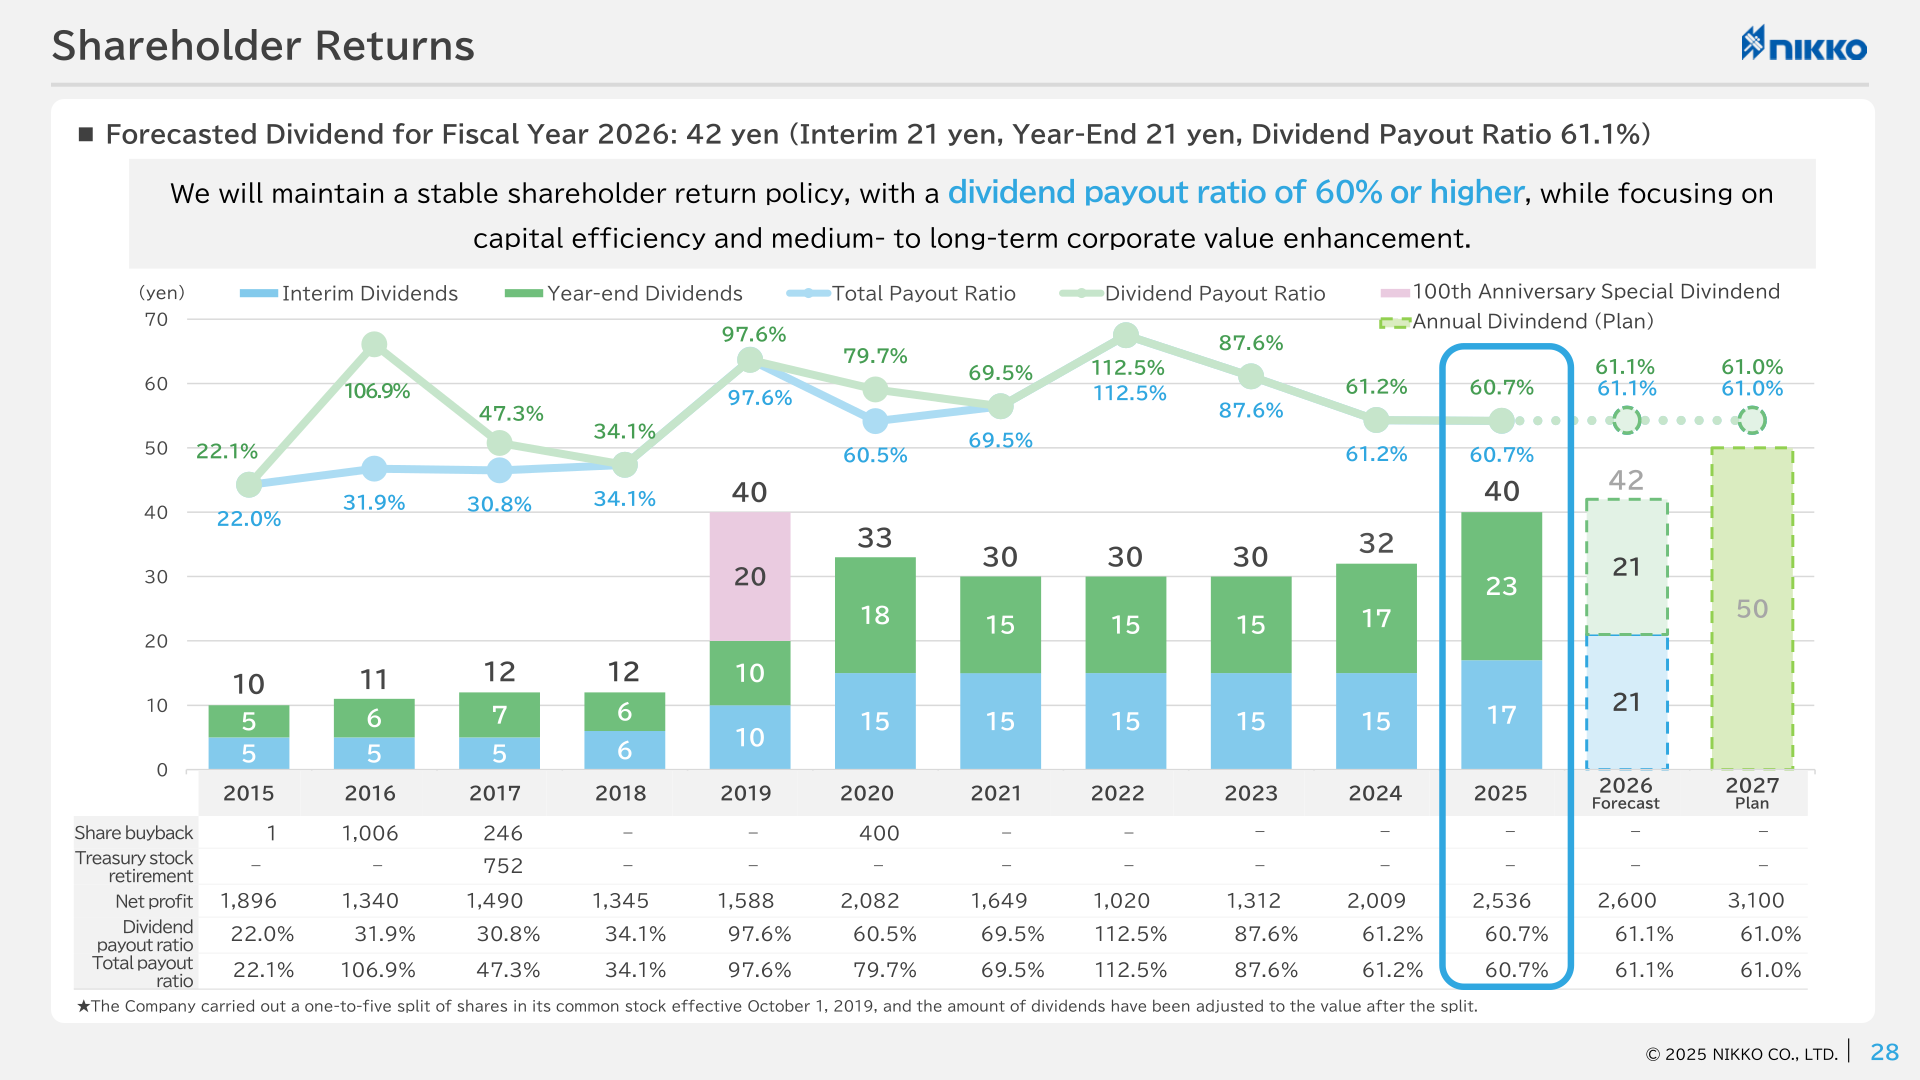
The FY2025 annual dividend was 40 yen per share (interim 17 yen, year-end 23 yen), for a dividend payout ratio of 60.7%. For FY2026 the Company forecasts an annual dividend of 42 yen (interim 21 yen, year-end 21 yen), a dividend payout ratio of 61.1%, and it shows an annual dividend plan of 50 yen for FY2027 at a payout ratio of 61.0%. The Company states that it will maintain a stable shareholder return policy with a dividend payout ratio of 60% or higher while focusing on capital efficiency and medium- to long-term corporate value enhancement. Dividend amounts are adjusted for the one-to-five stock split effective October 1, 2019.
| Item | FY2024 | FY2025 | FY2026 (Forecast) | FY2027 (Plan) |
|---|---|---|---|---|
| Interim dividend (yen) | 15 | 17 | 21 | – |
| Year-end dividend (yen) | 17 | 23 | 21 | – |
| Annual dividend (yen) | 32 | 40 | 42 | 50 |
| Dividend payout ratio | 61.2% | 60.7% | 61.1% | 61.0% |
| Total payout ratio | 61.2% | 60.7% | 61.1% | 61.0% |
Financial Position and Financial Strategy
Total assets at the end of FY2025 were 64,443 million yen, up 718 million yen from the end of FY2024, and total net assets were 37,409 million yen, up 2,849 million yen. Net assets per share rose 72.78 yen to 970.51 yen. Comparing FY2020 with FY2025, the Company shows ROE improving from 6.8% to 7.1% and the equity ratio moving from 64.5% to 58.0%. Under its financial strategy the Company states that it will continue reducing strategic shareholdings to enhance capital efficiency and will balance growth investments and shareholder returns while maintaining a payout ratio of 60% or higher.
Reference indicators disclosed in the materials include capital investment of 1,973 million yen, depreciation expenses of 1,302 million yen and R&D expenses of 672 million yen in FY2025, with the consolidated number of employees at 1,169. The ratio of net sales outside Japan was 8.5% in FY2025.
This article is an analysis based on publicly available information and is not a recommendation to buy or sell any specific securities. Investment decisions are your own responsibility.
![[Obayashi] Investors’ Guide 2026 — The Complete 24-Article Breakdown](https://japan-equity.com/wp-content/uploads/2026/07/hub_cover-1024x1024.png)
![[Obayashi] IR & SR Policy — Feeding Dialogue Back into Management](https://japan-equity.com/wp-content/uploads/2026/07/p32_sq-1024x1024.jpg)
![[Obayashi] Real Estate Development — 18.7% Margin, ¥287.7bn Unrealized Gains](https://japan-equity.com/wp-content/uploads/2026/07/p20_sq-1024x1024.jpg)
![[Obayashi] Domestic Civil Engineering — Resilience Spending Supports 9.6% Margin](https://japan-equity.com/wp-content/uploads/2026/07/p11_sq-1024x1024.jpg)
![[Obayashi] Share Price & External Ratings — vs TOPIX, ESG Index Inclusion](https://japan-equity.com/wp-content/uploads/2026/07/p40_sq-1024x1024.jpg)
![[Construction] ¥75.5tn Investment, Shrinking Workforce — Big-5 Market Share](https://japan-equity.com/wp-content/uploads/2026/07/p12_sq-1024x1024.jpg)



![[Obayashi] Capital Policy & Shareholder Returns — ROE 10%+, DOE ~5%, ¥100bn Buyback](https://japan-equity.com/wp-content/uploads/2026/07/p27_sq-1024x1024.jpg)
![[Obayashi] Reducing Cross-Shareholdings — ¥285.2bn Sold in Five Years](https://japan-equity.com/wp-content/uploads/2026/07/p29_sq-1024x1024.jpg)
![[Obayashi] ¥750bn Investment Plan — ¥300bn to Development, ¥190bn to Tech/DX](https://japan-equity.com/wp-content/uploads/2026/07/p30_sq-1024x1024.jpg)
![[Obayashi] MTP2022 KPIs — Operating Profit ~2x Target, ROE 14.4%](https://japan-equity.com/wp-content/uploads/2026/07/p25_sq-1024x1024.jpg)
![[Obayashi] Cash Allocation — ¥420bn Investment CF Over Five Years](https://japan-equity.com/wp-content/uploads/2026/07/p26_sq-1024x1024.jpg)
![[Obayashi] Green Energy — 44 Plants, 344MW, and the Green Hydrogen Challenge](https://japan-equity.com/wp-content/uploads/2026/07/p21_sq-1024x1024.jpg)
![[Obayashi] Tackling the Labor Shortage — Robotics Construction®](https://japan-equity.com/wp-content/uploads/2026/07/p14_sq-1024x1024.jpg)
