
This article is based on publicly available IR materials and is not a recommendation to buy or sell any specific securities.
Y.A.C. Holdings Co., Ltd. (TSE Prime, Code No. 6298) released its “Summary for Financial Results” presentation for the fiscal year ended March 31, 2026 on May 21, 2026; the materials refer to this year as FY2025 in the narrative sections and as FY3/2026 in the tables. Net sales rose 14.8% year on year to 26,460 million yen and net profit rose 137.1% to 1,326 million yen, while operating profit slipped 2.6% to 1,319 million yen. The company describes the year as one of “increased revenue and profit,” with a “one-off special factor” driving the significant improvement in bottom-line profit. For the fiscal year ending March 2027 (FY3/2027) it forecasts net sales of 35,000 million yen and net profit of 2,000 million yen, and plans an annual dividend of 45 yen per share.
Consolidated Results (Full Year Ended March 31, 2026)
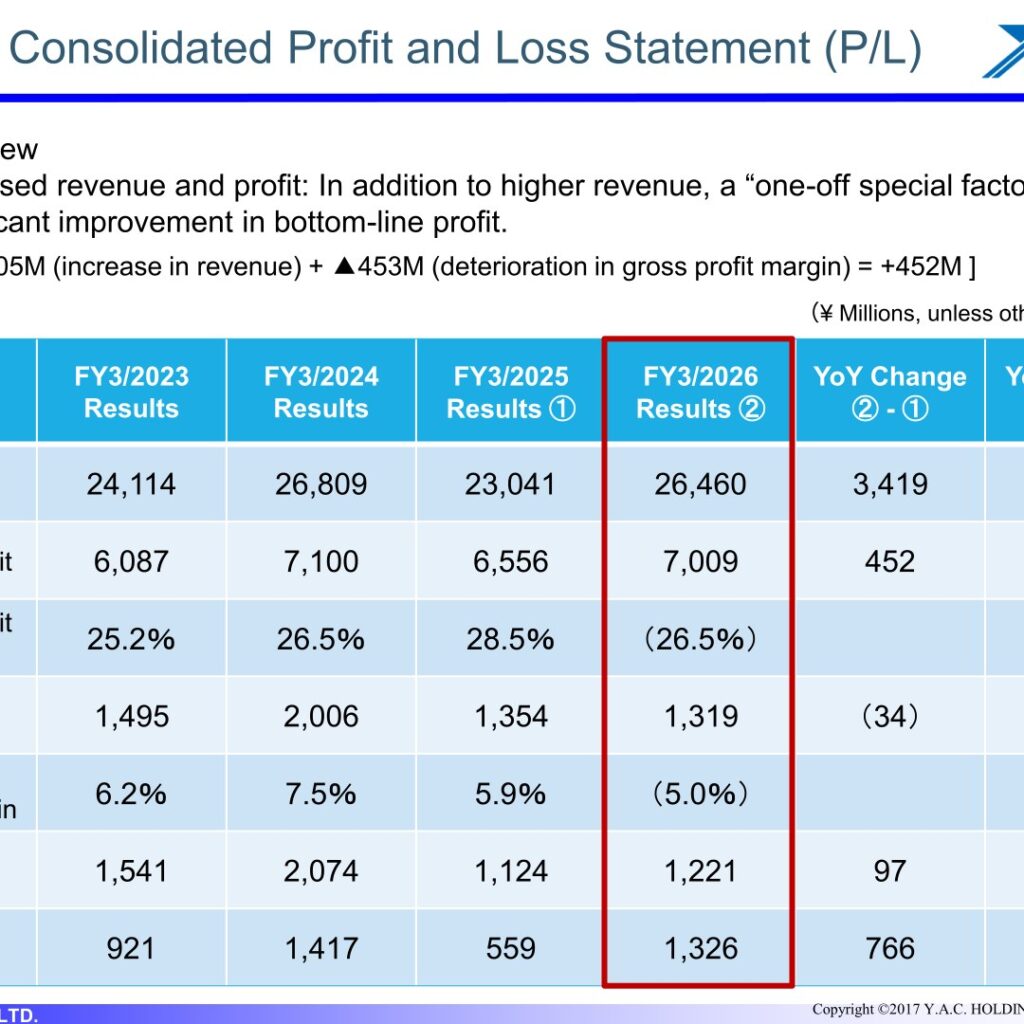
On the overall summary slide the company states that, in addition to the increase in gross profit accompanying higher revenue, the improvement in non-operating income/loss and extraordinary income/loss resulted in profit for the period — the bottom line — reaching 1.3 billion yen, doubling from the previous fiscal year. Gross profit growth is broken down on the P/L slide as “+905M (increase in revenue) + ▲453M (deterioration in gross profit margin) = +452M”. Operating profit recorded a slight decrease due in part to the full-year burden of expenses from the subsidiary that joined the Group in January 2025. Ordinary profit turned to an increase as a result of improvements in non-operating income and expenses, including the reversal of allowance for doubtful accounts and an improvement in foreign exchange gains/losses. With the contribution of extraordinary income — particularly negative goodwill — net profit doubled (559 million yen to 1,326 million yen).
| Item (¥ Millions) | FY3/2026 Results ② | FY3/2025 Results ① | YoY Change ②-① | YoY Growth Rate |
|---|---|---|---|---|
| Net Sales | 26,460 | 23,041 | 3,419 | 14.8% |
| Gross Profit | 7,009 | 6,556 | 452 | 6.9% |
| Operating Profit | 1,319 | 1,354 | (34) | (2.6%) |
| Ordinary Profit | 1,221 | 1,124 | 97 | 8.6% |
| Net Profit | 1,326 | 559 | 766 | 137.1% |
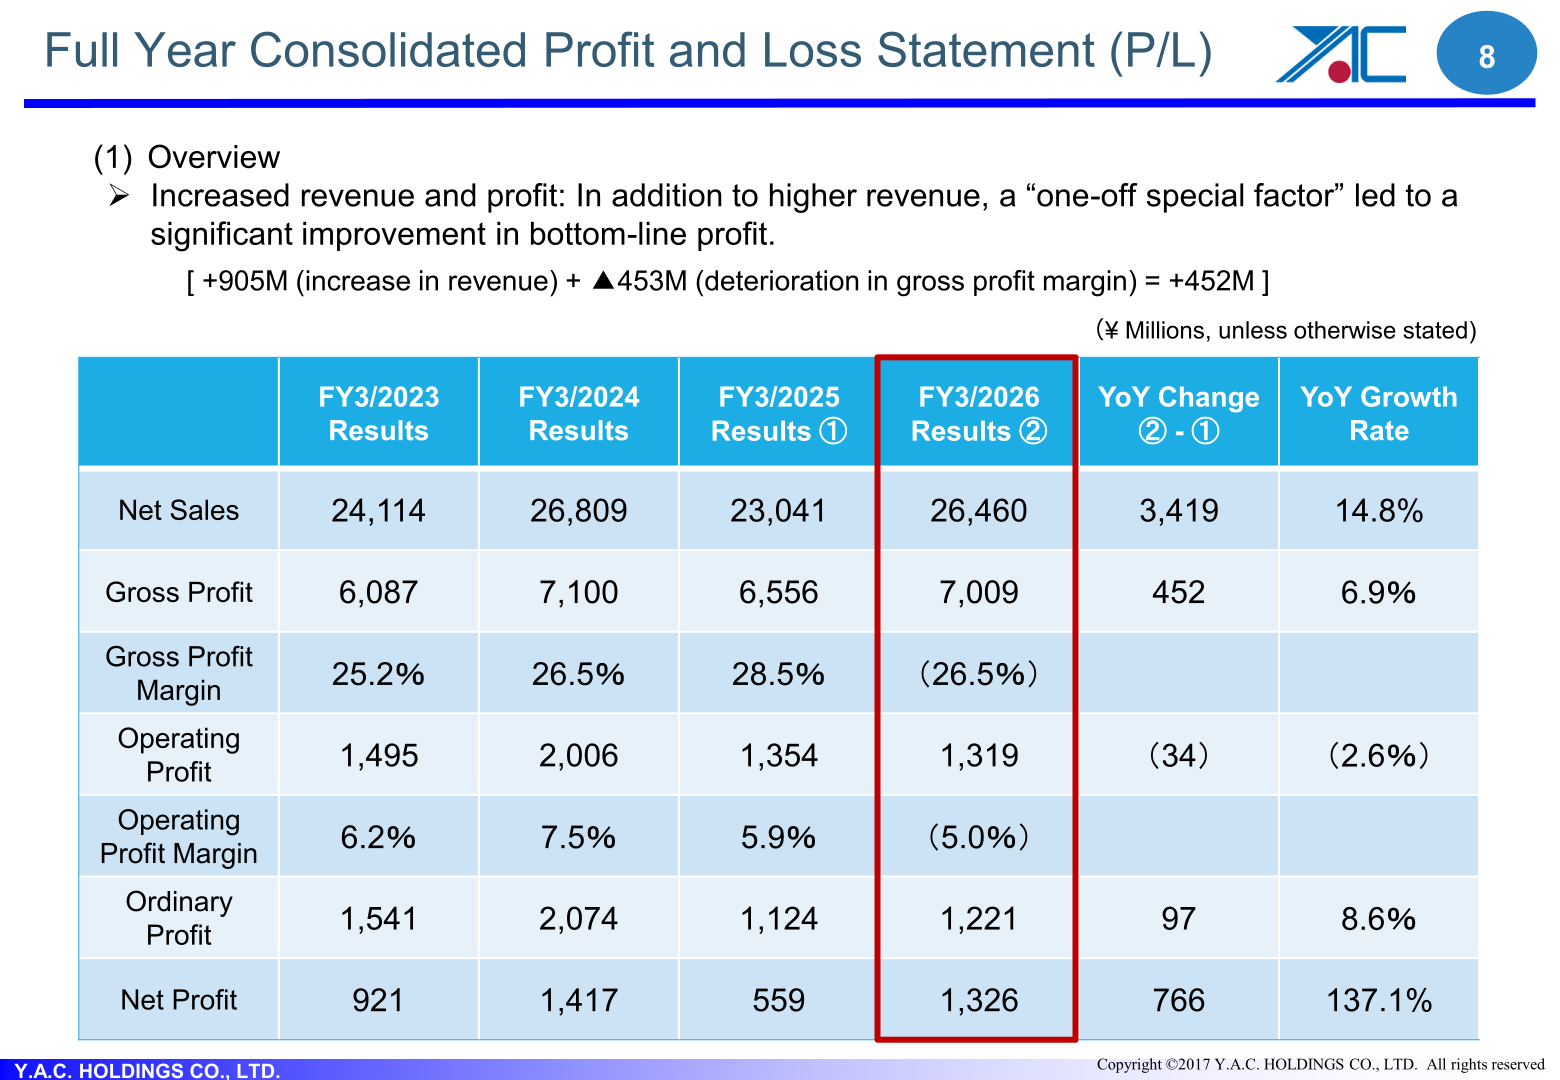
The six-year trend table shows margins for FY3/2026 of 26.5% for gross profit (28.5% in FY3/2025), 5.0% for operating profit (5.9%) and 4.6% for ordinary profit (4.9%). On the ROE slide, the net profit margin was 5.01% versus 2.225% a year earlier, total asset turnover was 0.604 turns versus 0.561 turns, financial leverage was 2.586 times versus 2.434 times, and ROE rose to 7.83% from 3.03%; the company attributes the increase to improved profitability and enhanced asset efficiency.
Segment Results
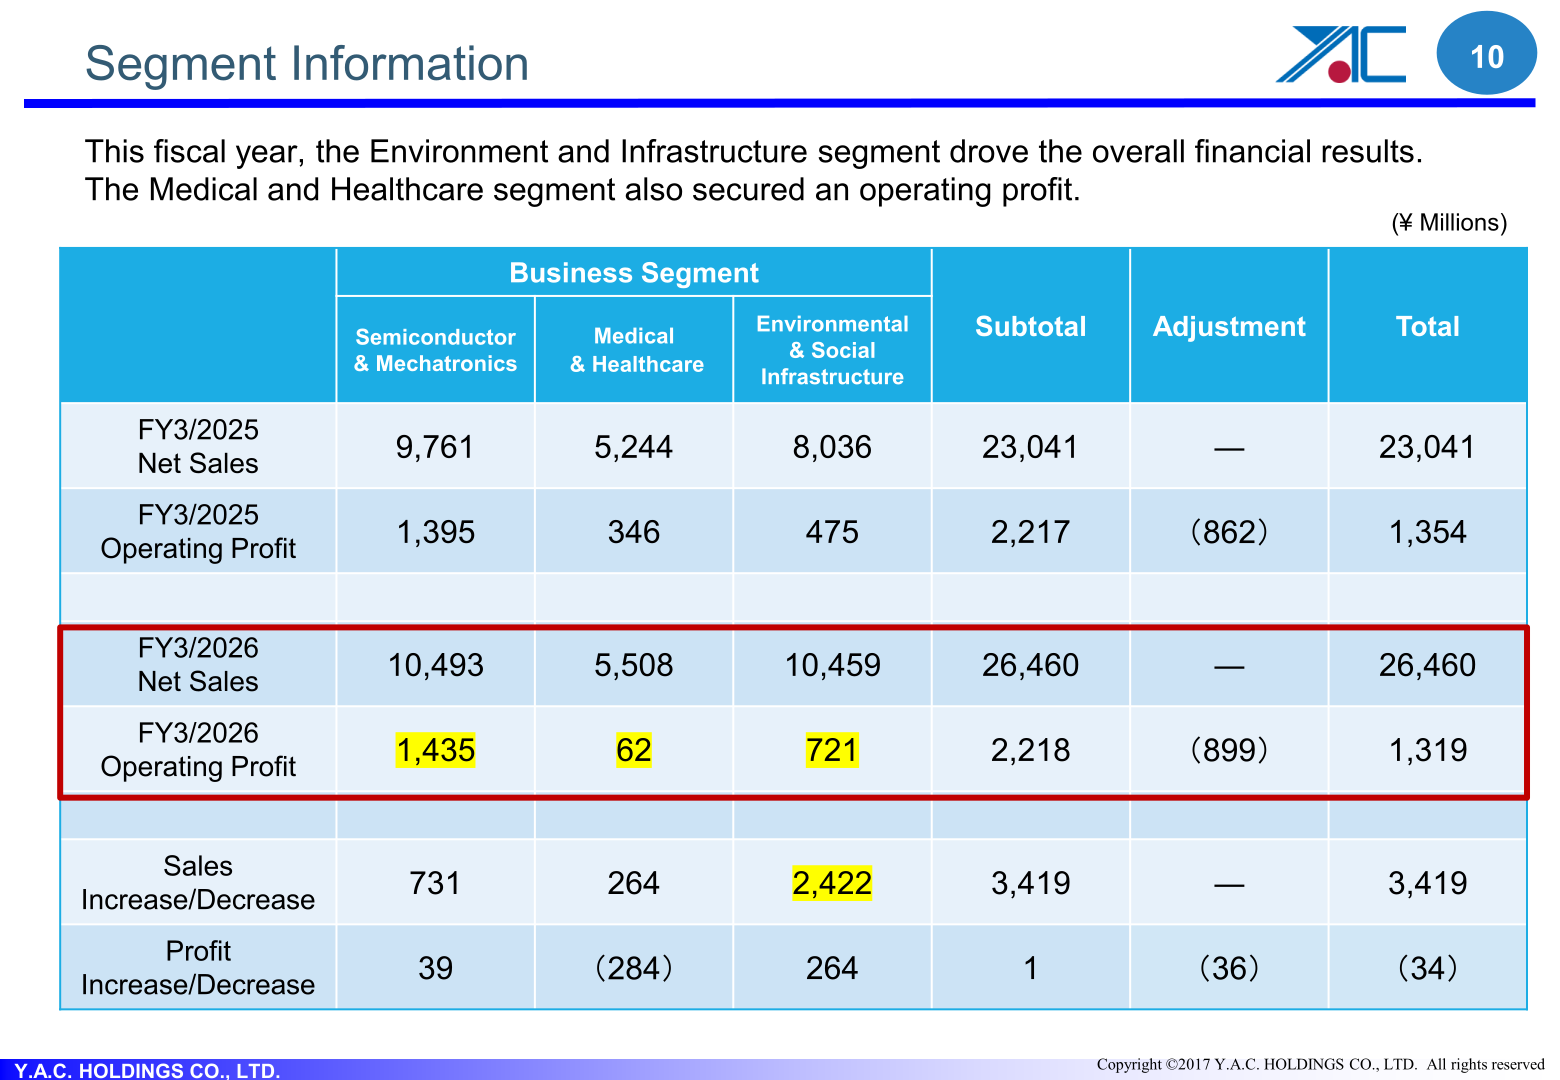
The company reports three business segments. It states that this fiscal year the Environment and Infrastructure segment drove the overall financial results and that the Medical and Healthcare segment also secured an operating profit. Effective April 2025 certain group companies within the segments were reorganized, and figures for FY2024 have been recalculated based on the revised segment composition.
| Item (¥ Millions) | Semiconductor & Mechatronics | Medical & Healthcare | Environmental & Social Infrastructure | Subtotal | Adjustment | Total |
|---|---|---|---|---|---|---|
| FY3/2025 Net Sales | 9,761 | 5,244 | 8,036 | 23,041 | ― | 23,041 |
| FY3/2025 Operating Profit | 1,395 | 346 | 475 | 2,217 | (862) | 1,354 |
| FY3/2026 Net Sales | 10,493 | 5,508 | 10,459 | 26,460 | ― | 26,460 |
| FY3/2026 Operating Profit | 1,435 | 62 | 721 | 2,218 | (899) | 1,319 |
| Sales Increase/Decrease | 731 | 264 | 2,422 | 3,419 | ― | 3,419 |
| Profit Increase/Decrease | 39 | (284) | 264 | 1 | (36) | (34) |
In the Semiconductor and Mechatronics related Business the company cites higher revenue and profit year on year, strong performance in clean conveyors for semiconductor front-end processes, solid sales of electronic component taping machines and carrier tapes, and strong demand for IPA dryers and pure-water heating systems, offset by postponed sales of hard disk-related equipment and weak performance in used equipment and resale operations. In the Environmental and Social Infrastructure related Business it reports net sales of 10.4 billion yen, up 30.1% year on year, and segment profit of 700 million yen, up 51.9% year on year, driven by the FPD business, the optical measurement equipment business and expansion of control and communication businesses related to renewable energy and battery storage; challenges cited are the launch of the paper packaging machine business and declining demand for optical inspection equipment. In the Medical and Healthcare related Business, YAC Elex promoted the transition to next-generation dialysis machine production and sales continued to perform steadily, and in July the company launched a hair-based diagnostic support service for Autism Spectrum Disorder (ASD) and began accepting advance orders for the high-sensitivity optical digital immunoassay analyzer; despite higher revenue, segment profit declined due to rising raw material costs, adjustments associated with the transition to the next-generation model, and the time required for launching and gaining market penetration for new businesses.
For the FY2026 outlook the company expects clean conveyors, IPA dryers and pure-water heating systems, and taping machines and carrier tapes to remain strong, anticipates sales of hard disk-related equipment and of manufacturing equipment for perovskite solar cells, and is monitoring domestic and overseas investment trends in power semiconductors. In the Environmental and Social Infrastructure segment it cites an order backlog of 12,452 million yen, up 33.7% year on year including preliminary orders, an expected recovery in demand for optical inspection equipment, and a contribution to sales and profit from the addition of Sanwa Electric Instrument to the Group. In Medical and Healthcare, orders for the new dialysis machines from YAC Elex continue to progress smoothly, a major order has already been secured in Singapore driven by increased demand from AI data centers and the resulting recovery in the HDD industry, and YAC BIO plans to achieve higher revenue and profit through further expansion of its hair-based diagnostics business and sales of dementia biomarker assay kits.
Orders Received and Order Backlog
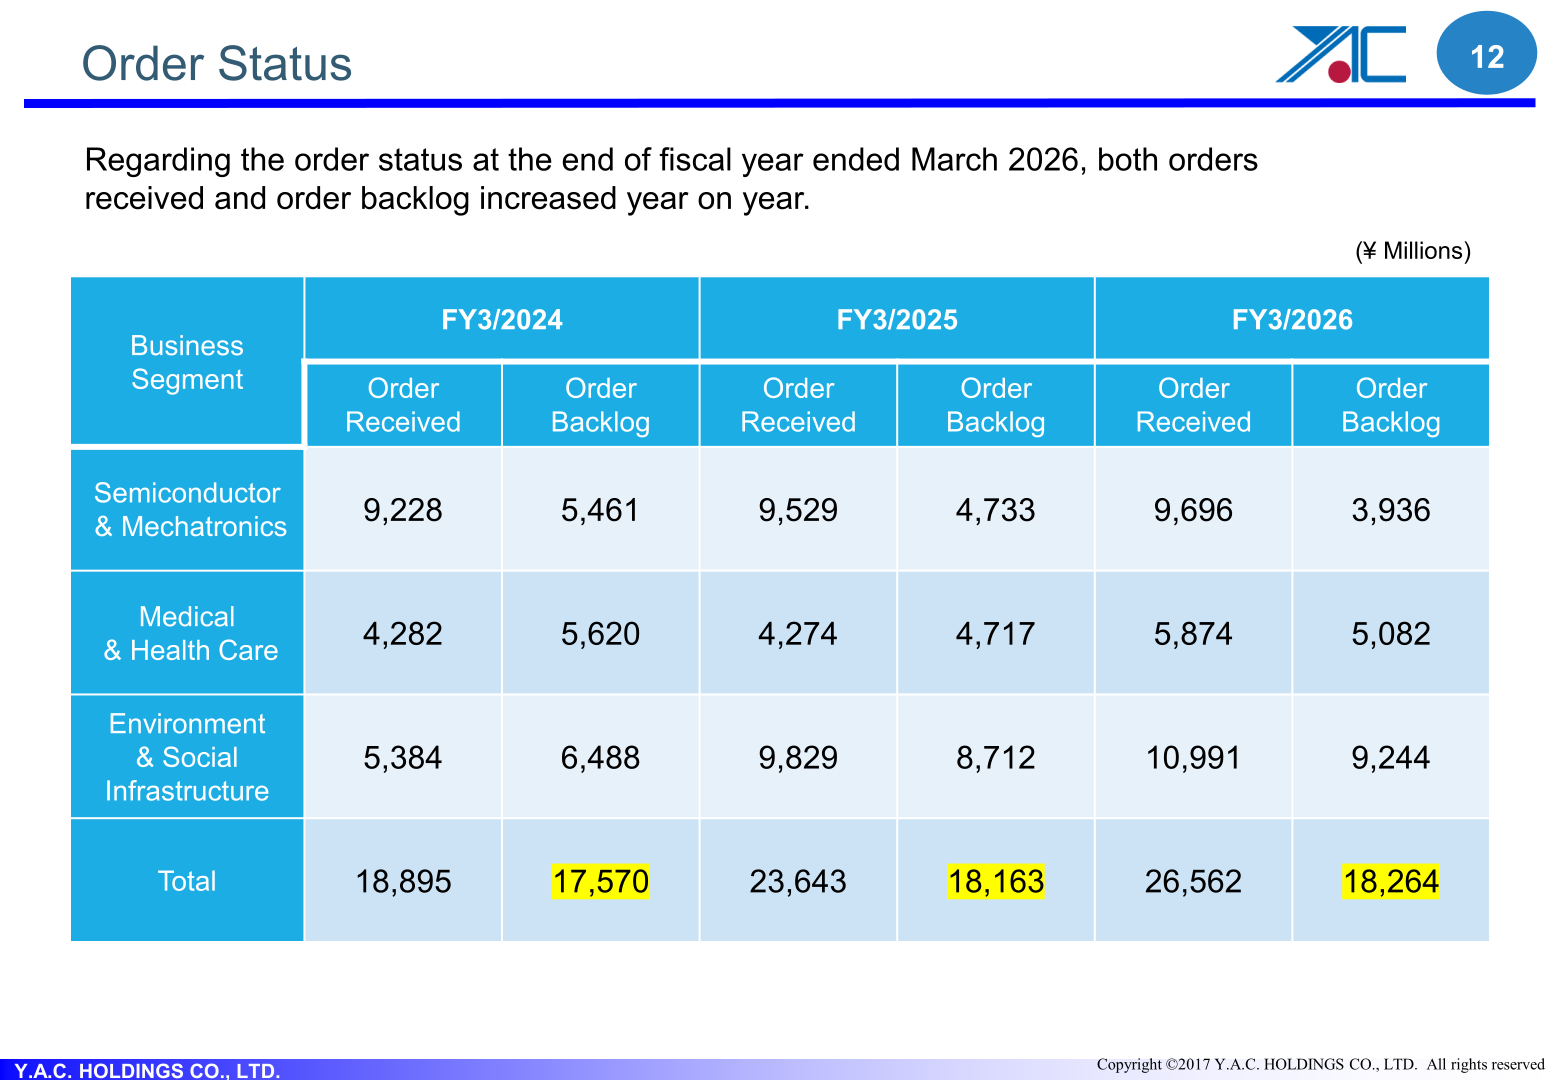
Regarding the order status at the end of the fiscal year ended March 2026, the company states that both orders received and order backlog increased year on year.
| Business Segment (¥ Millions) | FY3/2025 Order Received | FY3/2025 Order Backlog | FY3/2026 Order Received | FY3/2026 Order Backlog |
|---|---|---|---|---|
| Semiconductor & Mechatronics | 9,529 | 4,733 | 9,696 | 3,936 |
| Medical & Health Care | 4,274 | 4,717 | 5,874 | 5,082 |
| Environment & Social Infrastructure | 9,829 | 8,712 | 10,991 | 9,244 |
| Total | 23,643 | 18,163 | 26,562 | 18,264 |
Financial Position and Cash Flow
Total assets of 43.7 billion yen increased by 2.7 billion yen compared with the end of March 2025 — on the asset side the acquisition of Linus Biotechnology Inc. shares and Sanwa Tesmex Inc. land, and on the liability side an increase in borrowings related to those acquisitions. Total assets were 43,793 million yen versus 41,086 million yen, non-current assets 14,184 million yen versus 11,325 million yen, non-current liabilities 11,173 million yen versus 8,980 million yen, and total net assets 16,976 million yen versus 17,093 million yen. The consolidated equity ratio declined slightly to 38.7% from 41.1%, mainly due to the increase in total assets. Operating cash flow remained positive at 3,070 million yen, supported by a significant improvement in working capital factors (profit factors +1,203 M plus working capital factors +1,867 M); investing activities cash flow was (2,028) million yen and financing activities cash flow was 494 million yen, leaving cash and cash equivalents at the end of the fiscal year of 8,653 million yen.
Full-Year Forecast for FY3/2027
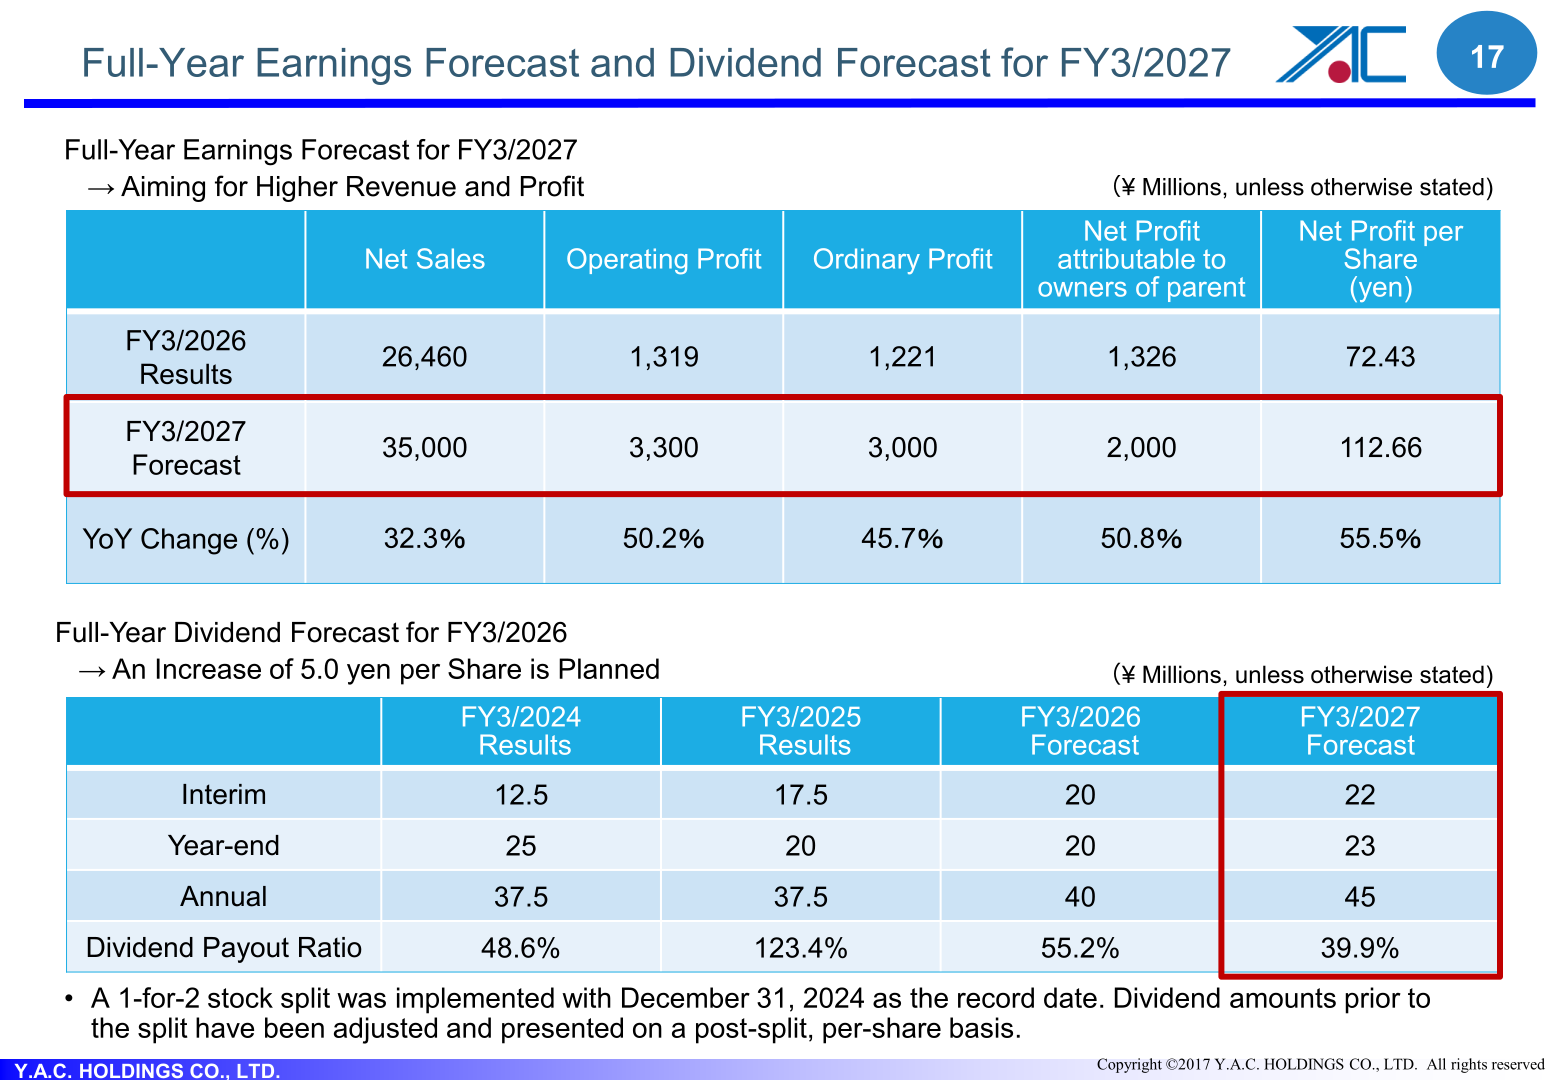
The company is aiming for higher revenue and profit in FY3/2027, forecasting net sales of 35,000 million yen, operating profit of 3,300 million yen, ordinary profit of 3,000 million yen, and net profit attributable to owners of parent of 2,000 million yen, with net profit per share of 112.66 yen.
| Item (¥ Millions, unless otherwise stated) | FY3/2026 Results | FY3/2027 Forecast | YoY Change (%) |
|---|---|---|---|
| Net Sales | 26,460 | 35,000 | 32.3% |
| Operating Profit | 1,319 | 3,300 | 50.2% |
| Ordinary Profit | 1,221 | 3,000 | 45.7% |
| Net Profit attributable to owners of parent | 1,326 | 2,000 | 50.8% |
| Net Profit per Share (yen) | 72.43 | 112.66 | 55.5% |
Shareholder Returns
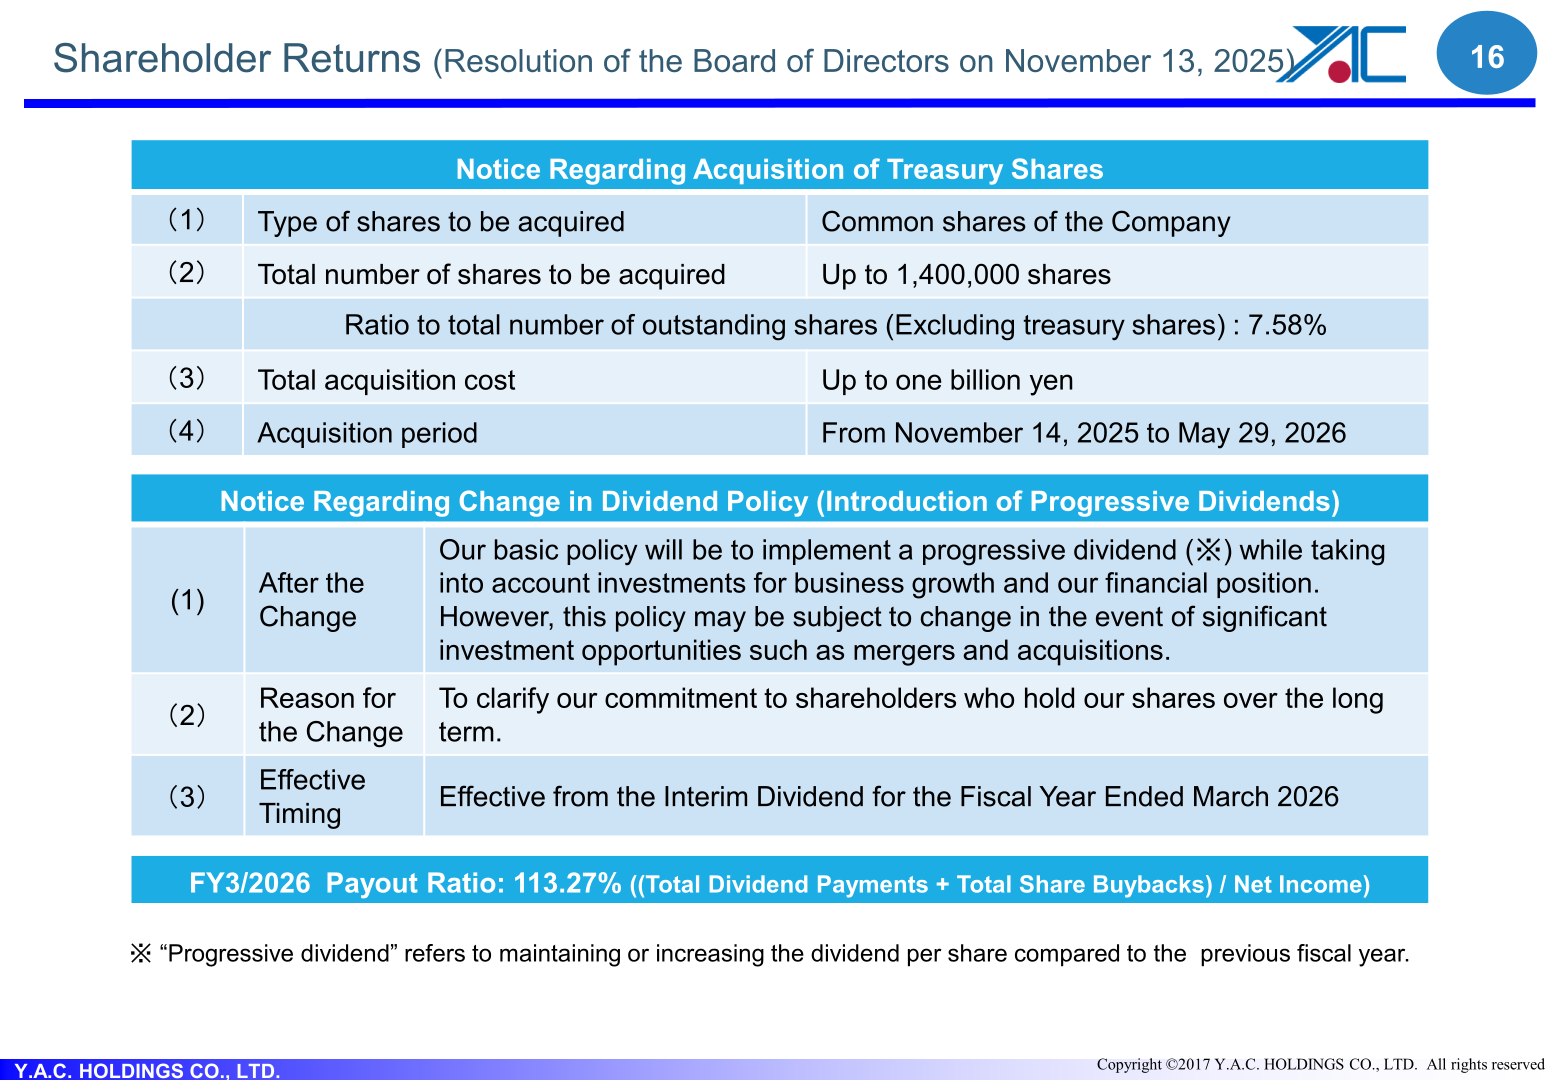
By resolution of the Board of Directors on November 13, 2025, the company announced the acquisition of up to 1,400,000 common shares — 7.58% of the total number of shares outstanding excluding treasury shares — for a total acquisition cost of up to one billion yen, with an acquisition period from November 14, 2025 to May 29, 2026. It also changed its dividend policy to introduce a progressive dividend, defined in the materials as maintaining or increasing the dividend per share compared with the previous fiscal year; the stated reason is to clarify its commitment to shareholders who hold its shares over the long term, effective from the interim dividend for the fiscal year ended March 2026. The FY3/2026 payout ratio measured as (total dividend payments + total share buybacks) / net income was 113.27%. The dividend plan for FY3/2027 is an annual 45 yen per share (22 yen interim and 23 yen year-end), an increase of 5.0 yen per share, with the forecast dividend payout ratio expected to be just under 40% (45 yen / 112.66 yen). A 1-for-2 stock split was implemented with December 31, 2024 as the record date, and dividend amounts prior to the split have been adjusted and presented on a post-split, per-share basis.
| Dividend per Share (yen) | FY3/2024 Results | FY3/2025 Results | FY3/2026 Forecast | FY3/2027 Forecast |
|---|---|---|---|---|
| Interim | 12.5 | 17.5 | 20 | 22 |
| Year-end | 25 | 20 | 20 | 23 |
| Annual | 37.5 | 37.5 | 40 | 45 |
| Dividend Payout Ratio | 48.6% | 123.4% | 55.2% | 39.9% |
Medium-Term Direction and Topics
As a business topic for the year, the company states that it achieved the integration of Sanwa Electric Instrument Co., Ltd., the leading manufacturer in Japan’s electrical and on-site measurement market, into the Group, noting that “SANWA” is already established as a global brand. The strategic direction slide sets out four pillars — expansion of existing businesses, general purpose new products, the Medical & Healthcare business, and growth through M&A — spanning the FY2024–FY2026 and FY2027–FY2029 Mid-Term Management Plans, with the aim of becoming a 100 billion yen company by 2030 through sustained corporate growth driven by multiple growth engines. The company also describes management focused on ROE, decomposed into net profit margin (improvement in gross profit margin, development of high-value-added products, proper management of on-site operating rates), asset turnover (fabless management, proper inventory levels, review of unprofitable businesses) and financial leverage, where it is targeting an equity ratio of 50%. In the Medical and Healthcare sector it presents a three-layer growth strategy of hemodialysis machines as stable earnings, the hair diagnosis support service as growth options, and the biomarker business as future value.
This article is an analysis based on publicly available information and is not a recommendation to buy or sell any specific securities. Investment decisions are your own responsibility.
![[Obayashi] Investors’ Guide 2026 — The Complete 24-Article Breakdown](https://japan-equity.com/wp-content/uploads/2026/07/hub_cover-1024x1024.png)
![[Obayashi] IR & SR Policy — Feeding Dialogue Back into Management](https://japan-equity.com/wp-content/uploads/2026/07/p32_sq-1024x1024.jpg)
![[Obayashi] Real Estate Development — 18.7% Margin, ¥287.7bn Unrealized Gains](https://japan-equity.com/wp-content/uploads/2026/07/p20_sq-1024x1024.jpg)
![[Obayashi] Domestic Civil Engineering — Resilience Spending Supports 9.6% Margin](https://japan-equity.com/wp-content/uploads/2026/07/p11_sq-1024x1024.jpg)
![[Obayashi] Share Price & External Ratings — vs TOPIX, ESG Index Inclusion](https://japan-equity.com/wp-content/uploads/2026/07/p40_sq-1024x1024.jpg)
![[Construction] ¥75.5tn Investment, Shrinking Workforce — Big-5 Market Share](https://japan-equity.com/wp-content/uploads/2026/07/p12_sq-1024x1024.jpg)



![[Obayashi] Capital Policy & Shareholder Returns — ROE 10%+, DOE ~5%, ¥100bn Buyback](https://japan-equity.com/wp-content/uploads/2026/07/p27_sq-1024x1024.jpg)
![[Obayashi] Reducing Cross-Shareholdings — ¥285.2bn Sold in Five Years](https://japan-equity.com/wp-content/uploads/2026/07/p29_sq-1024x1024.jpg)
![[Obayashi] ¥750bn Investment Plan — ¥300bn to Development, ¥190bn to Tech/DX](https://japan-equity.com/wp-content/uploads/2026/07/p30_sq-1024x1024.jpg)
![[Obayashi] MTP2022 KPIs — Operating Profit ~2x Target, ROE 14.4%](https://japan-equity.com/wp-content/uploads/2026/07/p25_sq-1024x1024.jpg)
![[Obayashi] Cash Allocation — ¥420bn Investment CF Over Five Years](https://japan-equity.com/wp-content/uploads/2026/07/p26_sq-1024x1024.jpg)
![[Obayashi] Green Energy — 44 Plants, 344MW, and the Green Hydrogen Challenge](https://japan-equity.com/wp-content/uploads/2026/07/p21_sq-1024x1024.jpg)
![[Obayashi] Tackling the Labor Shortage — Robotics Construction®](https://japan-equity.com/wp-content/uploads/2026/07/p14_sq-1024x1024.jpg)
