
This article is based on publicly available IR materials and is not a recommendation to buy or sell any specific securities.
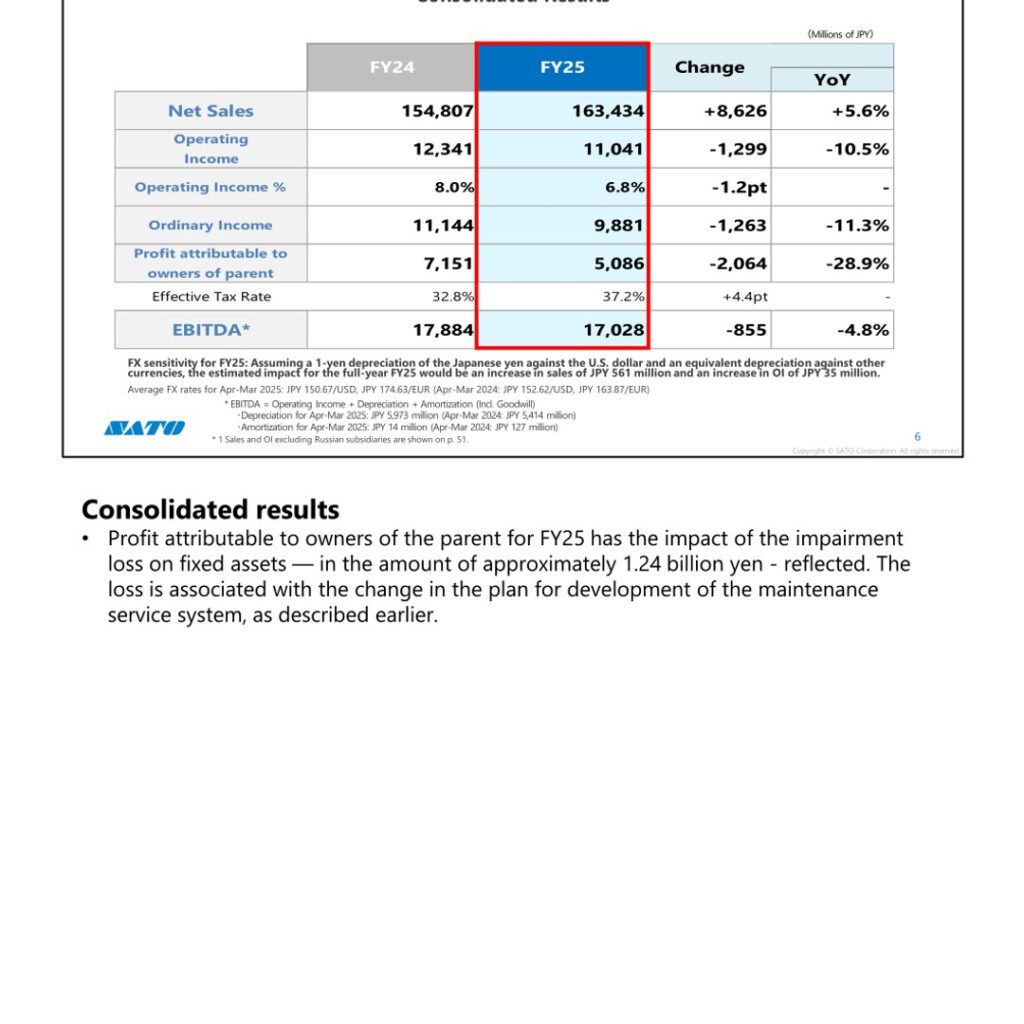
SATO Corporation reported FY 2025 results (fiscal year ended March 31, 2026) with net sales of 163,434 million yen, up 5.6% year on year, while operating income fell 10.5% to 11,041 million yen. Profit attributable to owners of parent declined 28.9% to 5,086 million yen, reflecting an impairment loss on fixed assets of approximately 1.24 billion yen recognized in the fourth quarter in connection with a change in the development plan for the company’s maintenance service system. Sales rose on strong overseas performance and brisk sales in Japan — particularly in logistics, where revised logistics efficiency laws drove demand — but the increased earnings of the Japan business were not sufficient to fully offset declines in the overseas base business and the primary labels business. For FY 2026 the company forecasts net sales of 168,500 million yen (+3.1%) and operating income of 11,700 million yen (+6.0%).
Consolidated Results (Full-Year Actual)
Consolidated sales increased 5.6% (+3.7% in local currencies) while operating income declined 10.5% (-8.9% in local currencies), taking the operating income margin down 1.2 points to 6.8%. Ordinary income was 9,881 million yen (-11.3%) and EBITDA was 17,028 million yen (-4.8%). Average FX rates for April–March 2025 were JPY 150.67/USD and JPY 174.63/EUR, against JPY 152.62/USD and JPY 163.87/EUR a year earlier.
| Item (Millions of JPY) | FY24 | FY25 | Change | YoY |
|---|---|---|---|---|
| Net Sales | 154,807 | 163,434 | +8,626 | +5.6% |
| Operating Income | 12,341 | 11,041 | -1,299 | -10.5% |
| Operating Income % | 8.0% | 6.8% | -1.2pt | – |
| Ordinary Income | 11,144 | 9,881 | -1,263 | -11.3% |
| Profit attributable to owners of parent | 7,151 | 5,086 | -2,064 | -28.9% |
| Effective Tax Rate | 32.8% | 37.2% | +4.4pt | – |
| EBITDA | 17,884 | 17,028 | -855 | -4.8% |
On the impairment loss: the company set out in 2020 to develop new core systems, and in 2024 narrowed the scope to phased replacement of the backbone system, the consumables production system and the maintenance service system. Development of the core system and the consumables production system has been progressing as planned, but critical problems surfaced in the maintenance service system in the form of inherent limitations of the software package and development quality issues that would cause schedule delays. Based on the applicable accounting standards, an impairment loss on fixed assets of 1.24 billion yen was recognized for the fourth quarter of FY 2025. The company reduced the monthly remuneration of the Group CEO and Vice President by 20% for three months, and is considering the possibility of claiming compensation for damages against the software development vendor.
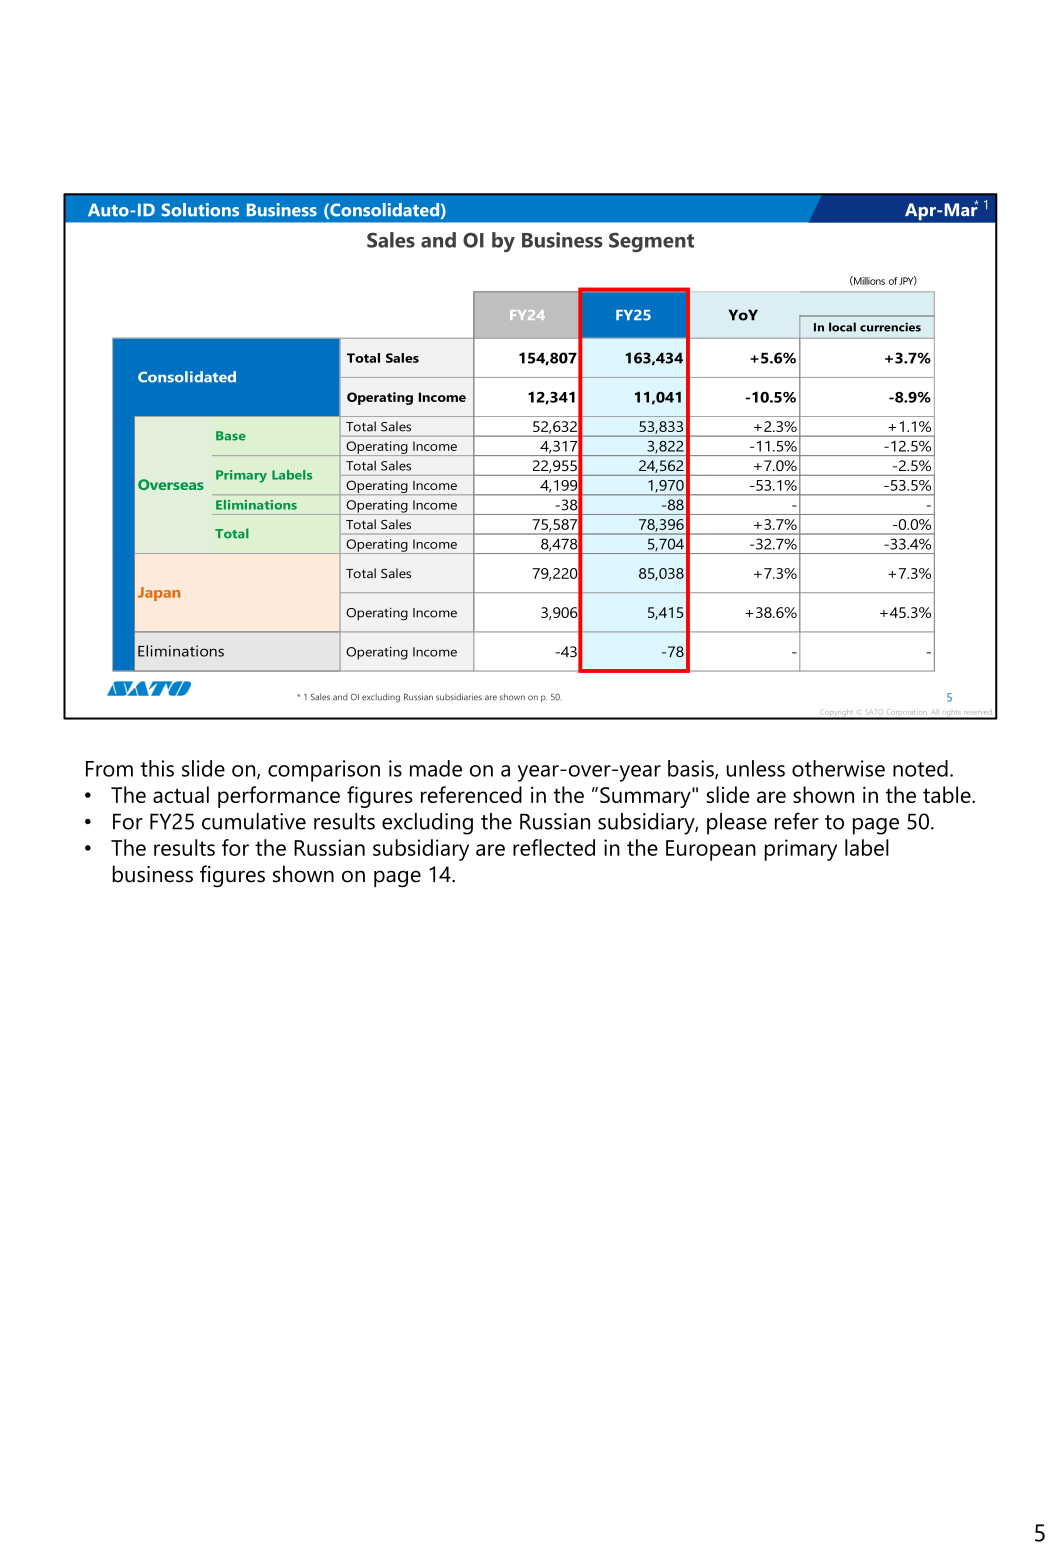
Segment Results
By business segment, the Japan business grew sales 7.3% to 85,038 million yen and operating income 38.6% to 5,415 million yen. Overseas, total sales rose 3.7% to 78,396 million yen but operating income fell 32.7% to 5,704 million yen, as the base business was hurt by bad debt expenses in Asia/Oceania and higher SG&A and other costs in Europe, and the primary labels business was affected by higher costs in Russia.
| Segment (Millions of JPY) | Metric | FY24 | FY25 | YoY | In local currencies |
|---|---|---|---|---|---|
| Overseas — Base | Total Sales | 52,632 | 53,833 | +2.3% | +1.1% |
| Overseas — Base | Operating Income | 4,317 | 3,822 | -11.5% | -12.5% |
| Overseas — Primary Labels | Total Sales | 22,955 | 24,562 | +7.0% | -2.5% |
| Overseas — Primary Labels | Operating Income | 4,199 | 1,970 | -53.1% | -53.5% |
| Overseas — Eliminations | Operating Income | -38 | -88 | – | – |
| Overseas — Total | Total Sales | 75,587 | 78,396 | +3.7% | -0.0% |
| Overseas — Total | Operating Income | 8,478 | 5,704 | -32.7% | -33.4% |
| Japan | Total Sales | 79,220 | 85,038 | +7.3% | +7.3% |
| Japan | Operating Income | 3,906 | 5,415 | +38.6% | +45.3% |
| Eliminations | Operating Income | -43 | -78 | – | – |
| Consolidated | Total Sales | 154,807 | 163,434 | +5.6% | +3.7% |
| Consolidated | Operating Income | 12,341 | 11,041 | -10.5% | -8.9% |
In Japan, mechatronics sales rose 16.3% to 36,769 million yen and consumables sales rose 1.4% to 48,269 million yen. Gross profit increased 7.0% to 38,385 million yen, with the gross profit margin at 45.1% (-0.1pt), and the operating income margin improved 1.4 points to 6.4%. By vertical (April–March), manufacturing sales were 25,159 million yen (+4.6%), logistics 20,583 million yen (+17.4%), retail 12,082 million yen (+5.1%), health care 10,331 million yen (+2.6%) and food & beverage 8,549 million yen (+1.9%).
Overseas Performance by Region
In the base business, the Americas delivered higher operating income on a large Bluetooth Low Energy sensor tag project in retail and solid health care sales, while Europe swung to an operating loss on higher personnel costs amid inflation and upfront investments to enhance regional headquarters functions. Asia/Oceania saw operating income fall on bad debt expenses recorded at a sales subsidiary in Southeast Asia. In the primary labels business, Europe (Okil/X-pack in Russia) saw operating income drop 61.7% on higher personnel costs and production capacity investment, while the Americas (Achernar in Argentina, Plakorar in Brazil) grew sales 8.2%.
| Region / Business (Millions of JPY) | Metric | FY24 | FY25 | YoY | In local currencies |
|---|---|---|---|---|---|
| Base business — The Americas | Total Sales | 18,135 | 18,037 | -0.5% | +1.4% |
| Base business — The Americas | Operating Income | 376 | 508 | +35.2% | +42.5% |
| Base business — Europe | Total Sales | 12,478 | 13,360 | +7.1% | +1.0% |
| Base business — Europe | Operating Income | 410 | 214 | -47.8% | -51.2% |
| Base business — Asia/Oceania | Total Sales | 22,018 | 22,435 | +1.9% | +0.9% |
| Base business — Asia/Oceania | Operating Income | 3,530 | 3,099 | -12.2% | -13.8% |
| Primary Labels — The Americas | Total Sales | 3,475 | 3,759 | +8.2% | +22.3% |
| Primary Labels — The Americas | Operating Income | 631 | 595 | -5.7% | +19.5% |
| Primary Labels — Europe | Total Sales | 19,094 | 20,398 | +6.8% | -7.3% |
| Primary Labels — Europe | Operating Income | 3,525 | 1,351 | -61.7% | -66.7% |
| Primary Labels — Asia/Oceania | Total Sales | 384 | 405 | +5.3% | +8.9% |
| Primary Labels — Asia/Oceania | Operating Income | 41 | 23 | -44.9% | -43.1% |
The deck also discloses results excluding the Russian subsidiaries. On that basis, FY 2025 net sales were 143,036 million yen (+5.4%) and operating income 9,599 million yen (+10.9%), with an operating income margin of 6.7% (+0.3pt), ordinary income of 9,012 million yen (+15.8%) and profit attributable to owners of parent of 4,626 million yen (-10.7%).
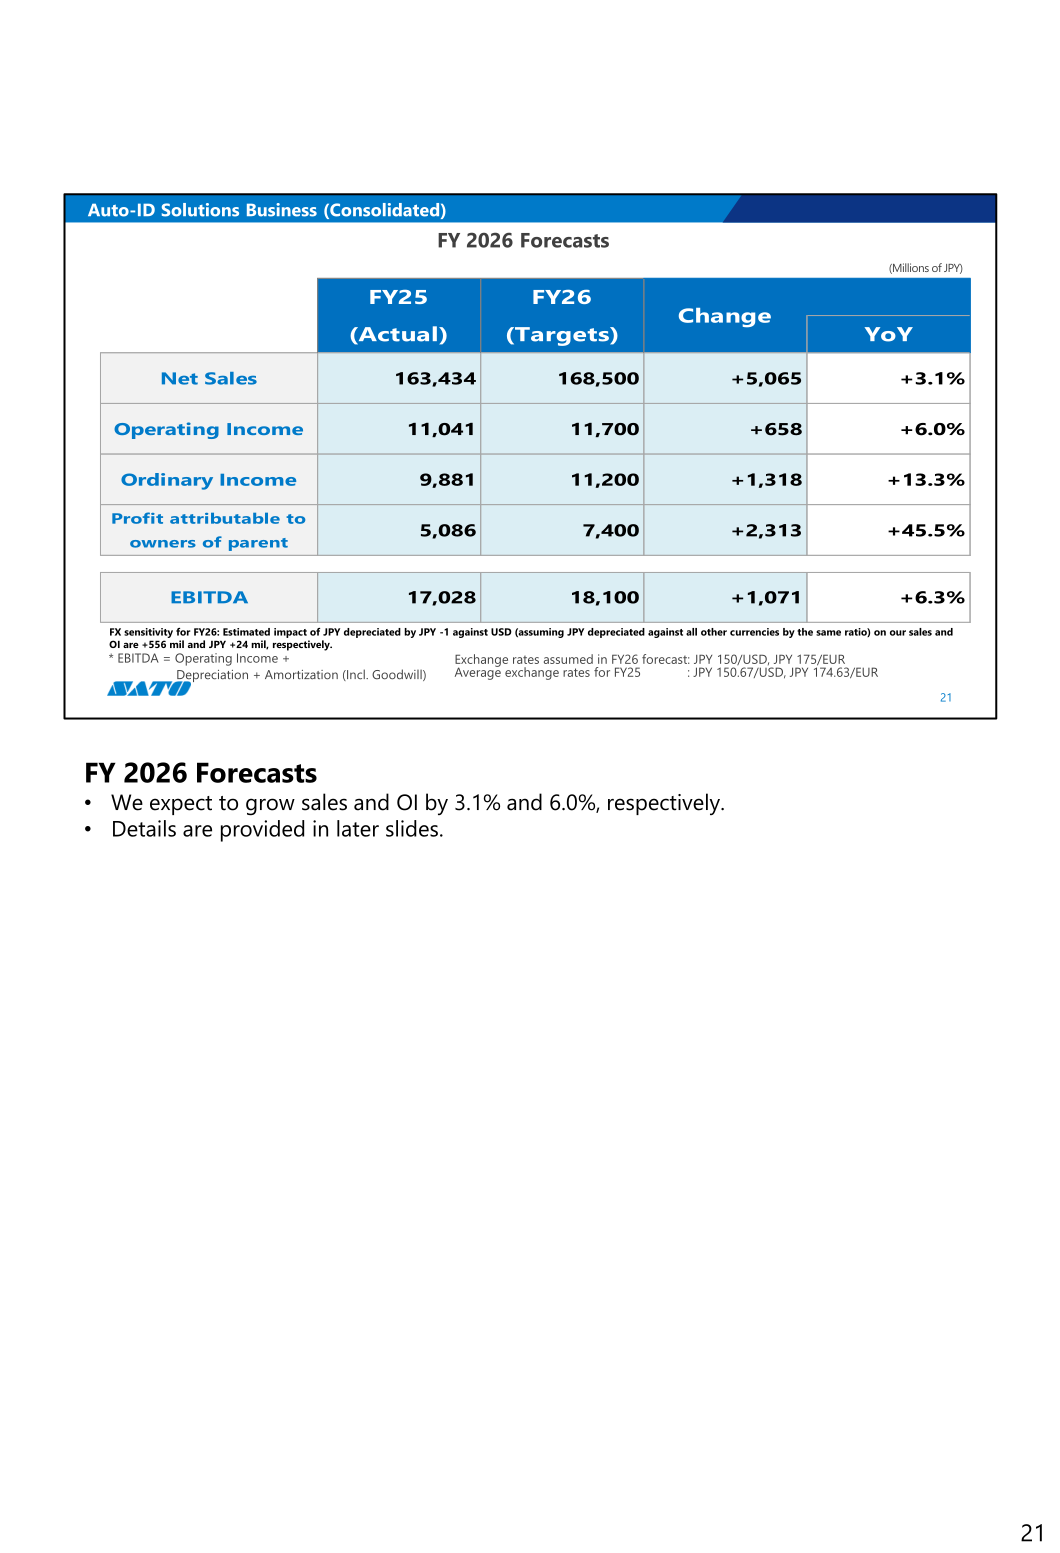
FY 2026 Forecast
For FY 2026 the company expects sales and operating income to grow 3.1% and 6.0% respectively. Exchange rates assumed in the FY 2026 forecast are JPY 150/USD and JPY 175/EUR. The company notes that the forecast does not factor in the possible impact of geopolitical situations in the Middle East, as making reasonable assumptions and calculations for such situations is difficult.
| Item (Millions of JPY) | FY25 (Actual) | FY26 (Targets) | Change | YoY |
|---|---|---|---|---|
| Net Sales | 163,434 | 168,500 | +5,065 | +3.1% |
| Operating Income | 11,041 | 11,700 | +658 | +6.0% |
| Ordinary Income | 9,881 | 11,200 | +1,318 | +13.3% |
| Profit attributable to owners of parent | 5,086 | 7,400 | +2,313 | +45.5% |
| EBITDA | 17,028 | 18,100 | +1,071 | +6.3% |
| Segment (Millions of JPY) | Metric | FY25 (Actual) | FY26 (Targets) | YoY |
|---|---|---|---|---|
| Overseas (Base business) | Total Sales | 53,833 | 57,400 | +6.6% |
| Overseas (Base business) | Operating Income | 3,822 | 4,300 | +12.5% |
| Overseas (Primary business) | Total Sales | 24,562 | 24,600 | +0.2% |
| Overseas (Primary business) | Operating Income | 1,970 | 1,900 | -3.6% |
| Overseas (Eliminations) | Operating Income | -88 | 0 | – |
| Overseas | Total Sales | 78,396 | 82,000 | +4.6% |
| Overseas | Operating Income | 5,704 | 6,200 | +8.7% |
| Japan | Total Sales | 85,038 | 86,500 | +1.7% |
| Japan | Operating Income | 5,415 | 5,500 | +1.6% |
| Eliminations | Operating Income | -78 | 0 | – |
| Consolidated | Total Sales | 163,434 | 168,500 | +3.1% |
| Consolidated | Operating Income | 11,041 | 11,700 | +6.0% |
The company states that consolidated operating income would surpass 11 billion yen excluding the impact of strategic investments and the Russian subsidiaries, and that even with strategic investments of one billion yen factored in — and the impact of Russian subsidiaries left out — it expects operating income of 10.2 billion yen, a record high. The overseas base business is to grow sales and operating income on deepened engagement with key accounts; the overseas primary labels business is to deliver performance on a par with FY 2025, as the unfavorable impact from the normalized competitive environment in Russia is offset by enhanced/increased production capacity; and the Japan business is to deliver higher sales and operating income on solid demand for efficiency gains and expanded sales of the new printers.
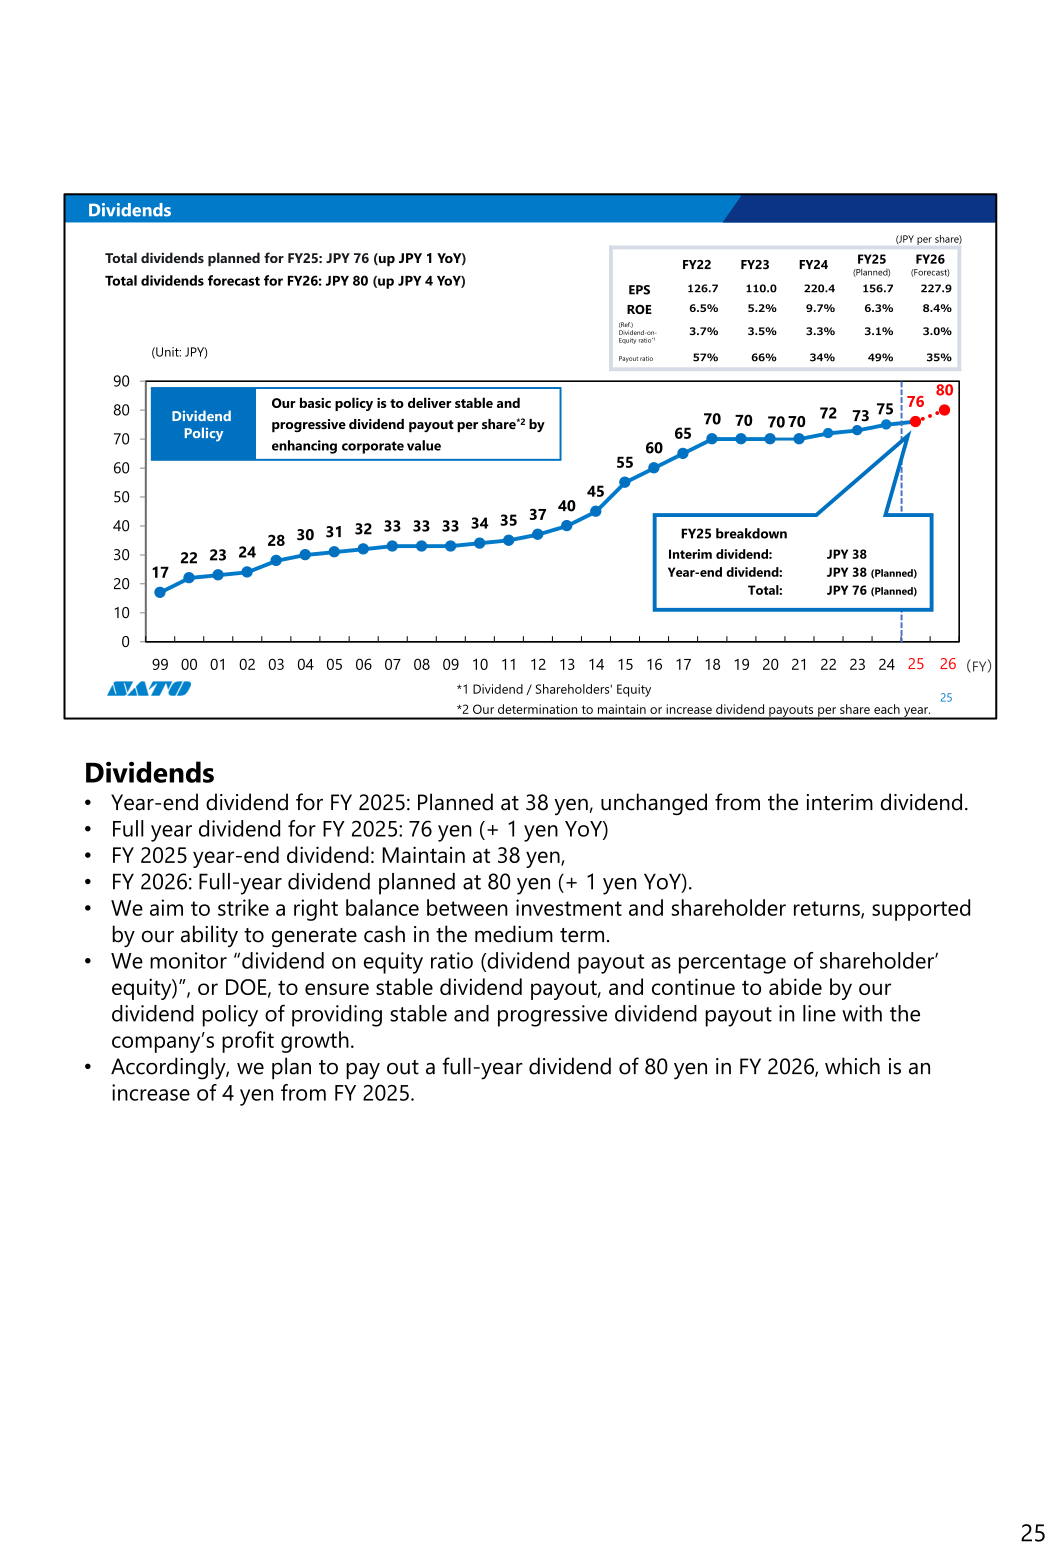
Shareholder Returns
The year-end dividend for FY 2025 is planned at 38 yen, unchanged from the interim dividend of 38 yen, for a full-year dividend of 76 yen (up 1 yen year on year). For FY 2026 the company forecasts a full-year dividend of 80 yen, an increase of 4 yen from FY 2025. SATO’s basic policy is to deliver a stable and progressive dividend payout per share by enhancing corporate value, and it monitors the dividend-on-equity ratio (dividend payout as a percentage of shareholders’ equity), or DOE, to ensure stable dividend payout.
| Item | FY22 | FY23 | FY24 | FY25 (Planned) | FY26 (Forecast) |
|---|---|---|---|---|---|
| EPS (JPY) | 126.7 | 110.0 | 220.4 | 156.7 | 227.9 |
| ROE | 6.5% | 5.2% | 9.7% | 6.3% | 8.4% |
| Dividend-on-Equity ratio | 3.7% | 3.5% | 3.3% | 3.1% | 3.0% |
| Payout ratio | 57% | 66% | 34% | 49% | 35% |
Medium-Term Management Plan
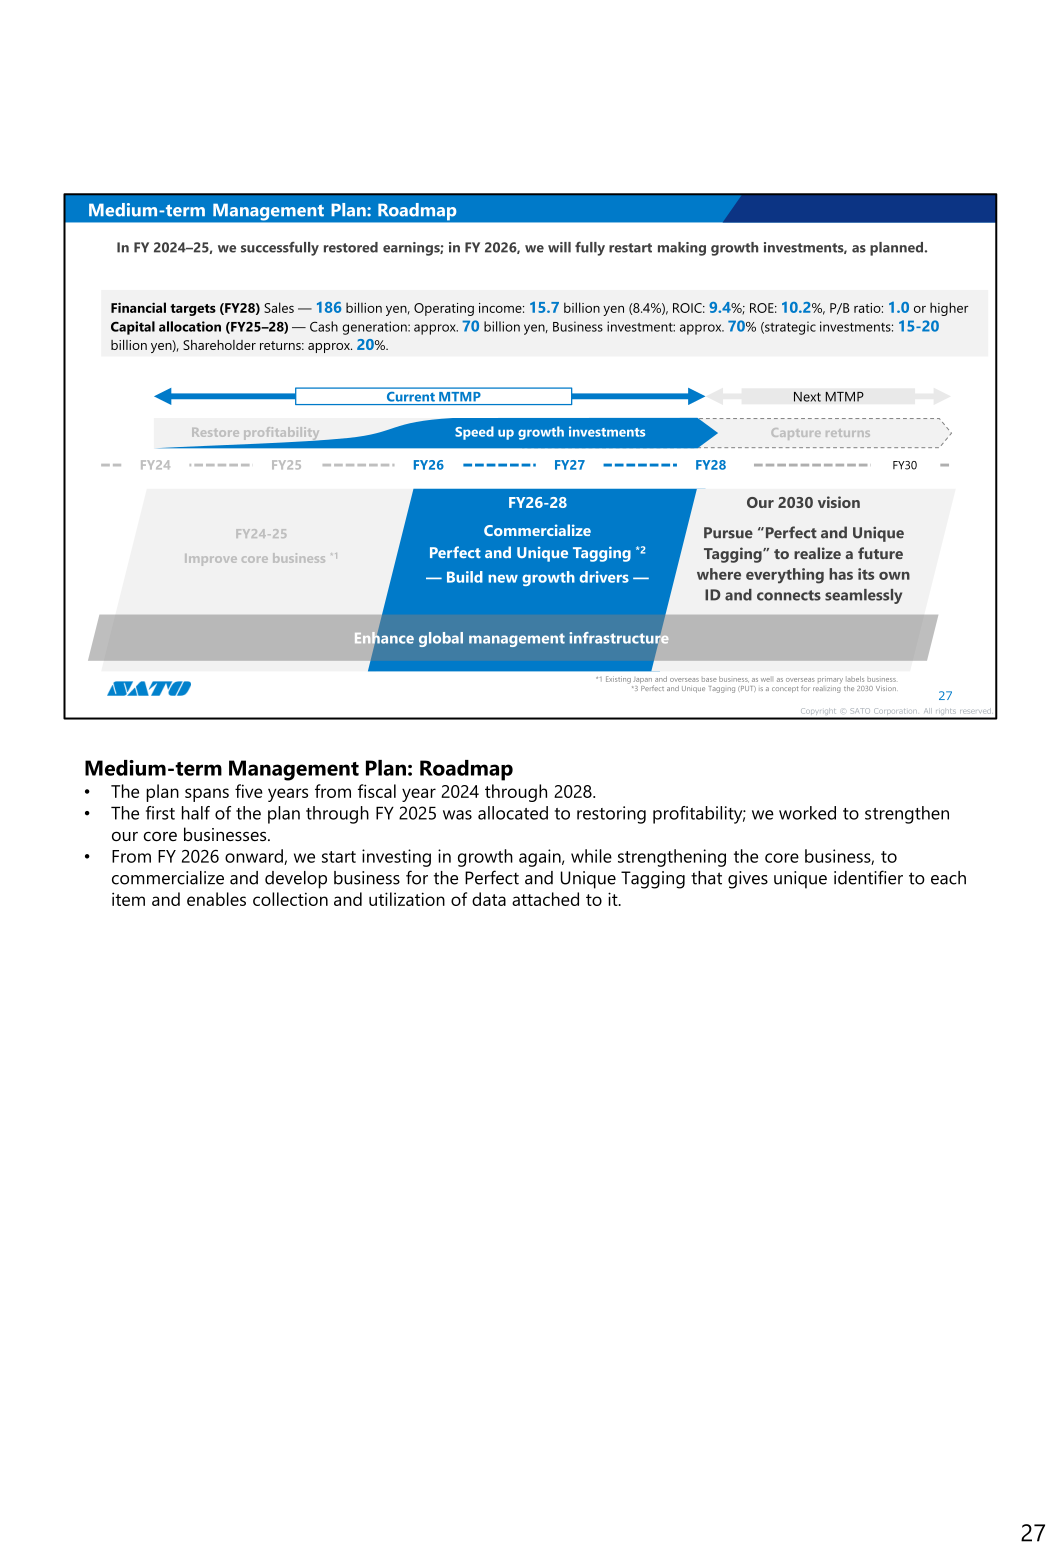
The current medium-term management plan spans five years from fiscal year 2024 through 2028. The first half through FY 2025 was allocated to restoring profitability by strengthening the core businesses; from FY 2026 onward the company will restart growth investments while strengthening the core business, in order to commercialize and develop business for “Perfect and Unique Tagging” (PUT), a concept that gives a unique identifier to each item and enables collection and utilization of the data attached to it.
Financial targets for FY 2028 are sales of 186 billion yen, operating income of 15.7 billion yen (8.4%), ROIC of 9.4%, ROE of 10.2% and a P/B ratio of 1.0 or higher. Capital allocation for FY 2025–28 assumes cash generation of approximately 70 billion yen, with approximately 70% allocated to business investment (including strategic investments of 15–20 billion yen) and approximately 20% to shareholder returns. The company aims to grow PUT business sales to 35 billion yen by the end of FY 2030, and expects its focused domains to contribute 3.6 percentage points of consolidated sales growth from FY 2025 through 2030.
FY 2025 initiatives included launching a new flagship printer equipped with a common platform, merging the holding company and the core operating company, overhauling the personnel system in Japan, enhancing the financial governance structure, establishing a company-wide cybersecurity organizational structure, and launching a materials traceability system for the circular economy. For FY 2026, the company plans to improve the consolidated operating margin by 0.8 percentage point excluding strategic investments (+0.2 point including them).
This article is an analysis based on publicly available information and is not a recommendation to buy or sell any specific securities. Investment decisions are your own responsibility.
![[Obayashi] Investors’ Guide 2026 — The Complete 24-Article Breakdown](https://japan-equity.com/wp-content/uploads/2026/07/hub_cover-1024x1024.png)
![[Obayashi] IR & SR Policy — Feeding Dialogue Back into Management](https://japan-equity.com/wp-content/uploads/2026/07/p32_sq-1024x1024.jpg)
![[Obayashi] Domestic Civil Engineering — Resilience Spending Supports 9.6% Margin](https://japan-equity.com/wp-content/uploads/2026/07/p11_sq-1024x1024.jpg)
![[Obayashi] Overseas Construction — Orders Reach ¥1.2tn](https://japan-equity.com/wp-content/uploads/2026/07/p15_sq-1024x1024.jpg)
![[Obayashi] Share Price & External Ratings — vs TOPIX, ESG Index Inclusion](https://japan-equity.com/wp-content/uploads/2026/07/p40_sq-1024x1024.jpg)
![[Construction] ¥75.5tn Investment, Shrinking Workforce — Big-5 Market Share](https://japan-equity.com/wp-content/uploads/2026/07/p12_sq-1024x1024.jpg)



![[Obayashi] Capital Policy & Shareholder Returns — ROE 10%+, DOE ~5%, ¥100bn Buyback](https://japan-equity.com/wp-content/uploads/2026/07/p27_sq-1024x1024.jpg)
![[Obayashi] Reducing Cross-Shareholdings — ¥285.2bn Sold in Five Years](https://japan-equity.com/wp-content/uploads/2026/07/p29_sq-1024x1024.jpg)
![[Obayashi] ¥750bn Investment Plan — ¥300bn to Development, ¥190bn to Tech/DX](https://japan-equity.com/wp-content/uploads/2026/07/p30_sq-1024x1024.jpg)
![[Obayashi] MTP2022 KPIs — Operating Profit ~2x Target, ROE 14.4%](https://japan-equity.com/wp-content/uploads/2026/07/p25_sq-1024x1024.jpg)
![[Obayashi] Cash Allocation — ¥420bn Investment CF Over Five Years](https://japan-equity.com/wp-content/uploads/2026/07/p26_sq-1024x1024.jpg)
![[Obayashi] Green Energy — 44 Plants, 344MW, and the Green Hydrogen Challenge](https://japan-equity.com/wp-content/uploads/2026/07/p21_sq-1024x1024.jpg)
![[Obayashi] Tackling the Labor Shortage — Robotics Construction®](https://japan-equity.com/wp-content/uploads/2026/07/p14_sq-1024x1024.jpg)
