
This article is based on publicly available IR materials and is not a recommendation to buy or sell any specific securities.
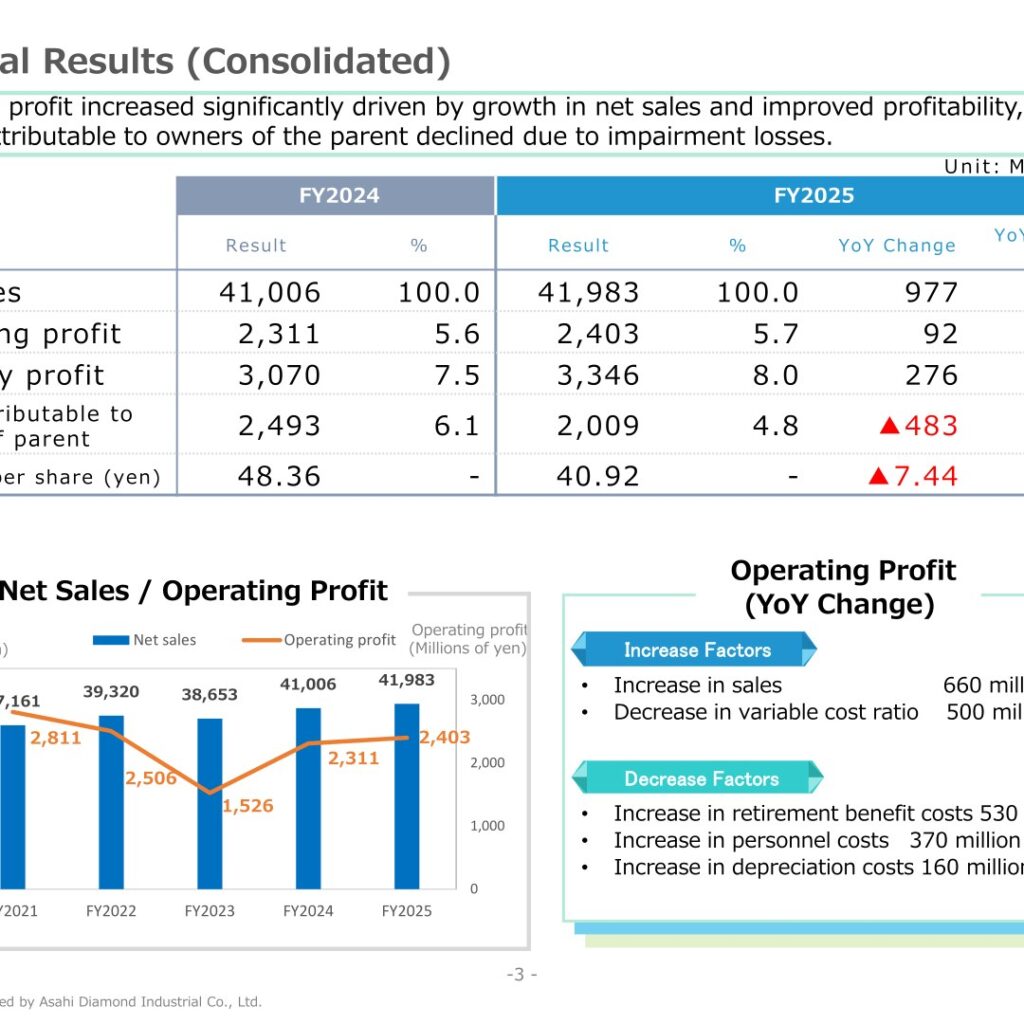
Asahi Diamond Industrial reported FY2025 net sales of 41,983 million yen, up 977 million yen or 2.4% year on year, and operating profit of 2,403 million yen, up 92 million yen or 4.0%. Ordinary profit rose 276 million yen or 9.0% to 3,346 million yen, while profit attributable to owners of parent fell 483 million yen or 19.4% to 2,009 million yen, which the materials attribute to impairment losses. For FY2026 the company forecasts net sales of 44,000 million yen and operating profit of 3,700 million yen, an increase of 54.0%. Note on year labels: the presentation is titled “Fiscal Year Ending March 2026” and labels that year FY2025 in its tables; the following year is labeled FY2026.
Consolidated Results (Full-Year Actual)
The headline message on the results slide is that operating profit increased significantly driven by growth in net sales and improved profitability, while net income attributable to owners of the parent declined due to impairment losses. The operating margin edged up from 5.6% to 5.7% and the ordinary profit margin from 7.5% to 8.0%, while the margin on profit attributable to owners of parent fell from 6.1% to 4.8%. Earnings per share declined by 7.44 yen to 40.92 yen.
| Item | FY2024 | FY2025 | YoY Change | YoY Change (%) |
|---|---|---|---|---|
| Net sales | 41,006 | 41,983 | 977 | 2.4 |
| Operating profit | 2,311 | 2,403 | 92 | 4.0 |
| Ordinary profit | 3,070 | 3,346 | 276 | 9.0 |
| Profit attributable to owners of parent | 2,493 | 2,009 | ▲483 | ▲19.4 |
| Earnings per share (yen) | 48.36 | 40.92 | ▲7.44 | – |
The bridge for the year-on-year change in operating profit lists as increase factors an increase in sales of 660 million yen and a decrease in the variable cost ratio of 500 million yen, and as decrease factors an increase in retirement benefit costs of 530 million yen, an increase in personnel costs of 370 million yen and an increase in depreciation costs of 160 million yen.
By quarter, net sales rose gradually from 10,026 million yen in 1Q to 10,452 million yen in 2Q, 10,542 million yen in 3Q and 10,962 million yen in 4Q. Quarterly operating profit was 585, 407, 817 and 593 million yen, with operating margins of 5.8%, 3.9%, 7.8% and 5.4%. Profit attributable to owners of parent was 838 million yen in 1Q, 680 million yen in 2Q and 1,631 million yen in 3Q, followed by a loss of 1,141 million yen in 4Q. The company states that net sales increased gradually while operating profit fluctuated due to the impact of work-in-progress and product inventories but showed an overall improving trend.
Net Sales by Industry
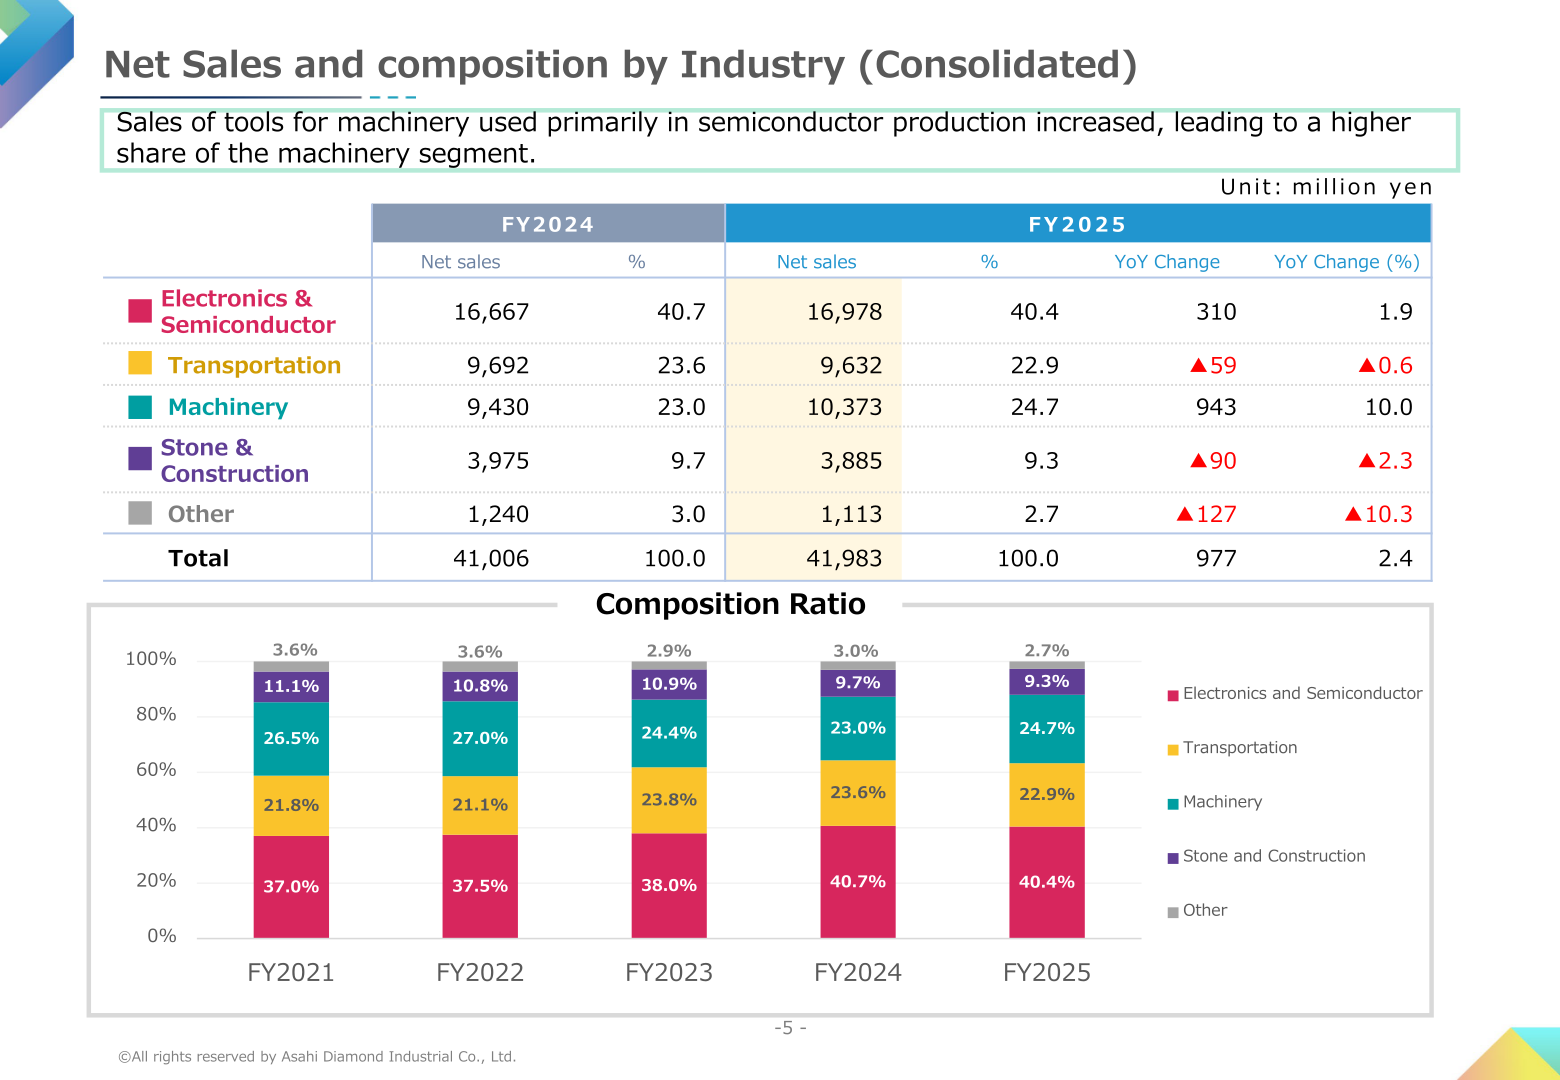
Sales of tools for machinery used primarily in semiconductor production increased, leading to a higher share of the machinery segment. Machinery grew 10.0% and Electronics & Semiconductor 1.9%, while Transportation, Stone & Construction and Other declined.
| Industry | FY2024 | FY2025 | YoY Change | YoY Change (%) |
|---|---|---|---|---|
| Electronics & Semiconductor | 16,667 | 16,978 | 310 | 1.9 |
| Transportation | 9,692 | 9,632 | ▲59 | ▲0.6 |
| Machinery | 9,430 | 10,373 | 943 | 10.0 |
| Stone & Construction | 3,975 | 3,885 | ▲90 | ▲2.3 |
| Other | 1,240 | 1,113 | ▲127 | ▲10.3 |
| Total | 41,006 | 41,983 | 977 | 2.4 |
Within Electronics & Semiconductor, the materials state that although demand for SiC semiconductor applications declined, sales increased driven by stronger demand for advanced semiconductor processing tools; FPD sales were largely in line with the previous period; wire drawing sales declined significantly due to a substantial decrease in products for specialty wire applications; and electroplated diamond wire sales for glass processing applications increased. In Transportation, automotive sales increased in India but decreased in Europe and North America sales declined slightly, while aircraft sales increased due to rising demand. In Machinery, sales of bearings and cemented carbide tools increased supported by demand from electronics and semiconductor applications, and machine tool sales increased mainly driven by semiconductor equipment applications. In Stone & Construction, resource exploration sales declined due to a decrease in overseas orders, domestic construction declined slightly due to a decrease in large-scale project demand, and commercial products (portable cutters) were largely in line with the previous period.
Net Sales by Geographical Region
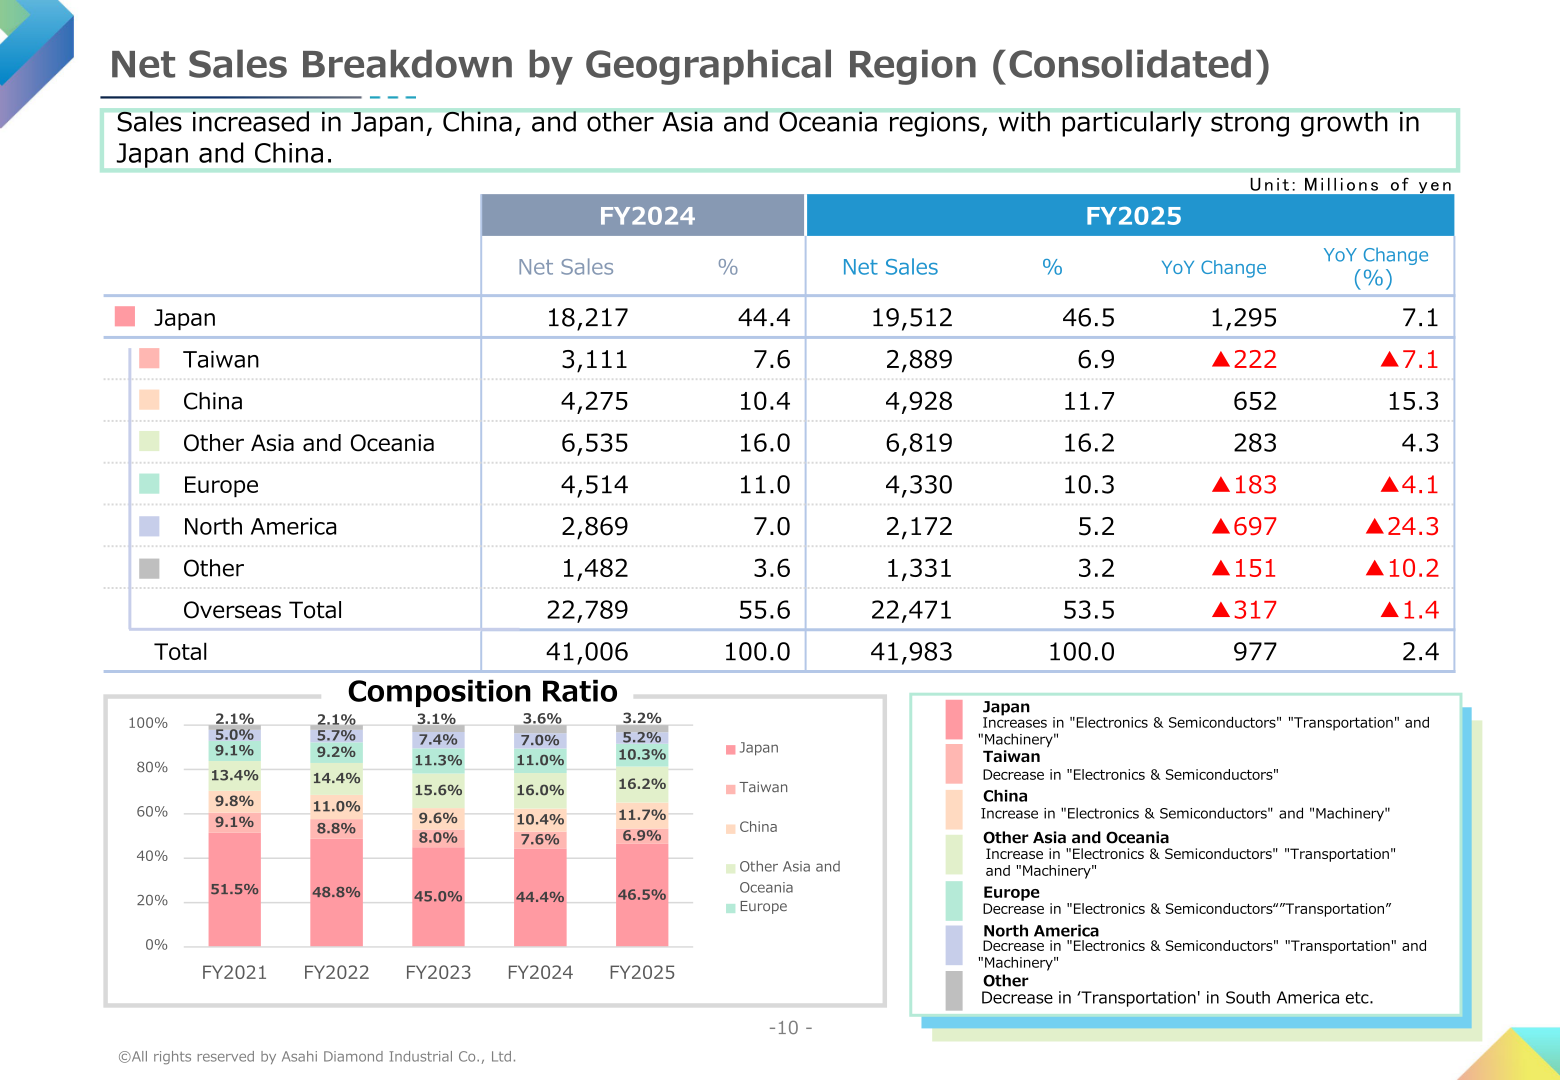
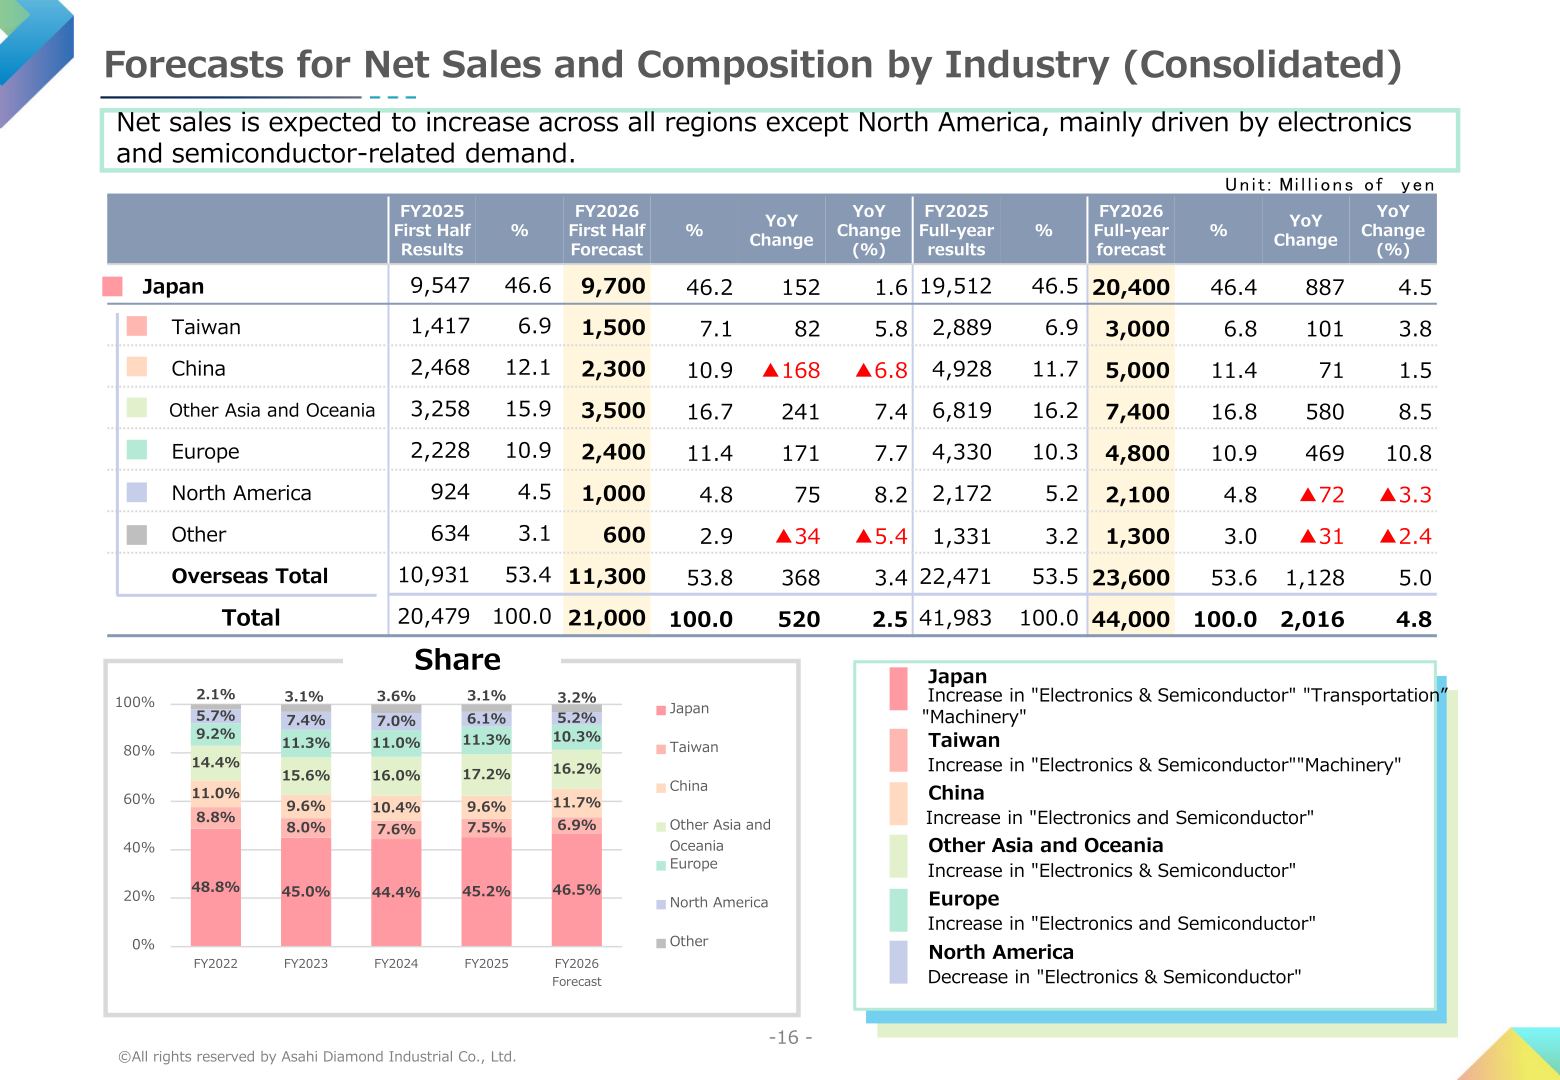
Sales increased in Japan, China, and other Asia and Oceania regions, with particularly strong growth in Japan and China. Overseas sales totaled 22,471 million yen, down 1.4%, and the overseas share fell from 55.6% to 53.5%. The company cites increases in Electronics & Semiconductors, Transportation and Machinery in Japan, increases in Electronics & Semiconductors and Machinery in China, and decreases in Electronics & Semiconductors, Transportation and Machinery in North America.
| Region | FY2024 | FY2025 | YoY Change | YoY Change (%) |
|---|---|---|---|---|
| Japan | 18,217 | 19,512 | 1,295 | 7.1 |
| Taiwan | 3,111 | 2,889 | ▲222 | ▲7.1 |
| China | 4,275 | 4,928 | 652 | 15.3 |
| Other Asia and Oceania | 6,535 | 6,819 | 283 | 4.3 |
| Europe | 4,514 | 4,330 | ▲183 | ▲4.1 |
| North America | 2,869 | 2,172 | ▲697 | ▲24.3 |
| Other | 1,482 | 1,331 | ▲151 | ▲10.2 |
| Overseas Total | 22,789 | 22,471 | ▲317 | ▲1.4 |
| Total | 41,006 | 41,983 | 977 | 2.4 |
Balance Sheet and Cash Flows
Total assets stood at 79,203 million yen at the end of the fiscal year ending March 2026, up 2,852 million yen from a year earlier. Cash and deposits rose 1,324 million yen to 16,077 million yen and investment securities rose 2,473 million yen to 13,252 million yen, while property, plant and equipment fell 2,402 million yen to 26,443 million yen. The company explains that cash and deposits increased due to the sale of investment securities and long-term borrowings, while tangible fixed assets decreased as a result of impairment losses. Total liabilities were 15,070 million yen (up 2,298 million yen), including long-term borrowings of 4,500 million yen, and total net assets were 64,133 million yen (up 554 million yen).
Net cash provided by operating activities was 5,412 million yen (down 353 million yen), including an impairment of 1,920 million yen. Net cash used in investing activities was 2,120 million yen, and net cash used in financing activities was 1,883 million yen, which included proceeds from long-term borrowings of 2,500 million yen, purchase or sale of treasury shares of ▲2,489 million yen and dividends paid of ▲1,511 million yen. Cash and cash equivalents at the end of the period were 16,156 million yen, up 1,346 million yen.
FY2026 Forecast
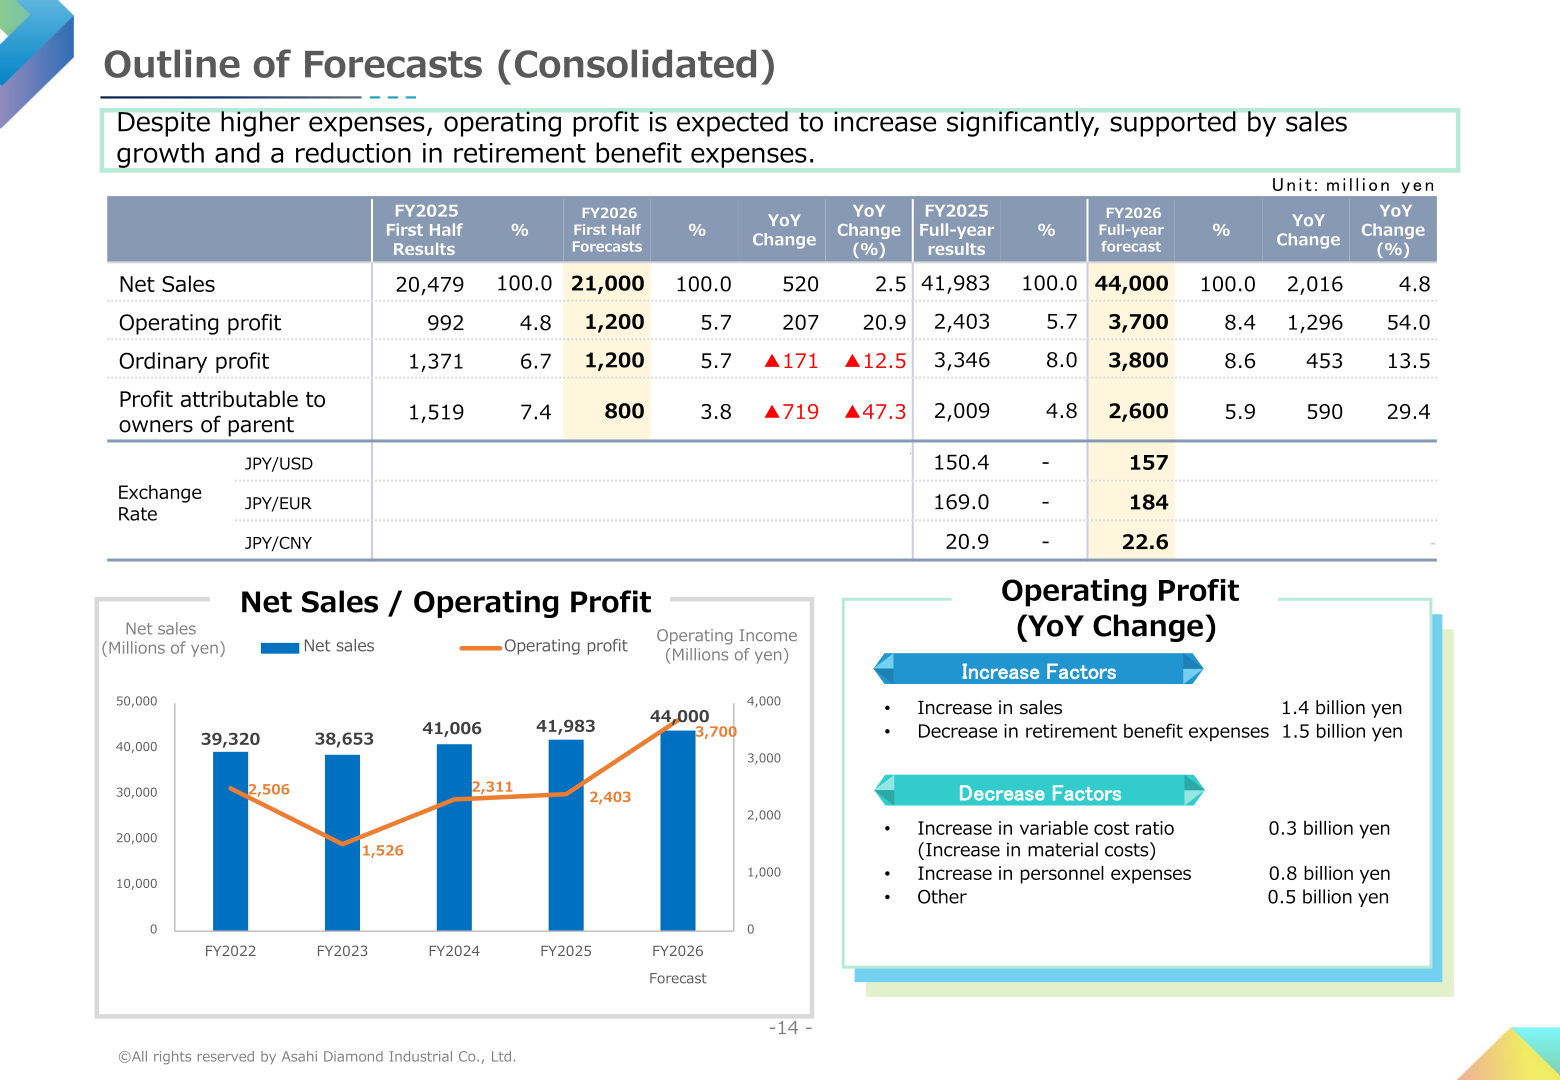
The company guides for net sales of 44,000 million yen (up 4.8%), operating profit of 3,700 million yen (up 54.0%), ordinary profit of 3,800 million yen (up 13.5%) and profit attributable to owners of parent of 2,600 million yen (up 29.4%). The comment on the slide is that despite higher expenses, operating profit is expected to increase significantly, supported by sales growth and a reduction in retirement benefit expenses. The bridge lists increase factors of an increase in sales of 1.4 billion yen and a decrease in retirement benefit expenses of 1.5 billion yen, against decrease factors of an increase in the variable cost ratio of 0.3 billion yen (increase in material costs), an increase in personnel expenses of 0.8 billion yen and other of 0.5 billion yen. For the first half of FY2026 the company forecasts net sales of 21,000 million yen, operating profit of 1,200 million yen, ordinary profit of 1,200 million yen and profit attributable to owners of parent of 800 million yen.
| Item | FY2025 Full-year results | FY2026 Full-year forecast | YoY Change | YoY Change (%) |
|---|---|---|---|---|
| Net sales | 41,983 | 44,000 | 2,016 | 4.8 |
| Operating profit | 2,403 | 3,700 | 1,296 | 54.0 |
| Ordinary profit | 3,346 | 3,800 | 453 | 13.5 |
| Profit attributable to owners of parent | 2,009 | 2,600 | 590 | 29.4 |
| Exchange rate JPY/USD | 150.4 | 157 | – | – |
| Exchange rate JPY/EUR | 169.0 | 184 | – | – |
| Exchange rate JPY/CNY | 20.9 | 22.6 | – | – |
By industry, net sales are expected to increase, driven by solid electronics and semiconductor and machinery businesses and expanded sales of transportation equipment. Growth is expected in Electronics and Semiconductor primarily in semiconductor and electronic components, in Transportation Equipment primarily for aircraft and automobiles, and in Machinery primarily for bearings and cemented carbide tools, while Stone and Construction is projected to decline primarily in resource exploration and construction.
| Industry | FY2026 Full-year Forecast | % | YoY Change | YoY Change (%) |
|---|---|---|---|---|
| Electronics & Semiconductor | 18,300 | 41.6 | 1,321 | 7.8 |
| Transportation | 10,100 | 23.0 | 467 | 4.9 |
| Machinery | 11,000 | 25.0 | 626 | 6.0 |
| Stone & Construction | 3,700 | 8.4 | ▲185 | ▲4.8 |
| Other | 900 | 2.0 | ▲213 | ▲19.2 |
| Total | 44,000 | 100.0 | 2,016 | 4.8 |
By region, net sales are expected to increase across all regions except North America, mainly driven by electronics and semiconductor-related demand. The full-year forecast is Japan 20,400 million yen, Taiwan 3,000 million yen, China 5,000 million yen, Other Asia and Oceania 7,400 million yen, Europe 4,800 million yen, North America 2,100 million yen and Other 1,300 million yen, for an overseas total of 23,600 million yen (up 5.0%).
Capital Expenditure
Capital expenditure was 2,726 million yen in FY2025 and is planned at 3,000 million yen in FY2026, after 4,998 million yen in FY2023 and 5,298 million yen in FY2024. Depreciation was 3,414 million yen in FY2025 and is planned at 3,500 million yen in FY2026. The company explains that capital expenditures increased in FY2023 and FY2024, reflecting capacity expansion for electronics and semiconductor tools and production restructuring, and that no significant investments are planned for FY2026, in line with FY2025.
Shareholder Returns
The presentation does not include a dedicated shareholder returns slide, and dividends per share and a payout policy cannot be confirmed from the materials. The consolidated statement of cash flows shows dividends paid of 1,511 million yen in FY2025 (1,553 million yen in FY2024) and purchase or sale of treasury shares of ▲2,489 million yen (▲175 million yen in FY2024), and the company notes that cash decreased due to the acquisition of treasury shares but increased as a result of long-term borrowings.
This article is an analysis based on publicly available information and is not a recommendation to buy or sell any specific securities. Investment decisions are your own responsibility.
![[Obayashi] Investors’ Guide 2026 — The Complete 24-Article Breakdown](https://japan-equity.com/wp-content/uploads/2026/07/hub_cover-1024x1024.png)
![[Obayashi] IR & SR Policy — Feeding Dialogue Back into Management](https://japan-equity.com/wp-content/uploads/2026/07/p32_sq-1024x1024.jpg)
![[Obayashi] Real Estate Development — 18.7% Margin, ¥287.7bn Unrealized Gains](https://japan-equity.com/wp-content/uploads/2026/07/p20_sq-1024x1024.jpg)
![[Obayashi] Domestic Civil Engineering — Resilience Spending Supports 9.6% Margin](https://japan-equity.com/wp-content/uploads/2026/07/p11_sq-1024x1024.jpg)
![[Obayashi] Share Price & External Ratings — vs TOPIX, ESG Index Inclusion](https://japan-equity.com/wp-content/uploads/2026/07/p40_sq-1024x1024.jpg)
![[Construction] ¥75.5tn Investment, Shrinking Workforce — Big-5 Market Share](https://japan-equity.com/wp-content/uploads/2026/07/p12_sq-1024x1024.jpg)



![[Obayashi] Capital Policy & Shareholder Returns — ROE 10%+, DOE ~5%, ¥100bn Buyback](https://japan-equity.com/wp-content/uploads/2026/07/p27_sq-1024x1024.jpg)
![[Obayashi] Reducing Cross-Shareholdings — ¥285.2bn Sold in Five Years](https://japan-equity.com/wp-content/uploads/2026/07/p29_sq-1024x1024.jpg)
![[Obayashi] ¥750bn Investment Plan — ¥300bn to Development, ¥190bn to Tech/DX](https://japan-equity.com/wp-content/uploads/2026/07/p30_sq-1024x1024.jpg)
![[Obayashi] MTP2022 KPIs — Operating Profit ~2x Target, ROE 14.4%](https://japan-equity.com/wp-content/uploads/2026/07/p25_sq-1024x1024.jpg)
![[Obayashi] Cash Allocation — ¥420bn Investment CF Over Five Years](https://japan-equity.com/wp-content/uploads/2026/07/p26_sq-1024x1024.jpg)
![[Obayashi] Green Energy — 44 Plants, 344MW, and the Green Hydrogen Challenge](https://japan-equity.com/wp-content/uploads/2026/07/p21_sq-1024x1024.jpg)
![[Obayashi] Tackling the Labor Shortage — Robotics Construction®](https://japan-equity.com/wp-content/uploads/2026/07/p14_sq-1024x1024.jpg)
