
This article is based on publicly available IR materials and is not a recommendation to buy or sell any specific securities.
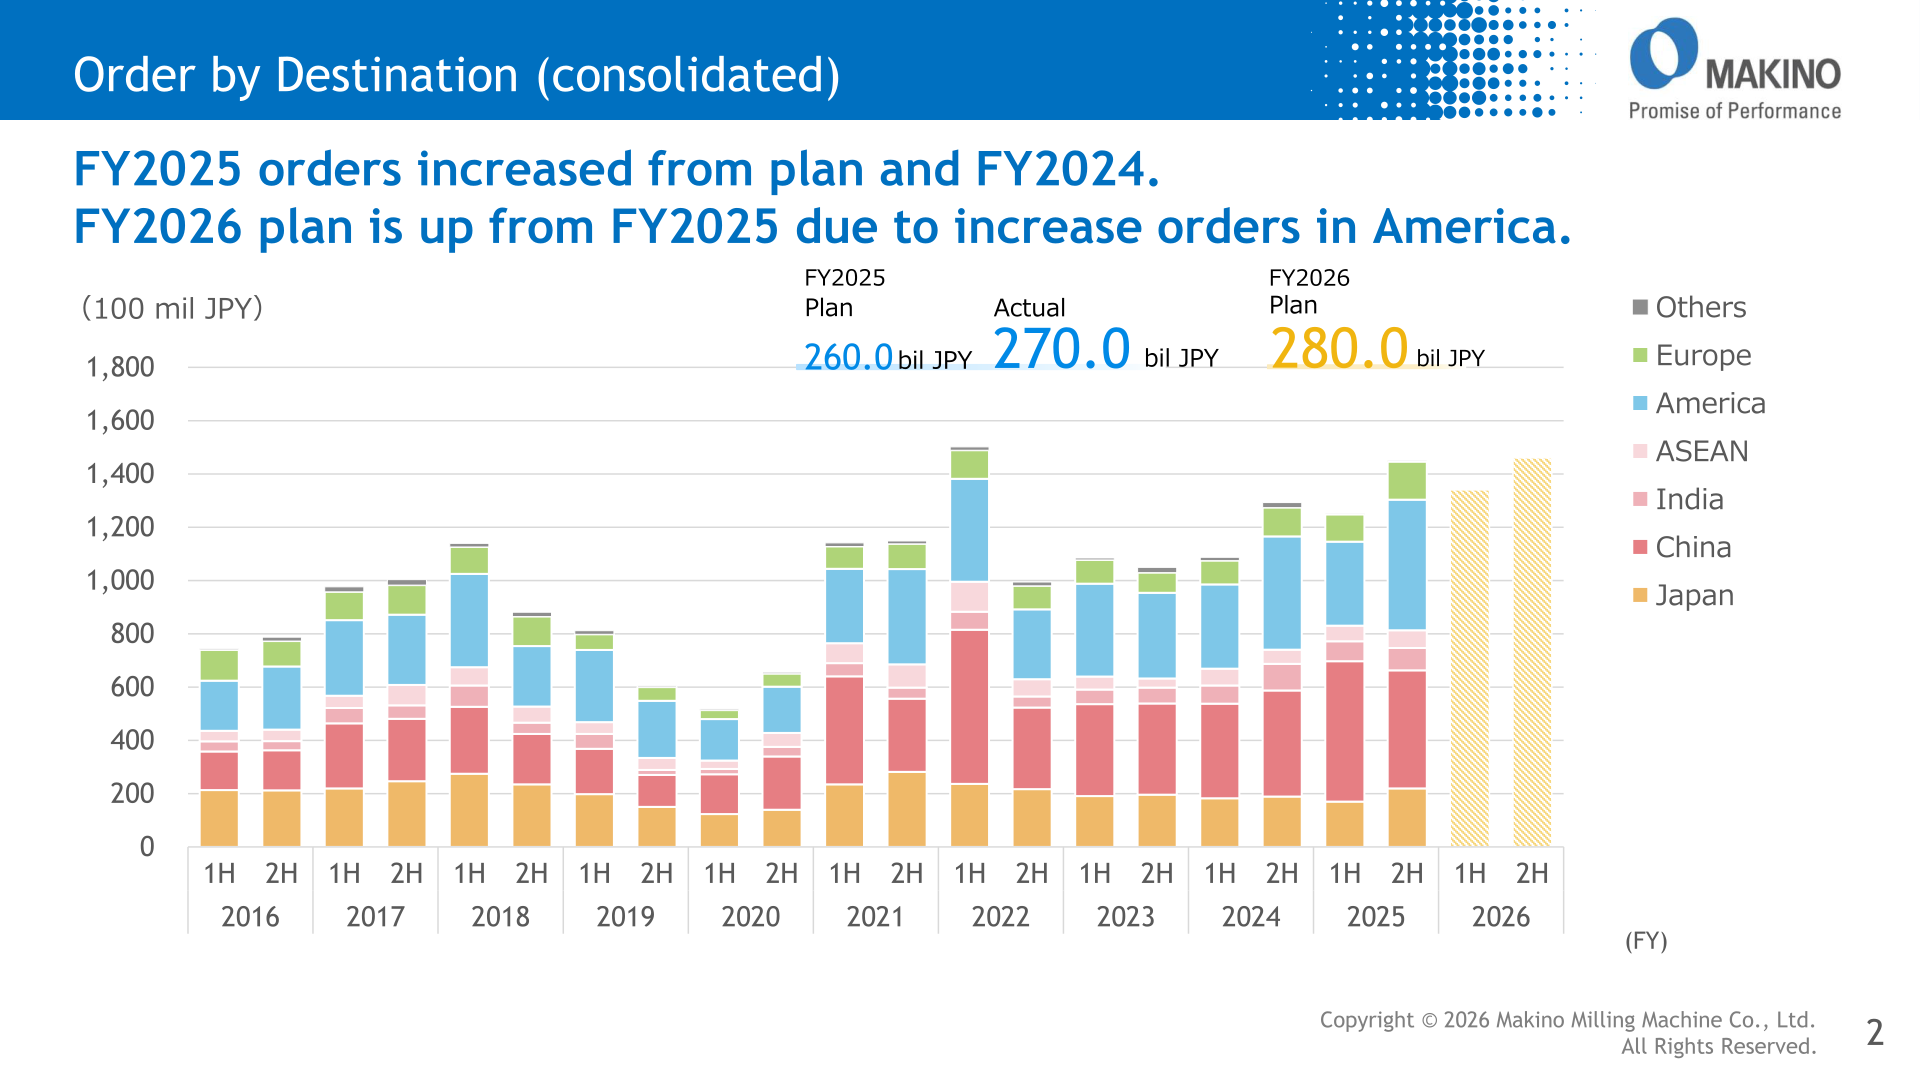
Makino Milling Machine Co., Ltd. released its “Explanatory Material of Group Company for the Fiscal Year Ended March 31, 2026” on April 30, 2026. The company labels this period FY2025. Net sales and operating income both reached record highs, with net sales of 261,184 million yen (up 11.5% year on year) and operating income of 25,035 million yen (up 35.2%). Consolidated orders came in at 270.0 bil JPY, above both the FY2025 plan of 260.0 bil JPY and the prior year, and the company plans 280.0 bil JPY of orders for FY2026.
Consolidated Results (Full-Year Actual)
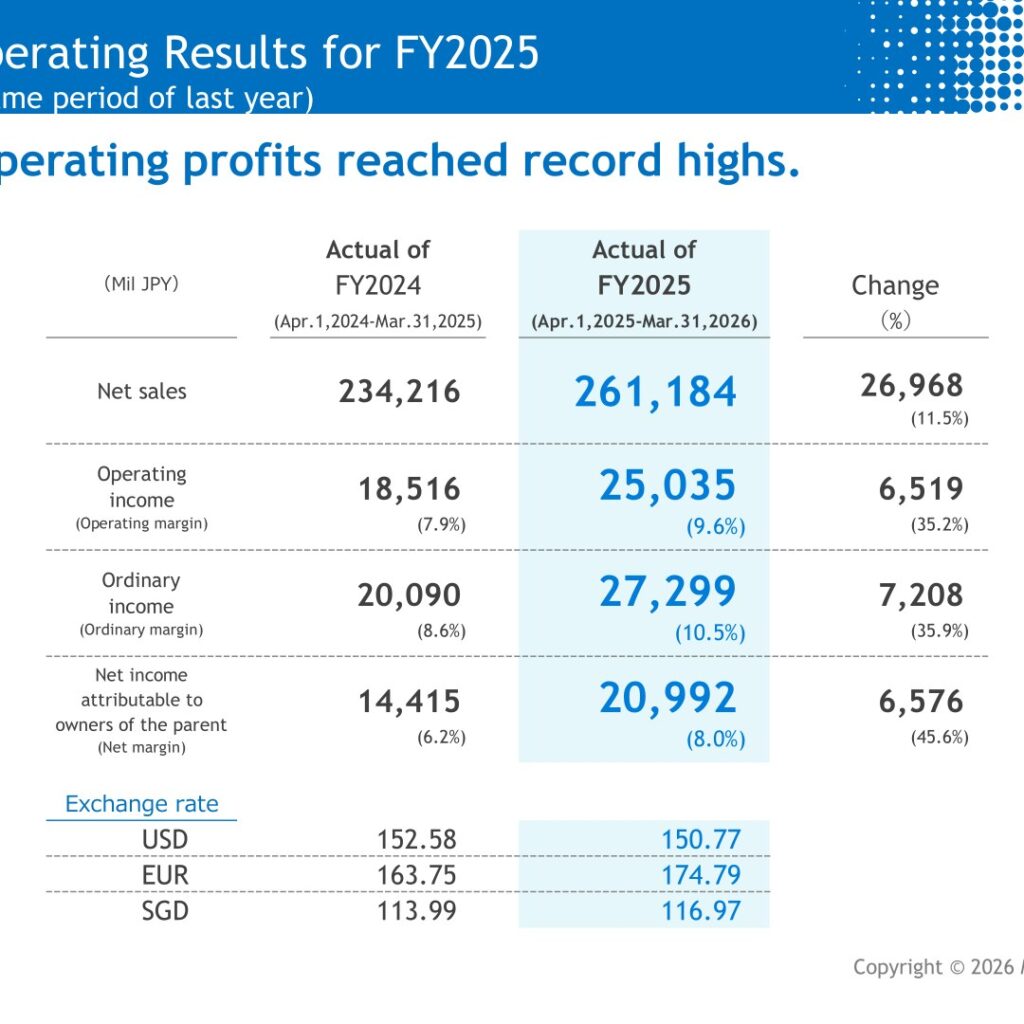
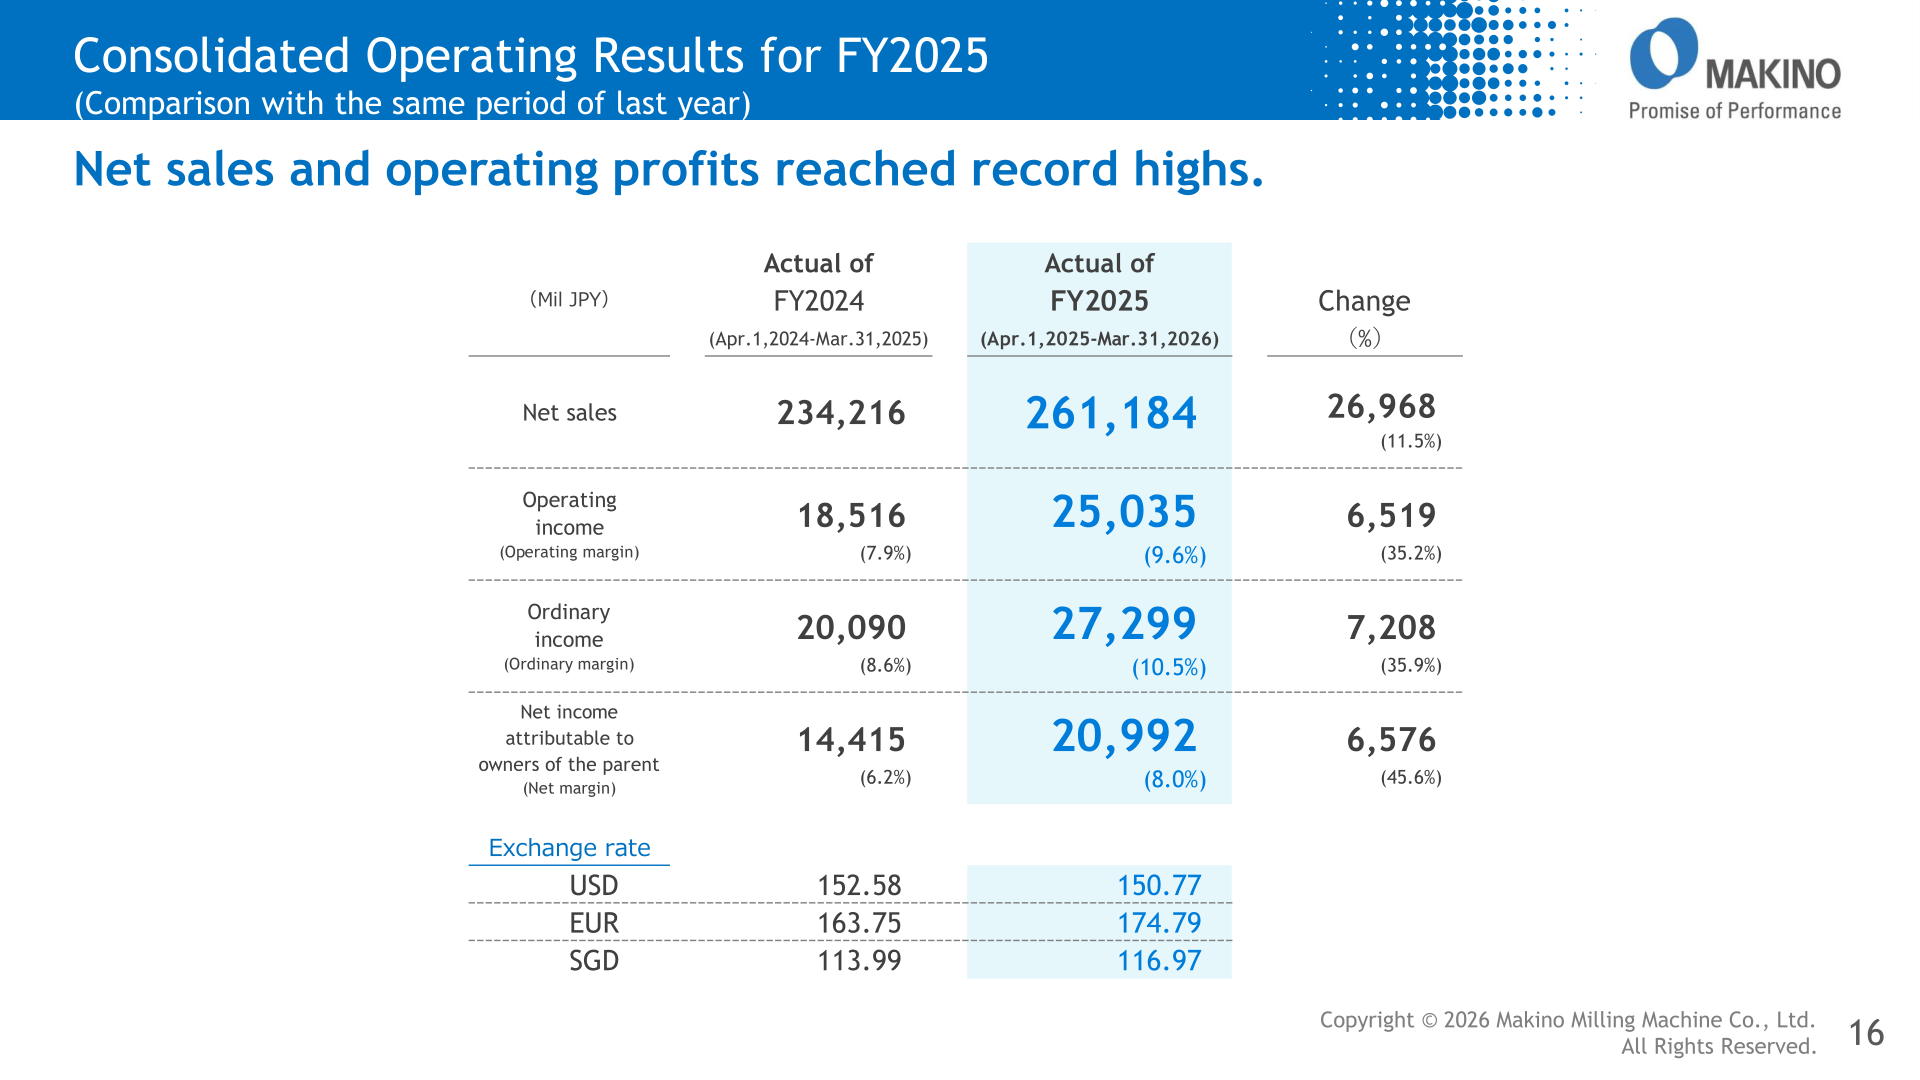
The materials state that “Net sales and operating profits reached record highs.” All four headline lines grew by double digits, and margins expanded at every level: the operating margin rose from 7.9% to 9.6%, the ordinary margin from 8.6% to 10.5%, and the net margin from 6.2% to 8.0%. Average exchange rates for the year were USD 150.77 (versus 152.58), EUR 174.79 (versus 163.75) and SGD 116.97 (versus 113.99).
| Item (Mil JPY) | Actual of FY2024 (Apr.1,2024-Mar.31,2025) | Actual of FY2025 (Apr.1,2025-Mar.31,2026) | Change (%) |
|---|---|---|---|
| Net sales | 234,216 | 261,184 | 26,968 (11.5%) |
| Operating income | 18,516 | 25,035 | 6,519 (35.2%) |
| (Operating margin) | (7.9%) | (9.6%) | — |
| Ordinary income | 20,090 | 27,299 | 7,208 (35.9%) |
| (Ordinary margin) | (8.6%) | (10.5%) | — |
| Net income attributable to owners of the parent | 14,415 | 20,992 | 6,576 (45.6%) |
| (Net margin) | (6.2%) | (8.0%) | — |
Results also exceeded the company’s own FY2025 forecast. Against a forecast of 252,000 million yen in net sales, 23,800 million yen in operating income, 25,600 million yen in ordinary income and 19,400 million yen in net income attributable to owners of the parent, the actual figures were higher by 9,184 million yen (3.6%), 1,235 million yen (5.2%), 1,699 million yen (6.6%) and 1,592 million yen (8.2%) respectively.
Orders
Orders are the company’s central indicator. The materials note that “FY2025 orders increased from plan and FY2024” and that the “FY2026 plan is up from FY2025 due to increase orders in America.” By industry, FY2025 orders increased significantly from FY2024 for Die&Mold, mainly in Asia. At the subsidiary level, Asian orders in the fourth quarter — mainly in China — increased significantly from FY2024 4Q, US subsidiary orders for aerospace increased significantly from FY2024 4Q, and EU subsidiary orders for aerospace and parts machining increased from FY2024 4Q. On a non-consolidated basis in Japan, fourth-quarter orders increased from FY2024 4Q mainly for parts machining, and Makino’s share of Japan Machine Tool Builders’ Association orders in 4Q was 5.6%.
| Orders | FY2025 Plan | FY2025 Actual | FY2026 Plan |
|---|---|---|---|
| Consolidated (bil JPY) | 260.0 | 270.0 | 280.0 |
| Asian subsidiary (mil SGD) | 1,060 | 1,062 | 1,070 |
| US subsidiary (mil USD) | 500 | 526 | 585 |
| EU subsidiary (mil EUR) | 120 | 134 | 140 |
Segment Results
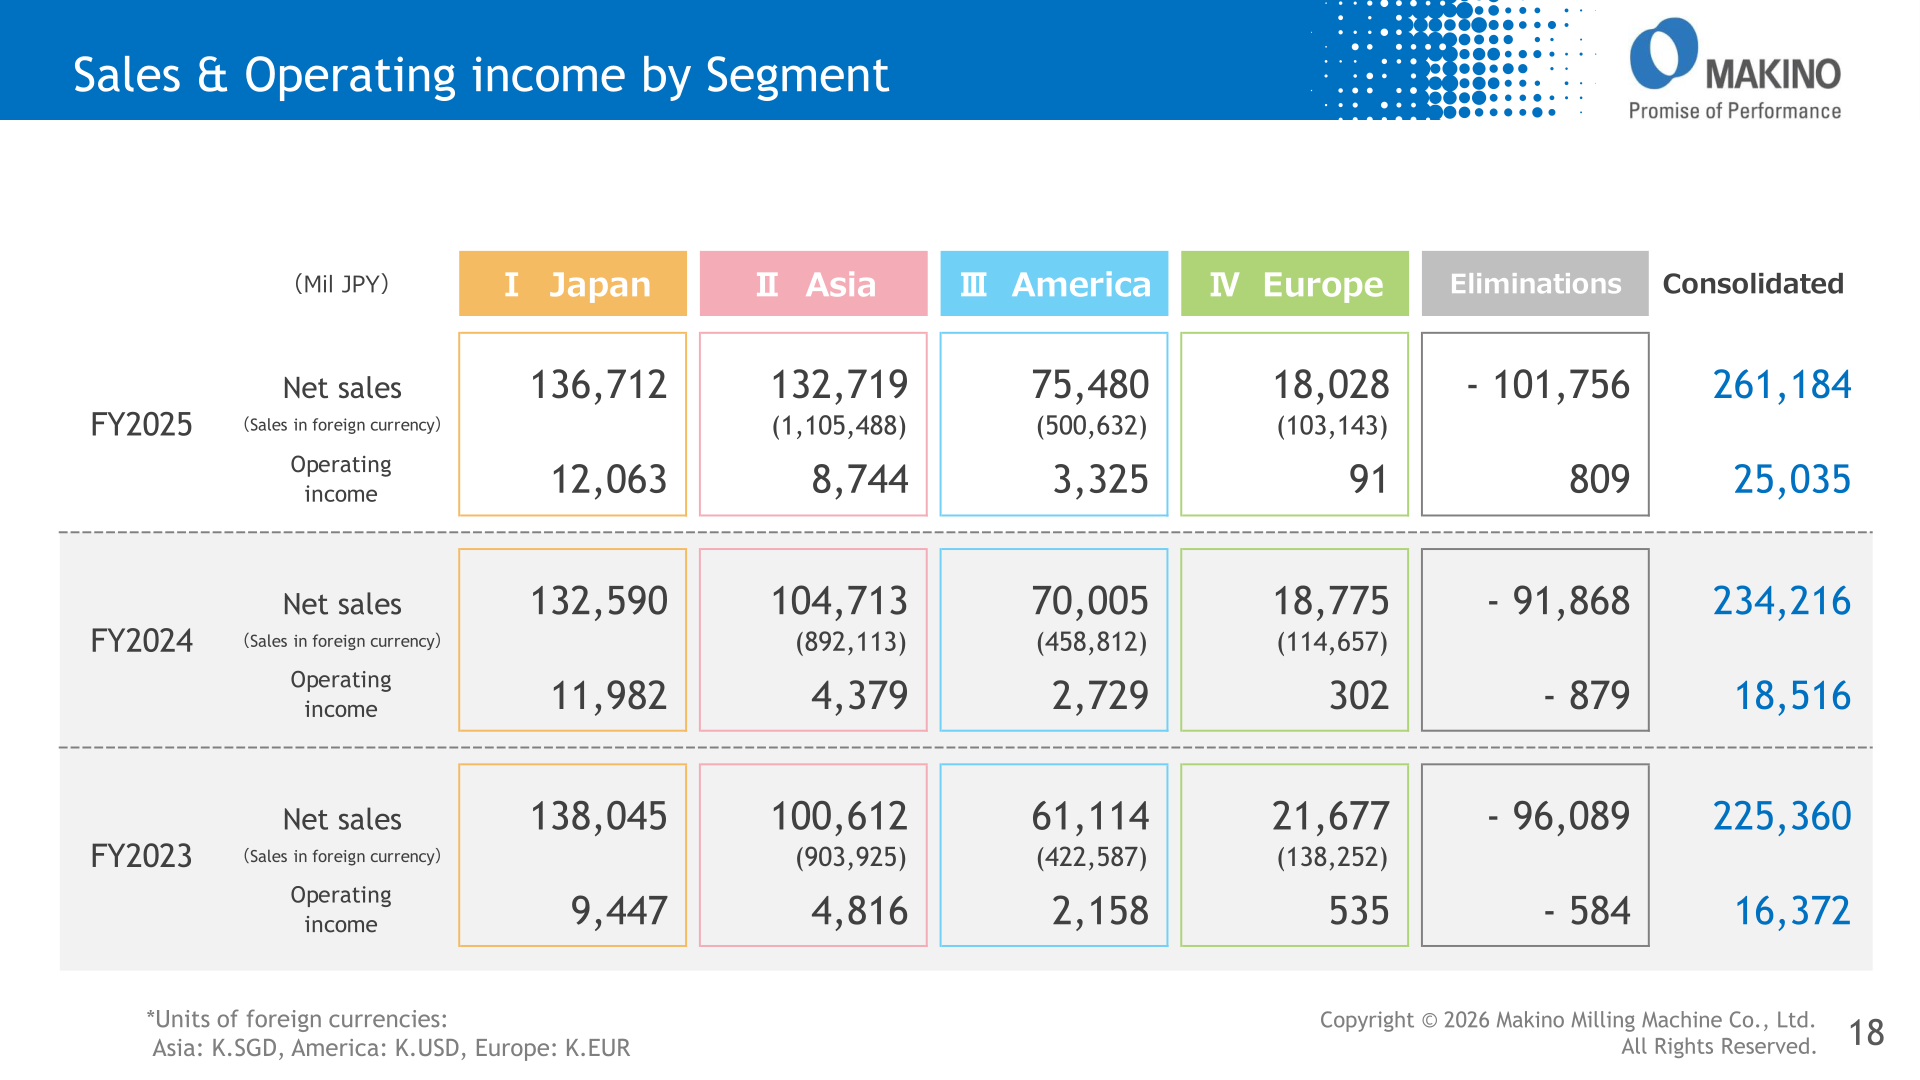
Asia was the largest growth driver, with net sales rising to 132,719 million yen from 104,713 million yen and operating income roughly doubling to 8,744 million yen from 4,379 million yen. America also grew, while Europe saw both sales and operating income decline. By destination, FY2025 net sales were Japan 34,361 million yen (13.1%), Asia 128,673 million yen (49.2%), America 74,894 million yen (28.6%), Europe 19,915 million yen (7.6%) and Others 3,339 million yen (1.2%).
| Segment (Mil JPY) | FY2025 Net sales | FY2025 Operating income | FY2024 Net sales | FY2024 Operating income |
|---|---|---|---|---|
| Ⅰ Japan | 136,712 | 12,063 | 132,590 | 11,982 |
| Ⅱ Asia | 132,719 | 8,744 | 104,713 | 4,379 |
| Ⅲ America | 75,480 | 3,325 | 70,005 | 2,729 |
| Ⅳ Europe | 18,028 | 91 | 18,775 | 302 |
| Eliminations | – 101,756 | 809 | – 91,868 | – 879 |
| Consolidated | 261,184 | 25,035 | 234,216 | 18,516 |
FY2026 Forecast
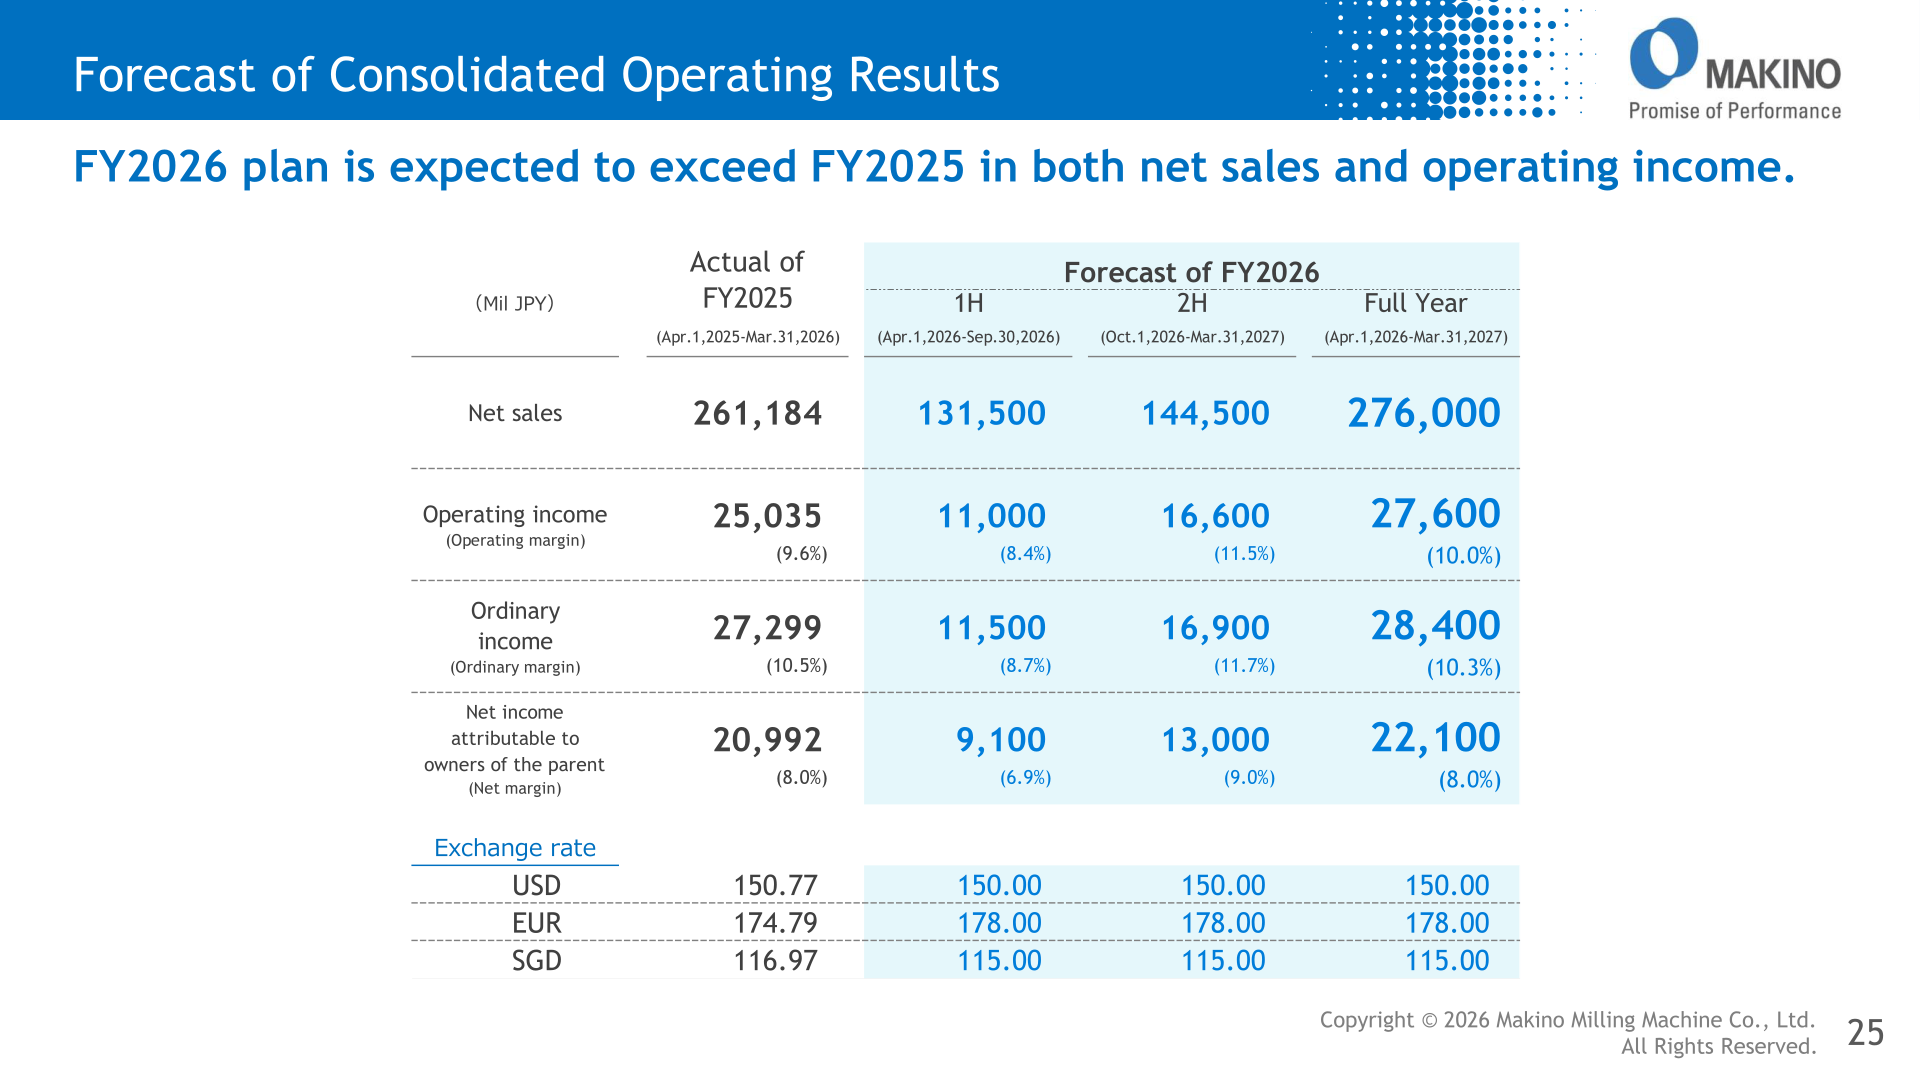
The company states that the “FY2026 plan is expected to exceed FY2025 in both net sales and operating income.” The full-year plan for the year ending March 31, 2027 is weighted to the second half. Assumed exchange rates are USD 150.00, EUR 178.00 and SGD 115.00 for both halves.
| Item (Mil JPY) | Actual of FY2025 (Apr.1,2025-Mar.31,2026) | FY2026 1H (Apr.1,2026-Sep.30,2026) | FY2026 2H (Oct.1,2026-Mar.31,2027) | FY2026 Full Year (Apr.1,2026-Mar.31,2027) |
|---|---|---|---|---|
| Net sales | 261,184 | 131,500 | 144,500 | 276,000 |
| Operating income | 25,035 | 11,000 | 16,600 | 27,600 |
| (Operating margin) | (9.6%) | (8.4%) | (11.5%) | (10.0%) |
| Ordinary income | 27,299 | 11,500 | 16,900 | 28,400 |
| (Ordinary margin) | (10.5%) | (8.7%) | (11.7%) | (10.3%) |
| Net income attributable to owners of the parent | 20,992 | 9,100 | 13,000 | 22,100 |
| (Net margin) | (8.0%) | (6.9%) | (9.0%) | (8.0%) |
Shareholder Returns
The explanatory material does not contain a dividend or shareholder return slide, so the dividend per share and the return policy cannot be confirmed from the materials. The consolidated statements of cash flow show “Dividends paid by the parent company” of -2,337 million yen in FY2025 (-3,763 million yen in FY2024) and “Payment for purchases of treasury stock” of -5 million yen in FY2025 (-2,007 million yen in FY2024).
Cash Flow and Balance Sheet
The company notes that it “Generated higher free cash flow year-over-year.” Cash flows from operating activities were 33,227 million yen (13,571 million yen in FY2024), cash flows from investing activities were -16,152 million yen (-13,877 million yen), and cash flows from financing activities were -9,178 million yen (-6,726 million yen). Cash and cash equivalents at the end of the period were 75,151 million yen, up from 64,067 million yen. Total assets grew to 4,230 (100 mil JPY) as of March 31, 2026 from 3,670 as of March 31, 2025, with net assets of 2,075 versus 1,888 and interest-bearing debt of 477 versus 526.
Capital Investment and Growth Initiatives
Consolidated capital investment rose to 211 (100 mil JPY) in FY2025 from 169 in FY2024, of which the non-consolidated portion was 151 versus 129, and the FY2026 plan is 200 consolidated / 138 non-consolidated. Consolidated depreciation was 83 (100 mil JPY) in FY2025 with a FY2026 plan of 97. A new Fuji-Yoshida plant is increasing production capacity for large machines, with the Main Assembly Plant and Warehouse Building scheduled to start up in June 2026; the company cites shorter lead times through parallel assembly enabled by modularization, automated warehousing, and powder coating. On products, Makino released four machine models in FY2025, including large machines and 5-axis machines, and plans to launch new products aligned with customer needs from FY2026 onward.
On regional strategy, the company is strengthening local production in China to respond quickly to changes in customer needs, expanding the number of product models built there from 6 models in FY17 to 11 models in FY21 and 19 models in FY25, and broadening target markets from electronics and compact automotive die and mold into large automotive, construction/agriculture, hydraulics/pneumatics, general machinery and semiconductors. In America, aerospace demand drives orders, supported by supply chain restructuring, replacement of aging equipment (more than half of delivered machines are over 10 years old) and new space-related demand. Consolidated headcount was 4,777 at FY2025 (4,814 at FY2024), of which non-consolidated was 1,405 (1,415).
This article is an analysis based on publicly available information and is not a recommendation to buy or sell any specific securities. Investment decisions are your own responsibility.
![[Obayashi] Investors’ Guide 2026 — The Complete 24-Article Breakdown](https://japan-equity.com/wp-content/uploads/2026/07/hub_cover-1024x1024.png)
![[Obayashi] IR & SR Policy — Feeding Dialogue Back into Management](https://japan-equity.com/wp-content/uploads/2026/07/p32_sq-1024x1024.jpg)
![[Obayashi] Real Estate Development — 18.7% Margin, ¥287.7bn Unrealized Gains](https://japan-equity.com/wp-content/uploads/2026/07/p20_sq-1024x1024.jpg)
![[Obayashi] Domestic Civil Engineering — Resilience Spending Supports 9.6% Margin](https://japan-equity.com/wp-content/uploads/2026/07/p11_sq-1024x1024.jpg)
![[Obayashi] Share Price & External Ratings — vs TOPIX, ESG Index Inclusion](https://japan-equity.com/wp-content/uploads/2026/07/p40_sq-1024x1024.jpg)
![[Construction] ¥75.5tn Investment, Shrinking Workforce — Big-5 Market Share](https://japan-equity.com/wp-content/uploads/2026/07/p12_sq-1024x1024.jpg)



![[Obayashi] Capital Policy & Shareholder Returns — ROE 10%+, DOE ~5%, ¥100bn Buyback](https://japan-equity.com/wp-content/uploads/2026/07/p27_sq-1024x1024.jpg)
![[Obayashi] Reducing Cross-Shareholdings — ¥285.2bn Sold in Five Years](https://japan-equity.com/wp-content/uploads/2026/07/p29_sq-1024x1024.jpg)
![[Obayashi] ¥750bn Investment Plan — ¥300bn to Development, ¥190bn to Tech/DX](https://japan-equity.com/wp-content/uploads/2026/07/p30_sq-1024x1024.jpg)
![[Obayashi] MTP2022 KPIs — Operating Profit ~2x Target, ROE 14.4%](https://japan-equity.com/wp-content/uploads/2026/07/p25_sq-1024x1024.jpg)
![[Obayashi] Cash Allocation — ¥420bn Investment CF Over Five Years](https://japan-equity.com/wp-content/uploads/2026/07/p26_sq-1024x1024.jpg)
![[Obayashi] Green Energy — 44 Plants, 344MW, and the Green Hydrogen Challenge](https://japan-equity.com/wp-content/uploads/2026/07/p21_sq-1024x1024.jpg)
![[Obayashi] Tackling the Labor Shortage — Robotics Construction®](https://japan-equity.com/wp-content/uploads/2026/07/p14_sq-1024x1024.jpg)
