
This article is based on publicly available IR materials and is not a recommendation to buy or sell any specific securities.
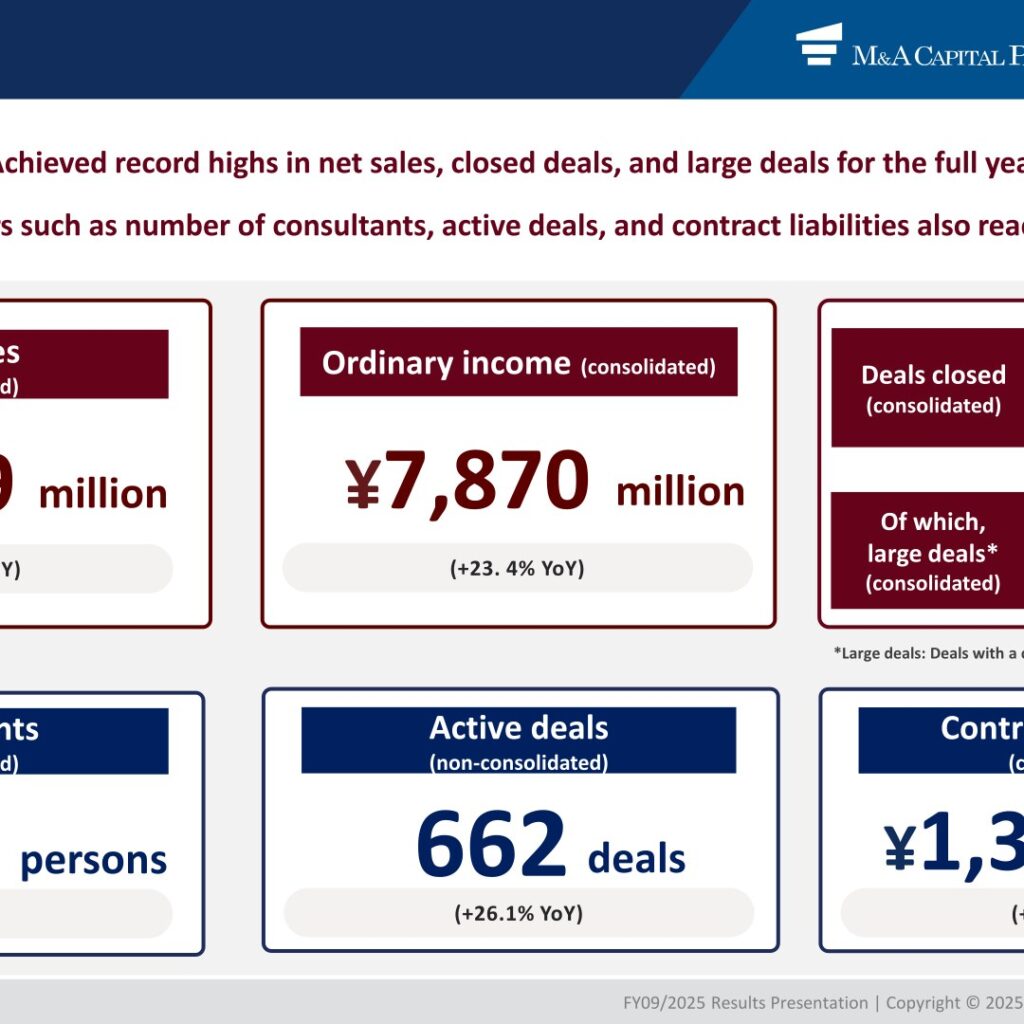
Note: M&A Capital Partners closes its books at the end of September, and the presentation labels the year covered here as “FY09/2025”; the labels used in the text, tables and segment data below follow the materials. M&A Capital Partners reported record-high consolidated net sales of 22,449 million yen (+17.1% YoY) and ordinary income of 7,870 million yen (+23.4% YoY) for FY09/2025. The number of deals closed and the number of large deals (deals with a commission of 100 million yen or more) also reached full-year record highs on a consolidated basis, at 248 deals (+12.2% YoY) and 62 deals (+40.9% YoY). Leading indicators — consultants, active deals and contract liabilities — likewise reached record highs. For FY09/2026 the company presents its forecast under IFRS, projecting net sales of 26,991 million yen and pre-tax profit of 10,420 million yen.
Consolidated Results (Full-Year Actual)
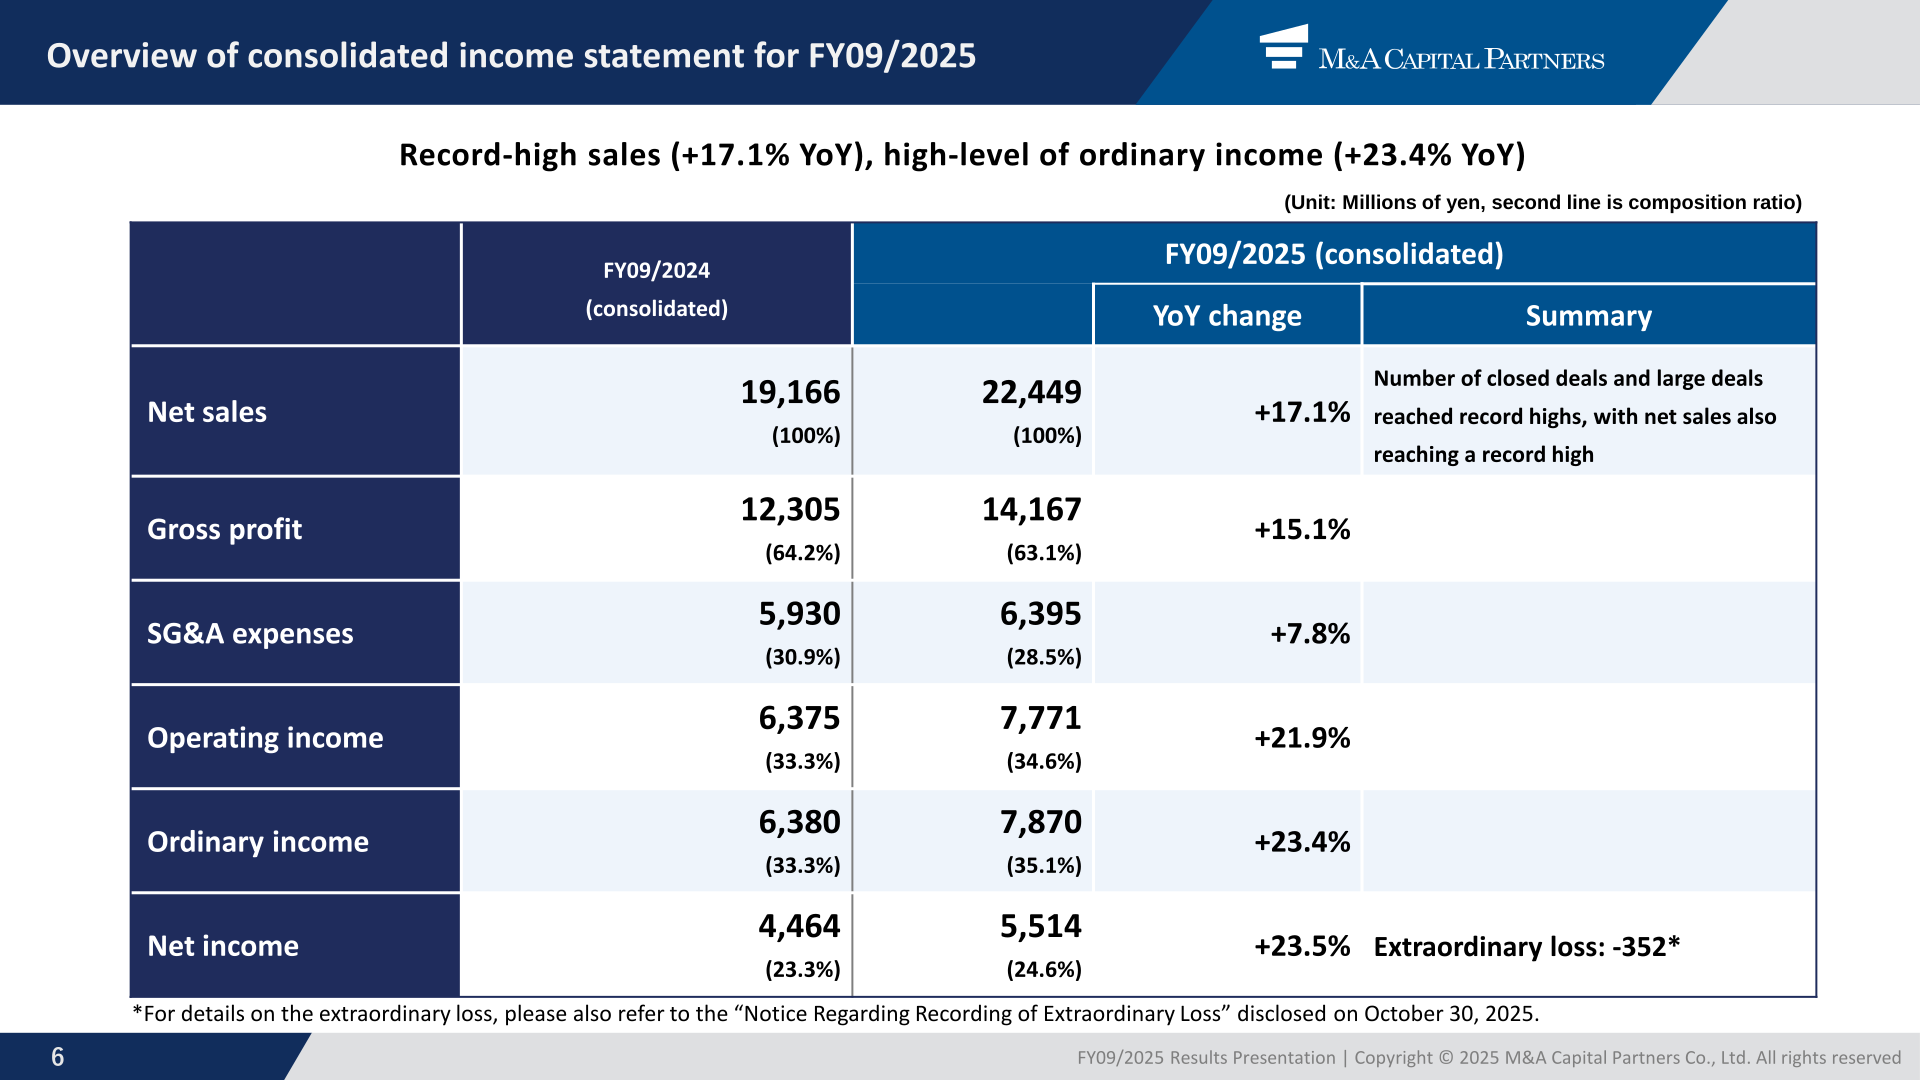
Consolidated net sales rose 17.1% year on year to 22,449 million yen and ordinary income rose 23.4% to 7,870 million yen, with the ordinary income margin improving to 35.1% from 33.3%. Net income was 5,514 million yen (+23.5% YoY) after an extraordinary loss of -352 million yen; the company notes that details are given in the “Notice Regarding Recording of Extraordinary Loss” disclosed on October 30, 2025. Against the full-year forecast of 23,645 million yen in net sales and 8,105 million yen in ordinary income, results reached 94.9% and 97.1% respectively, which the company describes as broadly in line with budget. On the balance sheet, total assets stood at 51,926 million yen (+4,786) and total net assets at 43,932 million yen (+3,522), with cash and deposits up 7,096.
| Item | FY09/2024 (consolidated) | FY09/2025 (consolidated) | YoY change |
|---|---|---|---|
| Net sales | 19,166 (100%) | 22,449 (100%) | +17.1% |
| Gross profit | 12,305 (64.2%) | 14,167 (63.1%) | +15.1% |
| SG&A expenses | 5,930 (30.9%) | 6,395 (28.5%) | +7.8% |
| Operating income | 6,375 (33.3%) | 7,771 (34.6%) | +21.9% |
| Ordinary income | 6,380 (33.3%) | 7,870 (35.1%) | +23.4% |
| Net income | 4,464 (23.3%) | 5,514 (24.6%) | +23.5% |
Unit: Millions of yen; figures in parentheses are composition ratios. Source: Presentation Materials for the Fiscal Year 09/2025 Earnings Results, P.6.
Key Performance Indicators
On a consolidated basis, deals closed reached 248 (+12.2% YoY), of which large deals — defined in the materials as deals with a commission of 100 million yen or more — numbered 62 (+40.9% YoY). Consultants totalled 258 persons (+44 YoY), active deals on a non-consolidated basis reached a record 662 deals (+26.1% YoY) with a large-deal ratio of 25.7%, and contract liabilities reached a record 1,376 million yen (+29.4% versus the previous fiscal year-end). Consolidated deals closed of 248 came to 94.7% of the full-year forecast of 262 deals.
Results by Group Company (Non-Consolidated)
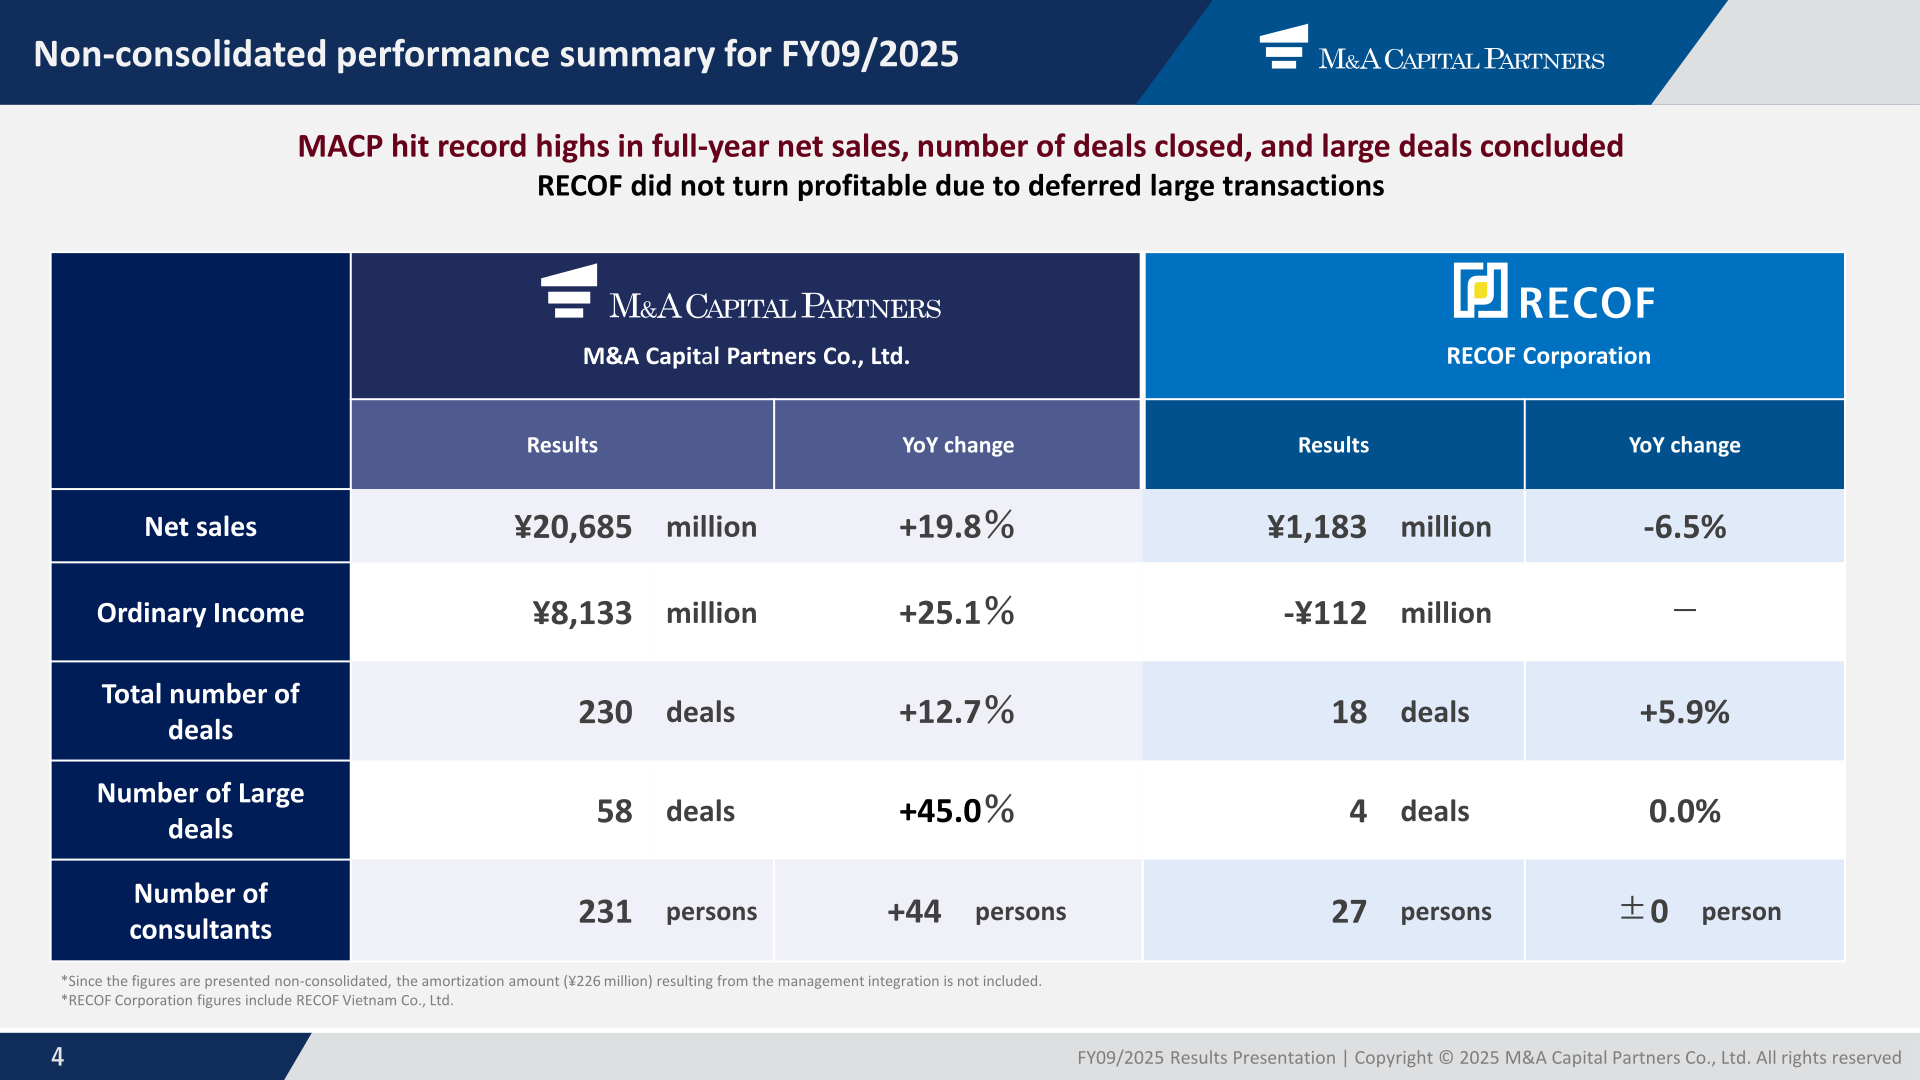
M&A Capital Partners Co., Ltd. on a non-consolidated basis hit record highs in full-year net sales, deals closed and large deals concluded, with net sales of 20,685 million yen (+19.8% YoY), ordinary income of 8,133 million yen (+25.1% YoY), 230 deals closed (+12.7% YoY) including 58 large deals (+45.0% YoY), and 231 consultants (+44 persons YoY). RECOF Corporation did not turn profitable due to deferred large transactions, posting net sales of 1,183 million yen (-6.5% YoY) and an ordinary loss of 112 million yen, with 18 deals closed (+5.9% YoY) including 4 large deals (0.0% YoY) and 27 consultants (unchanged). Because the figures are presented non-consolidated, the amortization amount of 226 million yen resulting from the management integration is not included, and RECOF Corporation figures include RECOF Vietnam Co., Ltd. For FY09/2026 the company guides on a J-GAAP basis for each entity, as shown in the table below.
| Company | Metric | FY09/2025 (Actual) | FY09/2026 (Forecast, J-GAAP) |
|---|---|---|---|
| M&A Capital Partners Co., Ltd. | Net sales | 20,685 million yen | 24,640 million yen |
| M&A Capital Partners Co., Ltd. | Ordinary income | 8,133 million yen | 9,940 million yen |
| M&A Capital Partners Co., Ltd. | Deals closed | 230 deals | 276 deals |
| M&A Capital Partners Co., Ltd. | Large deals | 58 deals | 60 deals |
| M&A Capital Partners Co., Ltd. | Consultants | 231 persons | 289 persons |
| RECOF Corporation | Net sales | 1,183 million yen | 1,510 million yen |
| RECOF Corporation | Ordinary income | -112 million yen | 131 million yen |
| RECOF Corporation | Deals closed | 18 deals | 22 deals |
| RECOF Corporation | Large deals | 4 deals | 3 deals |
| RECOF Corporation | Consultants | 27 persons | 31 persons |
Year-on-year changes for the FY09/2026 non-consolidated forecast are: M&A Capital Partners net sales +19.1%, ordinary income +22.2%, deals closed +20.0%, large deals +3.4%, consultants +58 persons; RECOF Corporation net sales +27.6%, deals closed +22.2%, large deals -25.0%, consultants +4 persons (no year-on-year figure is given for RECOF ordinary income). Source: Presentation Materials for the Fiscal Year 09/2025 Earnings Results P.4, P.15, P.16.
FY09/2026 Forecast
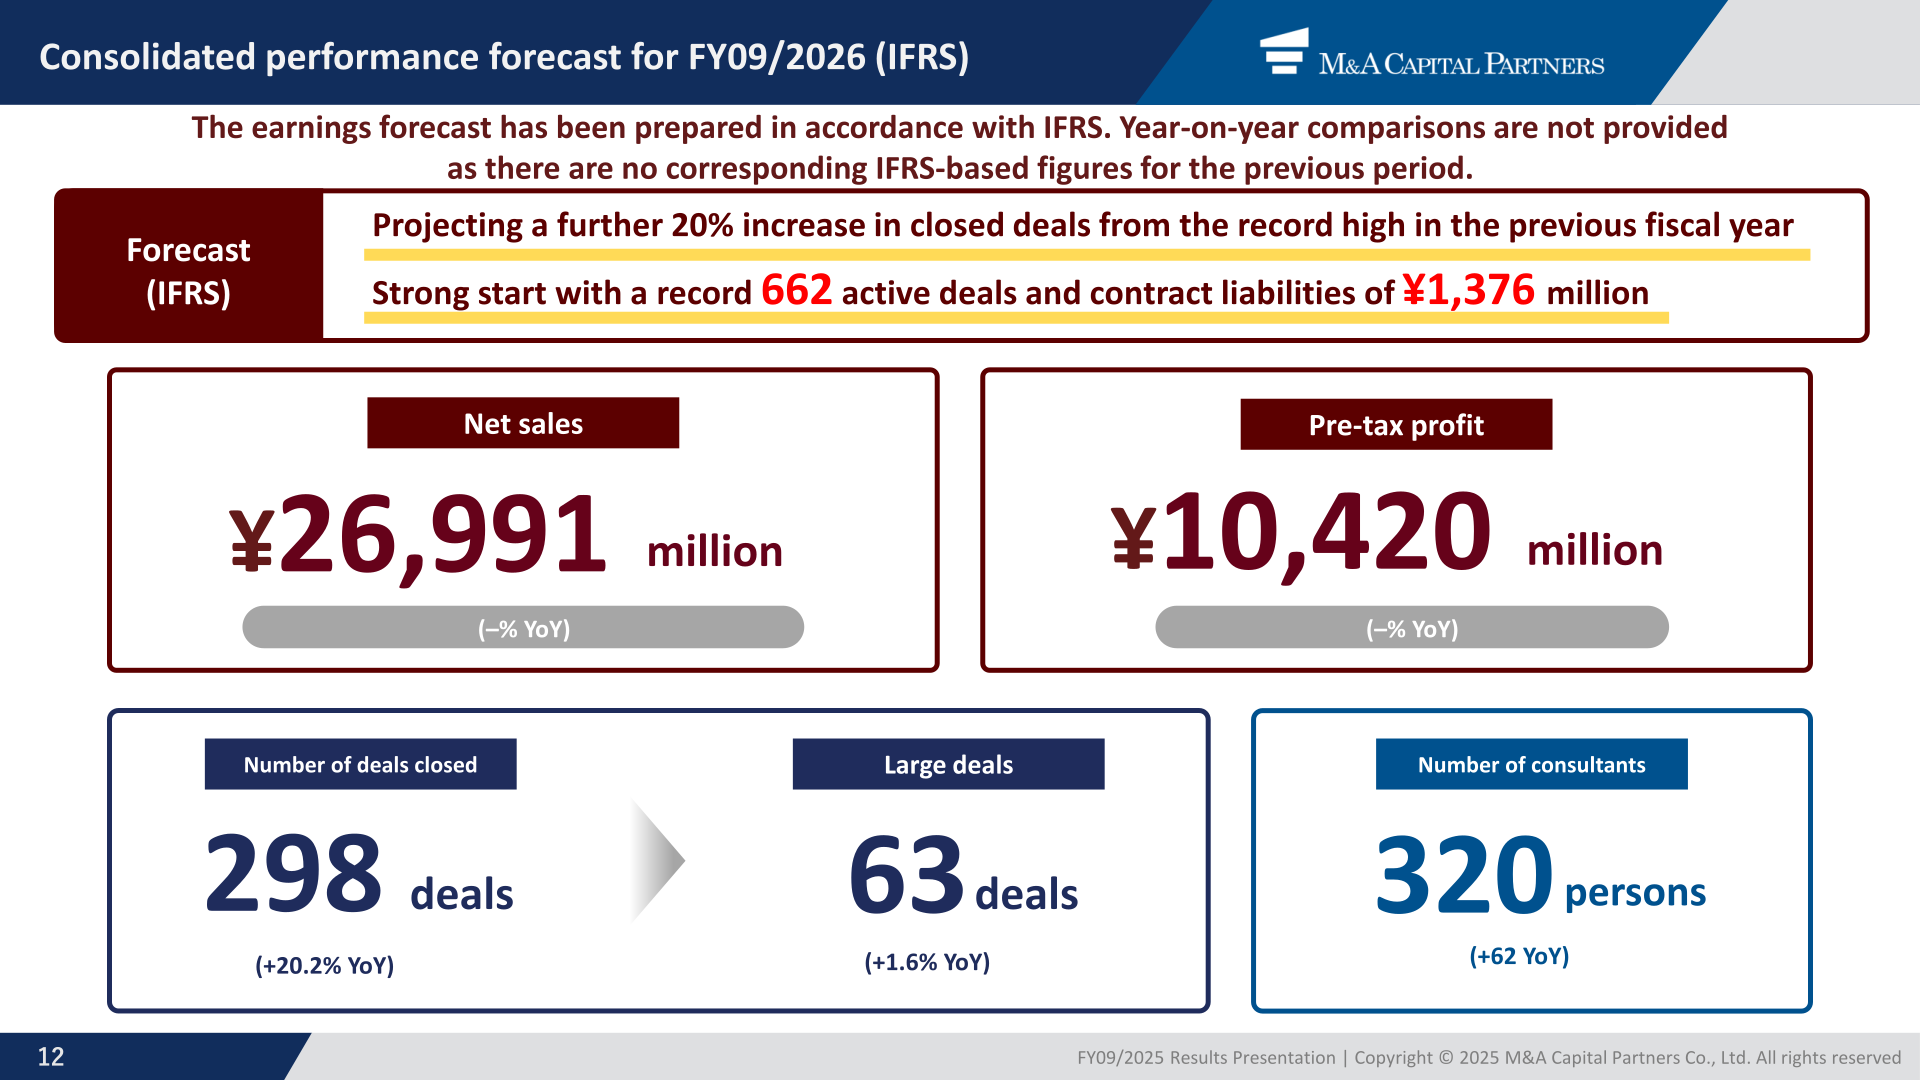
The FY09/2026 earnings forecast is prepared in accordance with IFRS, and the company states that year-on-year comparisons are not provided because there are no corresponding IFRS-based figures for the previous period. Consolidated net sales are forecast at 26,991 million yen and pre-tax profit at 10,420 million yen. On the operating side, the company projects 298 deals closed (+20.2% YoY), of which 63 large deals (+1.6% YoY), and 320 consultants (+62 YoY), noting a strong start with a record 662 active deals and contract liabilities of 1,376 million yen. Consolidated operating margin in the FY09/2026 earnings forecast is set high at 38%.
| Item | FY09/2026 (IFRS) | FY09/2026 (J-GAAP, reference) | Difference |
|---|---|---|---|
| Net sales | 26,991 | 26,991 | — |
| Cost of sales | 10,063 | 10,063 | — |
| Gross profit | 16,927 | 16,927 | — |
| SG&A expenses | 6,646 | 6,897 | -251 |
| Other operating income | 0 | — | +0 |
| Operating income | 10,280 | 10,030 | +250 |
| Non-operating income | — | 155 | -155 |
| Ordinary income | — | 10,185 | -10,185 |
| Extraordinary income | — | 27 | -27 |
| Finance income | 139 | — | +139 |
| Profit before income taxes | 10,420 | 10,212 | +208 |
| Income taxes | 3,185 | 3,194 | -8 |
| Net income | 7,234 | 7,018 | +216 |
Unit: Millions of yen. The main drivers of the difference are the application of IFRS 16 to office lease contracts and the recognition of asset retirement obligations, together with reclassification items. The company estimates the impact on the FY09/2026 income statement at approximately +280 million yen to operating income from office lease contracts and approximately -20 million yen from asset retirement obligations, and expects to record approximately 1.6 billion yen in right-of-use assets and approximately 2 billion yen in lease liabilities in respect of office leases. The company also notes that goodwill is not amortized under IFRS, but that there is no impact on the FY09/2026 forecast as it has no goodwill recorded. Source: Presentation Materials for the Fiscal Year 09/2025 Earnings Results P.13, P.14.
Shareholder Returns
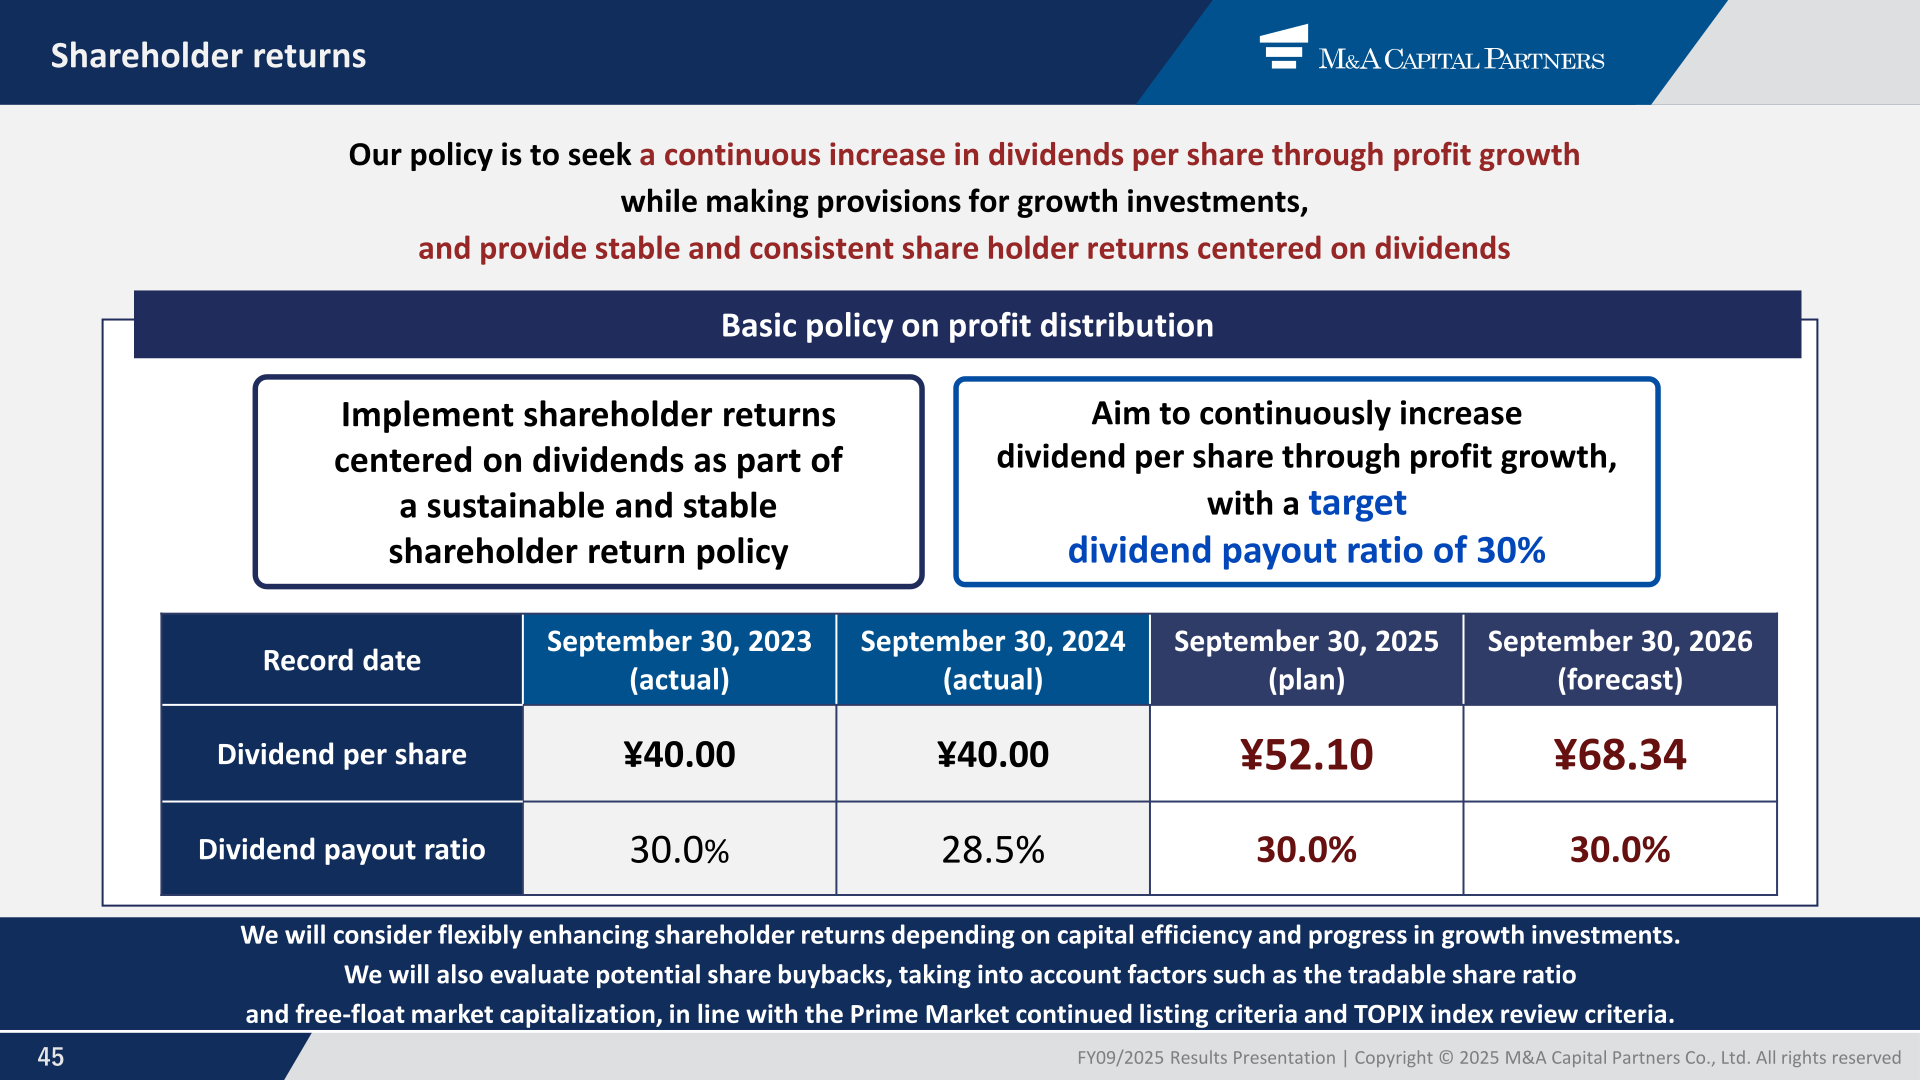
The company’s policy is to seek a continuous increase in dividends per share through profit growth while making provisions for growth investments, and to provide stable and consistent shareholder returns centered on dividends, with a target dividend payout ratio of 30%. The dividend per share for the September 30, 2025 record date is planned at 52.10 yen, and the forecast for the September 30, 2026 record date is 68.34 yen, both at a 30.0% payout ratio. The materials state that the company will consider flexibly enhancing shareholder returns depending on capital efficiency and progress in growth investments, and will also evaluate potential share buybacks, taking into account factors such as the tradable share ratio and free-float market capitalization, in line with the Prime Market continued listing criteria and TOPIX index review criteria.
| Record date | September 30, 2023 (actual) | September 30, 2024 (actual) | September 30, 2025 (plan) | September 30, 2026 (forecast) |
|---|---|---|---|---|
| Dividend per share | 40.00 yen | 40.00 yen | 52.10 yen | 68.34 yen |
| Dividend payout ratio | 30.0% | 28.5% | 30.0% | 30.0% |
Medium-Term Plan and Topics
The MACP Group presents a three-year medium-term plan for organic growth covering FY09/2026 to FY09/2028, centred on deals closed and the number of consultants. For M&A Capital Partners, deals closed are planned to rise from 230 in FY09/2025 to 276, 331 and 397, an average of +20% per year, while consultants are planned to rise from 231 to 289, 361 and 451, an average of +25% per year. For RECOF, deals closed are planned at 18, 22, 25 and 29 and consultants at 27, 31, 36 and 41, both an average of +15% per year. The company notes that with rent fixed during the lease term for the current office and personnel costs primarily success fee-based and linked to sales, the profit structure enables further margin improvement as deals closed and net sales increase.
Among the topics disclosed, the company reports achieving a “triple crown” in the Q3 2025 M&A Market League Table by number of transactions, stating that it is the sole M&A brokerage firm to rank in and secure the top position, following full-year No.1 across three divisions in 2024. By number of deals excluding property acquisition, M&A Capital Partners ranked first in Domestic Deals Top 5 Advisors with 150 deals, first in Japan Involvement Announced (AD19aa) with 153 deals and first in Japan Involvement Completed (AF23aa) with 160 deals; transactions announced or completed between January 1, 2025 and September 30, 2025 are eligible. The company also began new partnerships in Q4 with two companies in the M&A field, two major key TV station groups and five local newspaper companies, and states it is currently partnering with newspaper companies in 19 prefectures and three TV stations nationwide.
This article is an analysis based on publicly available information and is not a recommendation to buy or sell any specific securities. Investment decisions are your own responsibility.
![[Obayashi] Investors’ Guide 2026 — The Complete 24-Article Breakdown](https://japan-equity.com/wp-content/uploads/2026/07/hub_cover-1024x1024.png)
![[Obayashi] IR & SR Policy — Feeding Dialogue Back into Management](https://japan-equity.com/wp-content/uploads/2026/07/p32_sq-1024x1024.jpg)
![[Obayashi] Real Estate Development — 18.7% Margin, ¥287.7bn Unrealized Gains](https://japan-equity.com/wp-content/uploads/2026/07/p20_sq-1024x1024.jpg)
![[Obayashi] Domestic Civil Engineering — Resilience Spending Supports 9.6% Margin](https://japan-equity.com/wp-content/uploads/2026/07/p11_sq-1024x1024.jpg)
![[Obayashi] Share Price & External Ratings — vs TOPIX, ESG Index Inclusion](https://japan-equity.com/wp-content/uploads/2026/07/p40_sq-1024x1024.jpg)
![[Construction] ¥75.5tn Investment, Shrinking Workforce — Big-5 Market Share](https://japan-equity.com/wp-content/uploads/2026/07/p12_sq-1024x1024.jpg)



![[Obayashi] Capital Policy & Shareholder Returns — ROE 10%+, DOE ~5%, ¥100bn Buyback](https://japan-equity.com/wp-content/uploads/2026/07/p27_sq-1024x1024.jpg)
![[Obayashi] Reducing Cross-Shareholdings — ¥285.2bn Sold in Five Years](https://japan-equity.com/wp-content/uploads/2026/07/p29_sq-1024x1024.jpg)
![[Obayashi] ¥750bn Investment Plan — ¥300bn to Development, ¥190bn to Tech/DX](https://japan-equity.com/wp-content/uploads/2026/07/p30_sq-1024x1024.jpg)
![[Obayashi] MTP2022 KPIs — Operating Profit ~2x Target, ROE 14.4%](https://japan-equity.com/wp-content/uploads/2026/07/p25_sq-1024x1024.jpg)
![[Obayashi] Cash Allocation — ¥420bn Investment CF Over Five Years](https://japan-equity.com/wp-content/uploads/2026/07/p26_sq-1024x1024.jpg)
![[Obayashi] Green Energy — 44 Plants, 344MW, and the Green Hydrogen Challenge](https://japan-equity.com/wp-content/uploads/2026/07/p21_sq-1024x1024.jpg)
![[Obayashi] Tackling the Labor Shortage — Robotics Construction®](https://japan-equity.com/wp-content/uploads/2026/07/p14_sq-1024x1024.jpg)
