
This article is based on publicly available IR materials and is not a recommendation to buy or sell any specific securities.
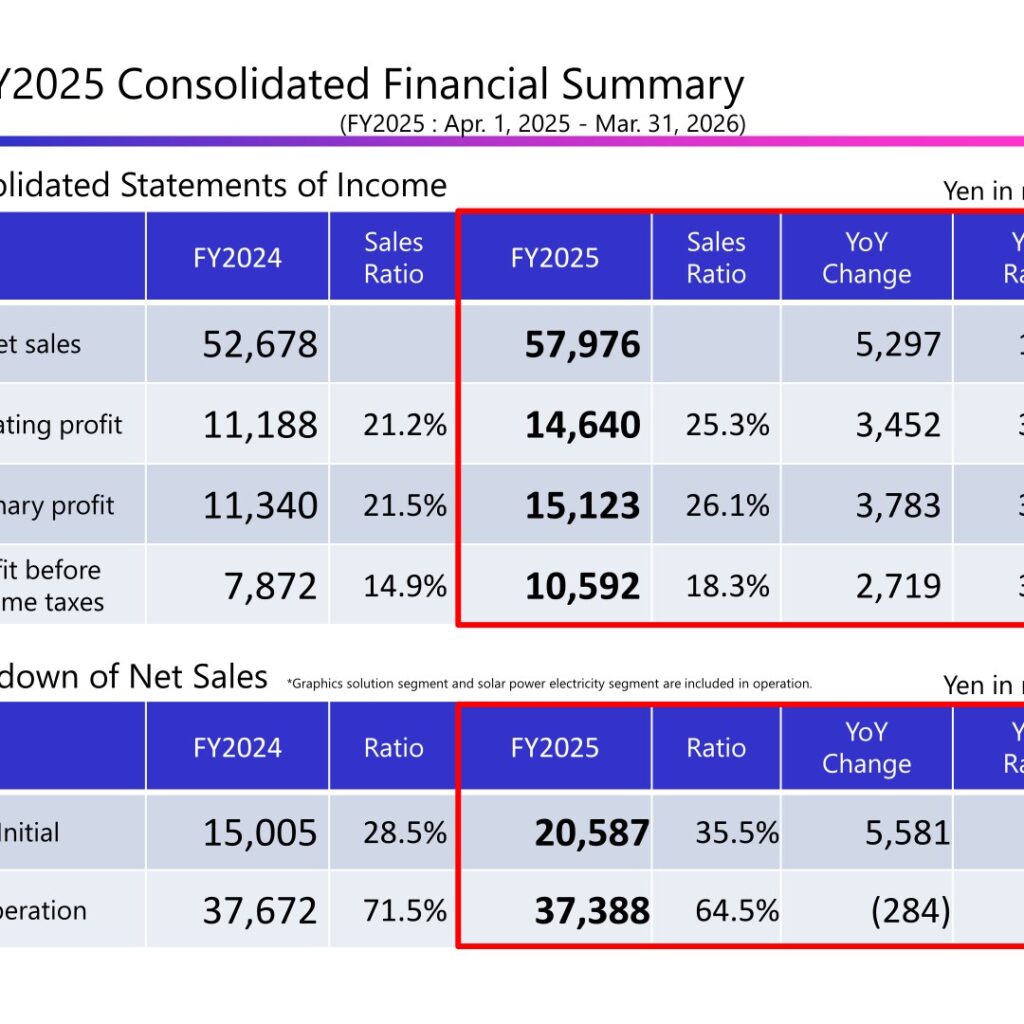
JAPAN MATERIAL Co., Ltd. reported FY2025 (April 1, 2025 – March 31, 2026) net sales of 57,976 million yen, an increase of 5,297 million yen or 10.1% year on year. Operating profit rose 3,452 million yen (30.9%) to 14,640 million yen and ordinary profit rose 3,783 million yen (33.4%) to 15,123 million yen, lifting the ordinary profit margin to 26.1% from 21.5% a year earlier. Growth was led by the Electronics segment, where capital investment at customers’ semiconductor plants expanded and production activity at NAND flash memory plants remained at a high level. For FY2026 the company forecasts net sales of 61,000 million yen and ordinary profit of 15,500 million yen, and plans to raise the annual dividend to 35.00 yen per share.
Consolidated Results (Full-Year Actual)
All figures below are as presented in the company’s FY2025 Consolidated Financial Summary, in millions of yen. The sales ratio of operating profit improved to 25.3% from 21.2%, ordinary profit to 26.1% from 21.5%, and profit before income taxes to 18.3% from 14.9%.
| Item (Yen in millions) | FY2024 | FY2025 | YoY Change | YoY Ratio |
|---|---|---|---|---|
| Net sales | 52,678 | 57,976 | 5,297 | 10.1% |
| Operating profit | 11,188 | 14,640 | 3,452 | 30.9% |
| Ordinary profit | 11,340 | 15,123 | 3,783 | 33.4% |
| Profit before income taxes | 7,872 | 10,592 | 2,719 | 34.5% |
The company splits net sales between its Initial division (work tied to new fab construction and capital investment) and its Operation division (recurring services at customers’ operating fabs; the Graphics Solution and Solar Power segments are included in Operation). Initial sales grew 37.2% to 20,587 million yen and accounted for 35.5% of net sales, while Operation sales edged down 0.8% to 37,388 million yen, or 64.5% of net sales.
| Breakdown of Net Sales (Yen in millions) | FY2024 | Ratio | FY2025 | Ratio | YoY Change | YoY Ratio |
|---|---|---|---|---|---|---|
| Initial | 15,005 | 28.5% | 20,587 | 35.5% | 5,581 | 37.2% |
| Operation | 37,672 | 71.5% | 37,388 | 64.5% | (284) | (0.8%) |
Segment Results
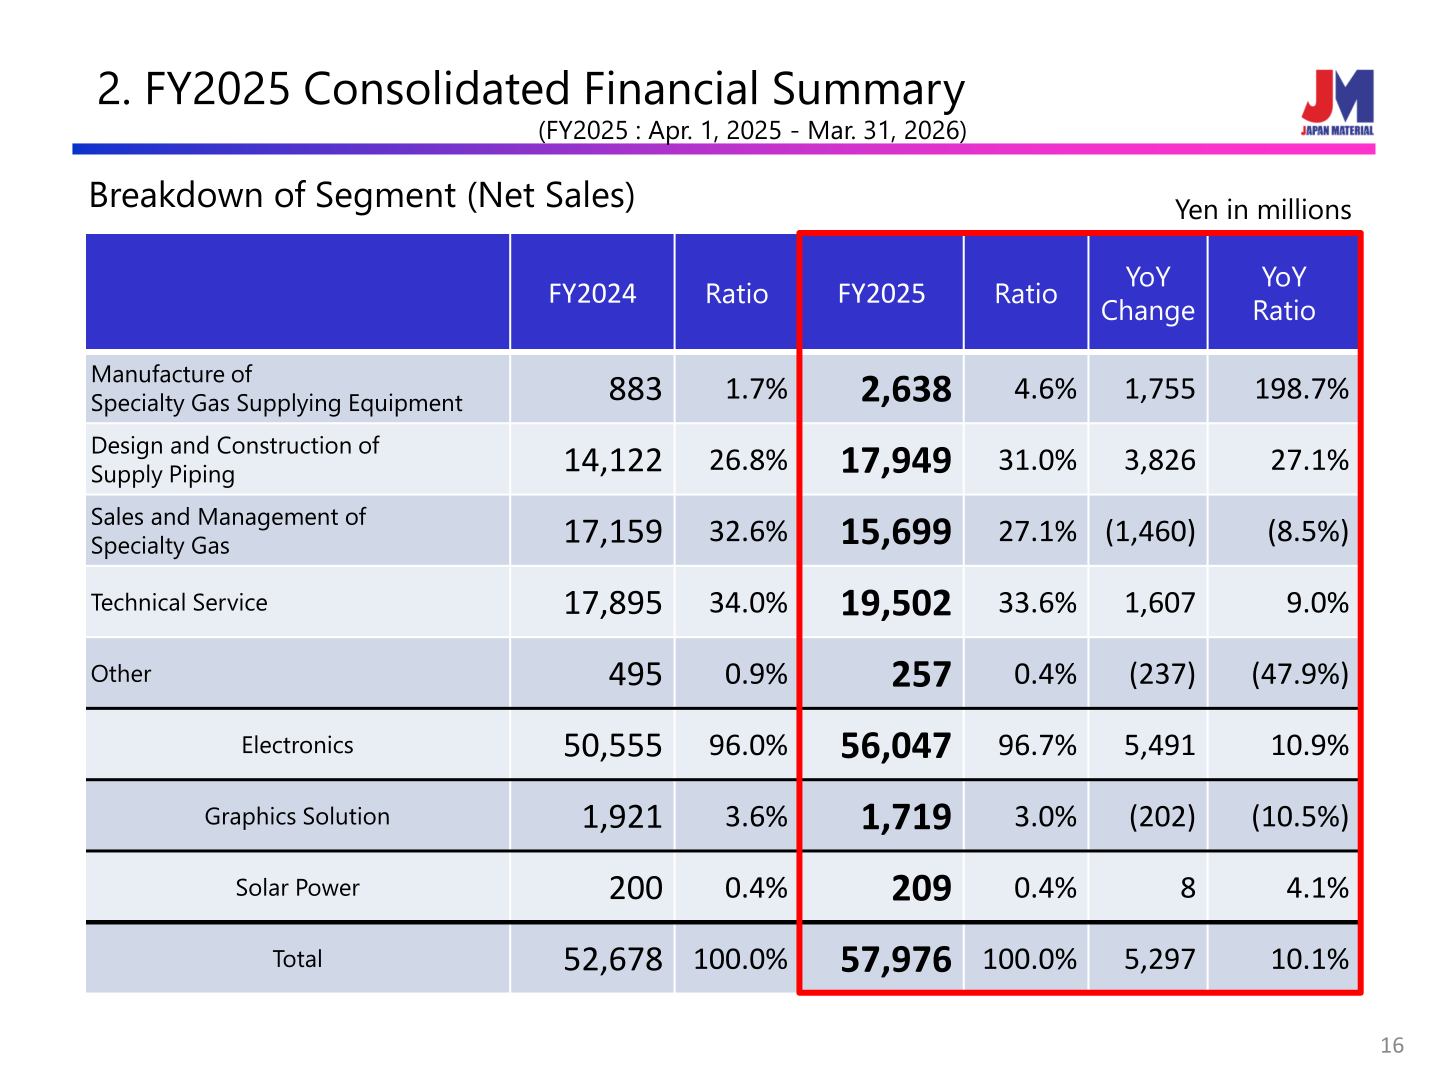
Electronics net sales rose 10.9% to 56,047 million yen, or 96.7% of the total. The company states that sales and profit increased versus FY2024 due to the expansion and continuation of capital investments at semiconductor plants, its main customers, in the initial divisions, and the high level of production activity that continued at NAND flash memory plants, its main customers, in addition to increased operations at the new semiconductor plant in the operations divisions. Graphics Solution sales fell 10.5% to 1,719 million yen, with sales and profit decreasing due to a decrease in projects such as broadcasting stations, despite the continuation of proactive sales activities mainly for digital signage products and graphics products such as video processors. Solar Power sales rose 4.1% to 209 million yen.
| Segment / Electronics breakdown (Yen in millions) | FY2024 | Ratio | FY2025 | Ratio | YoY Change | YoY Ratio |
|---|---|---|---|---|---|---|
| Manufacture of Specialty Gas Supplying Equipment | 883 | 1.7% | 2,638 | 4.6% | 1,755 | 198.7% |
| Design and Construction of Supply Piping | 14,122 | 26.8% | 17,949 | 31.0% | 3,826 | 27.1% |
| Sales and Management of Specialty Gas | 17,159 | 32.6% | 15,699 | 27.1% | (1,460) | (8.5%) |
| Technical Service | 17,895 | 34.0% | 19,502 | 33.6% | 1,607 | 9.0% |
| Other | 495 | 0.9% | 257 | 0.4% | (237) | (47.9%) |
| Electronics | 50,555 | 96.0% | 56,047 | 96.7% | 5,491 | 10.9% |
| Graphics Solution | 1,921 | 3.6% | 1,719 | 3.0% | (202) | (10.5%) |
| Solar Power | 200 | 0.4% | 209 | 0.4% | 8 | 4.1% |
| Total | 52,678 | 100.0% | 57,976 | 100.0% | 5,297 | 10.1% |
Financial Position and Cash Flows
Total assets stood at 75,373 million yen as of March 31, 2026, up 9,670 million yen (14.7%) from a year earlier. Cash and deposits increased 5,300 million yen (32.5%) to 21,618 million yen and notes and accounts receivable – trade, and contract assets rose 10.7% to 26,084 million yen. Net assets grew 15.8% to 63,217 million yen, or 83.9% of total liabilities and net assets, and short-term borrowings were nil in both periods.
Cash flows from operating activities were 9,605 million yen (FY2024: 14,195 million yen), reflecting items including depreciation of 1,257 million yen, income taxes paid of 4,130 million yen, an increase in trade receivables of 2,479 million yen and an increase in inventories of 1,347 million yen. Cash flows from investing activities were negative 6,419 million yen, mainly payment into time deposits of 8,948 million yen, and cash flows from financing activities were negative 2,560 million yen, mainly dividends paid of 2,466 million yen. Cash and cash equivalents at the end of the period were 15,648 million yen, up 702 million yen.
Among the major management indicators disclosed, EPS was 103.07 yen (FY2024: 76.62 yen), BPS was 609.54 yen, CAR was 83.1%, ROE was 18.1%, ROA was 15.0%, PER was 15.26 times, PBR was 2.58 times and market capitalization was 1,617 hundred million yen. The company notes that ROE as of March 31, 2026 is 18.1% and the average of the past five years is 17.0%, which steadily exceeded the cost of capital, and that PBR has constantly exceeded one time; it adds that it has not set specific targets for each indicator at this time.
FY2026 Forecast
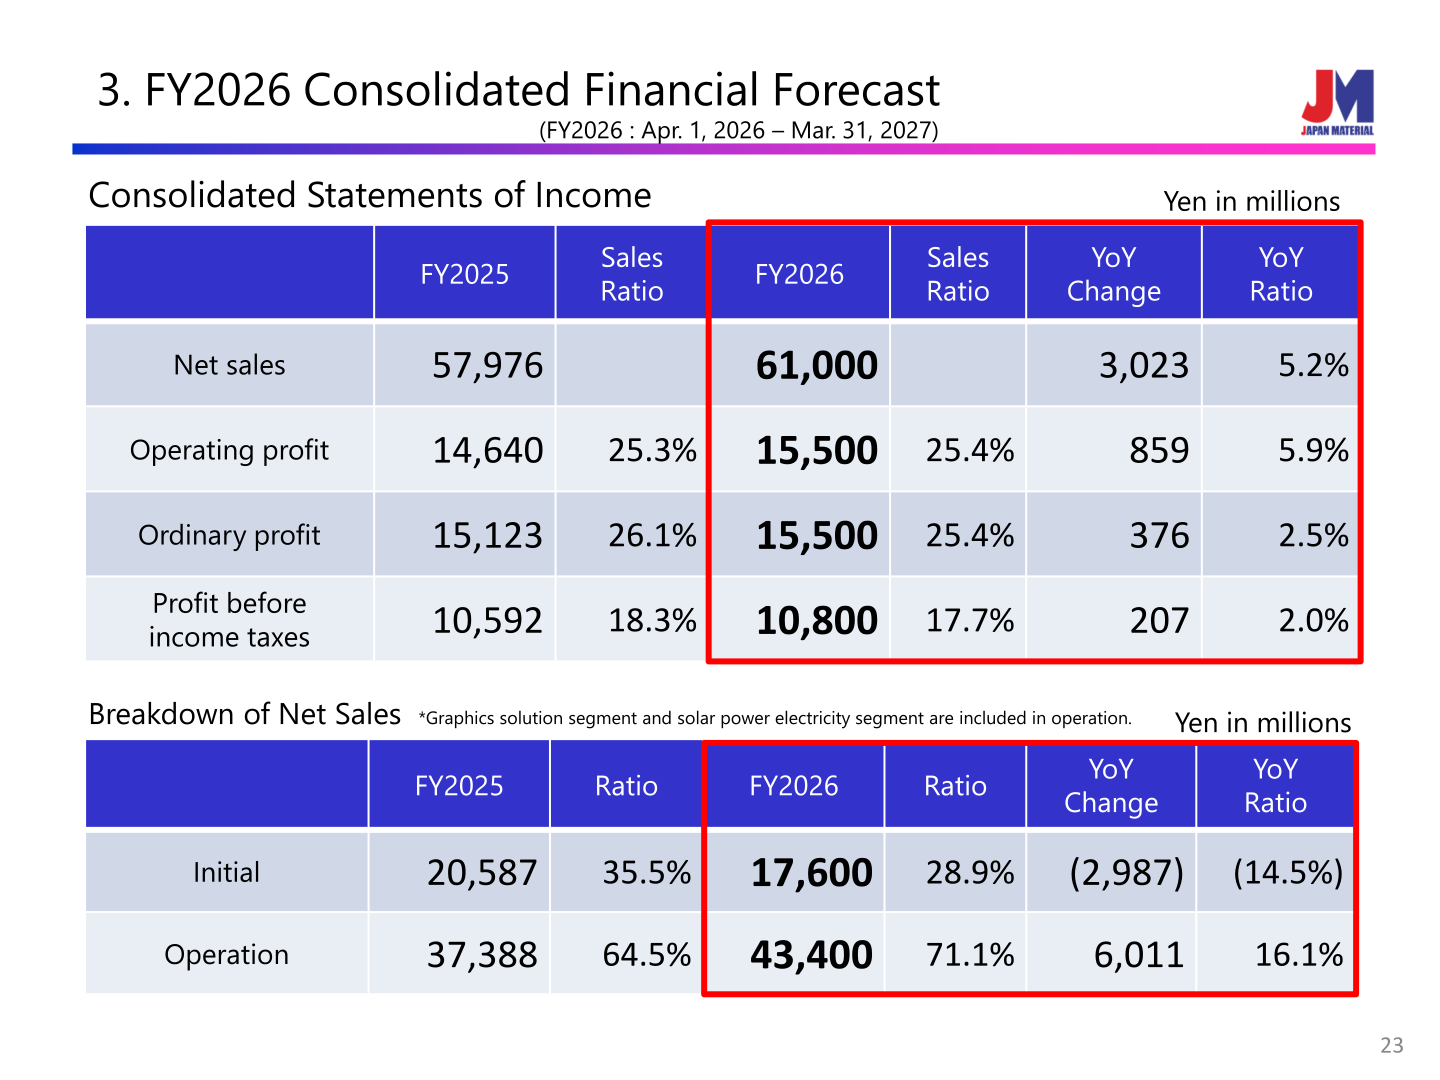
For FY2026 (April 1, 2026 – March 31, 2027) the company forecasts net sales of 61,000 million yen (+5.2%), operating profit of 15,500 million yen (+5.9%) and ordinary profit of 15,500 million yen (+2.5%). Within net sales, Initial is projected to decline 14.5% to 17,600 million yen (28.9% of the total) while Operation is projected to grow 16.1% to 43,400 million yen (71.1%).
| Item (Yen in millions) | FY2025 (Actual) | FY2026 (Forecast) | YoY Change | YoY Ratio |
|---|---|---|---|---|
| Net sales | 57,976 | 61,000 | 3,023 | 5.2% |
| Operating profit | 14,640 | 15,500 | 859 | 5.9% |
| Ordinary profit | 15,123 | 15,500 | 376 | 2.5% |
| Profit before income taxes | 10,592 | 10,800 | 207 | 2.0% |
| Initial (net sales) | 20,587 | 17,600 | (2,987) | (14.5%) |
| Operation (net sales) | 37,388 | 43,400 | 6,011 | 16.1% |
By segment, Electronics is forecast at 58,940 million yen (+5.2%), Graphics Solution at 1,860 million yen (+8.2%) and Solar Power at 200 million yen (-4.4%). Within Electronics, Sales and Management of Specialty Gas is forecast to grow 20.6% to 18,930 million yen and Technical Service 7.1% to 20,880 million yen, while Design and Construction of Supply Piping is forecast to fall 10.3% to 16,100 million yen and Manufacture of Specialty Gas Supplying Equipment to fall 43.1% to 1,500 million yen.
Shareholder Returns
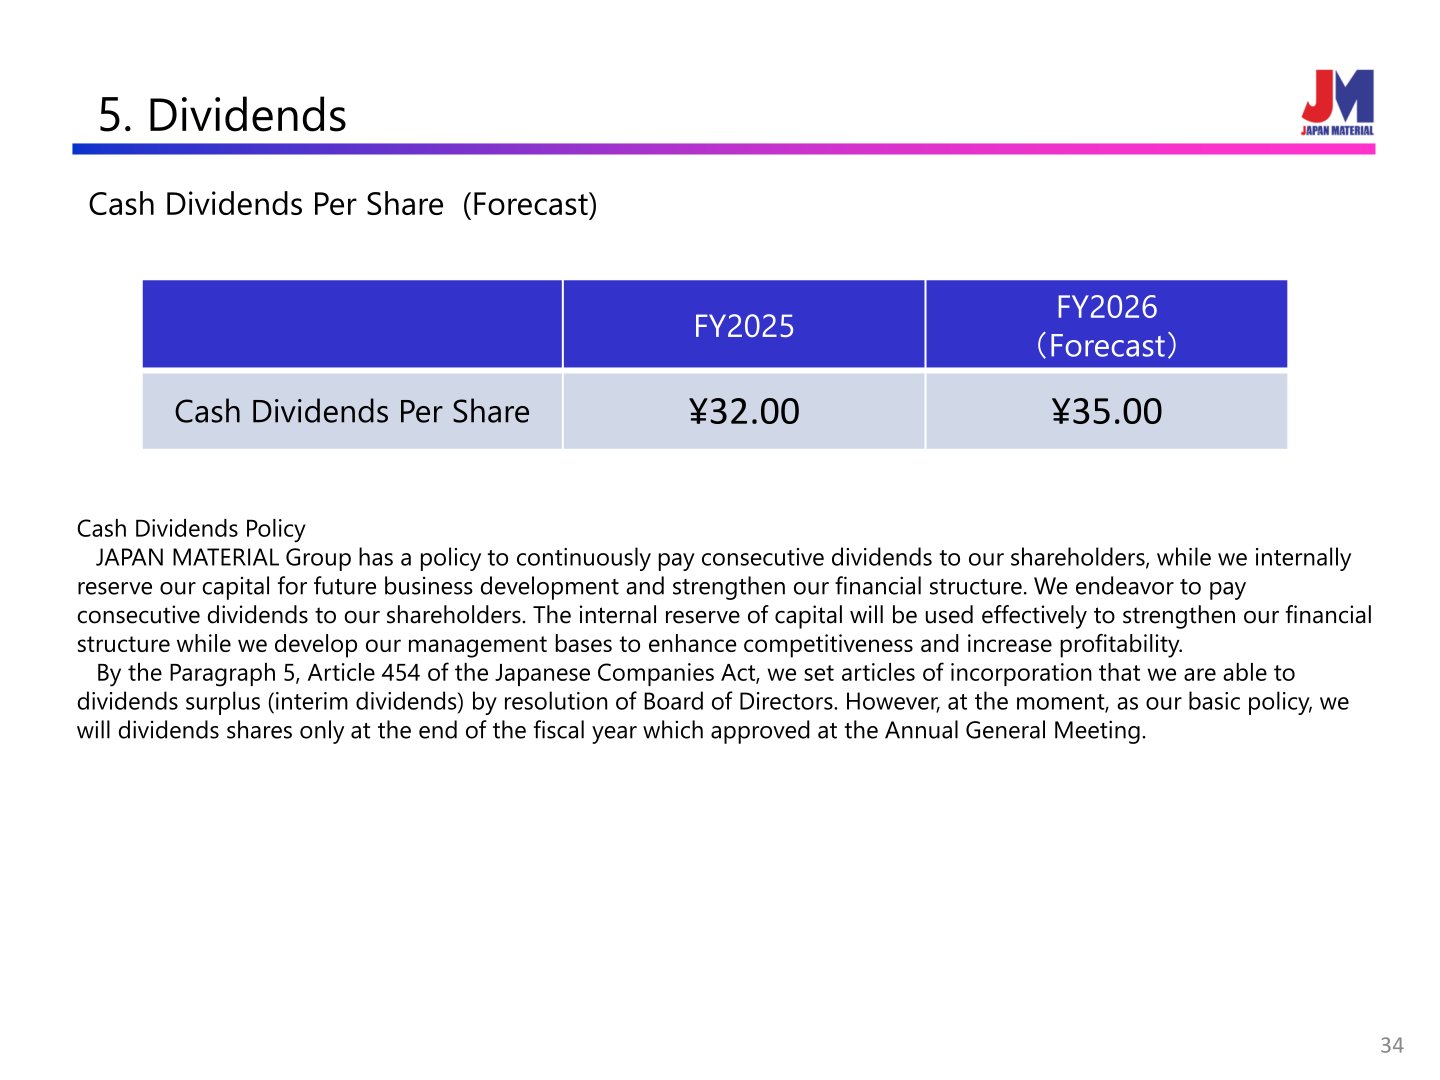
Cash dividends per share were 32.00 yen for FY2025, and the company forecasts 35.00 yen for FY2026. Its dividend policy is to continuously pay consecutive dividends to shareholders while internally reserving capital for future business development and to strengthen its financial structure; the internal reserve is to be used to strengthen the financial structure while developing management bases to enhance competitiveness and increase profitability. Although its articles of incorporation permit interim dividends by resolution of the Board of Directors under Paragraph 5, Article 454 of the Japanese Companies Act, the company’s basic policy at present is to pay dividends only at the end of the fiscal year, as approved at the Annual General Meeting.
Management Plans
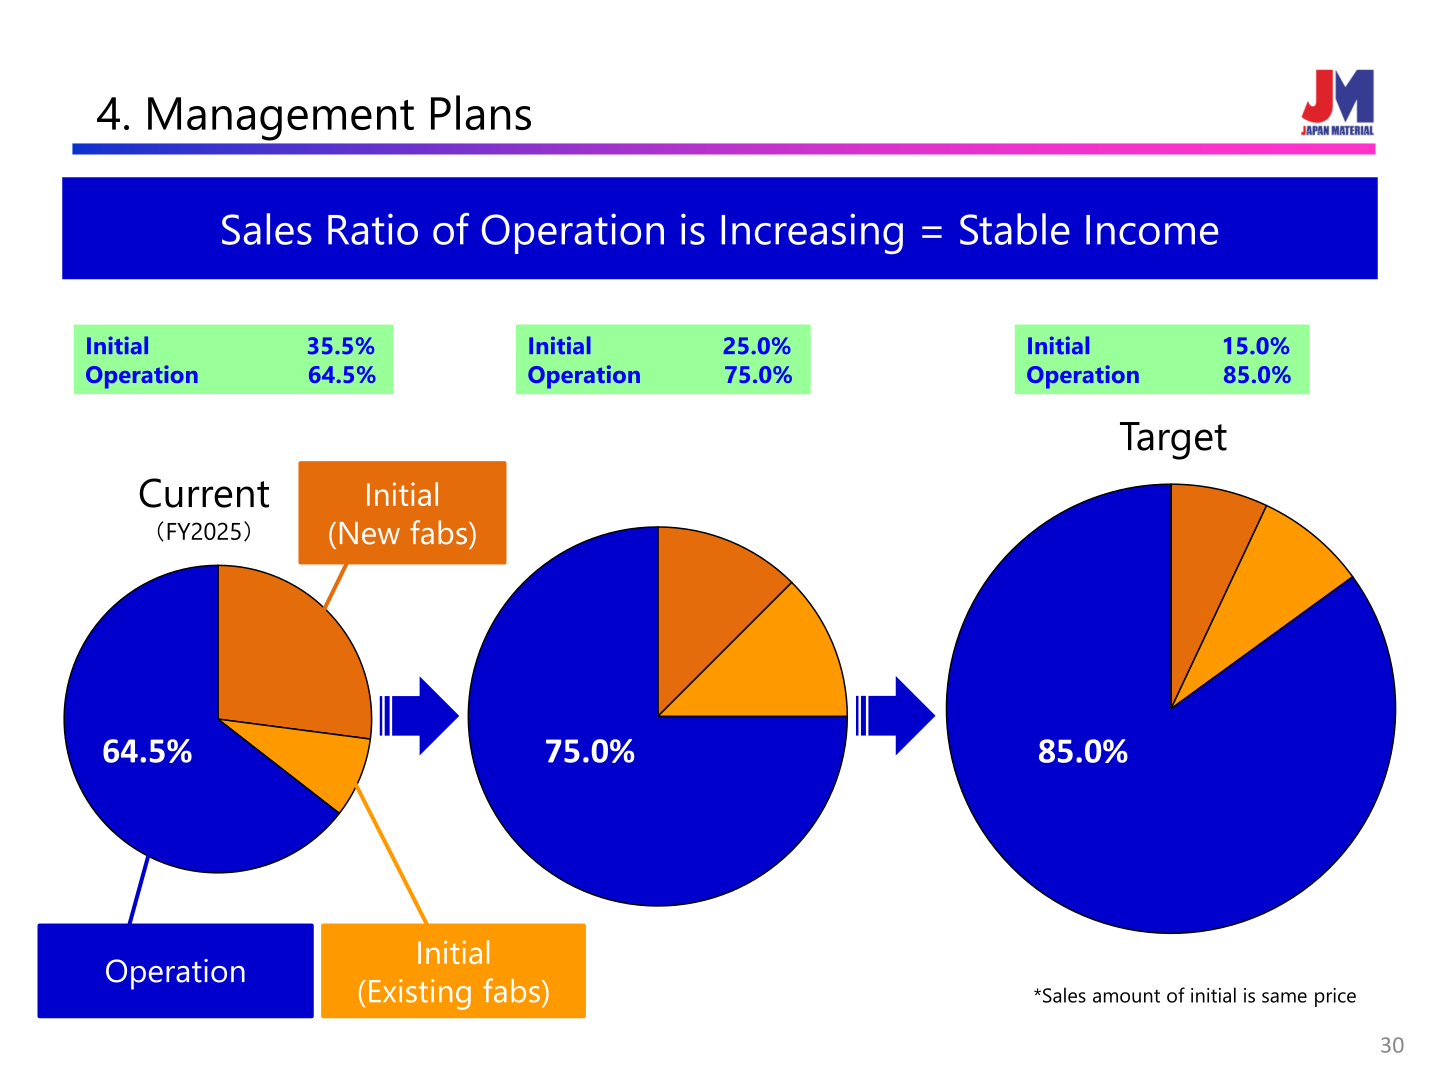
JAPAN MATERIAL Group positions its Operation division — comprehensive services at customers’ fabs including maintenance — as the stable basis of profit, explaining that each time it acquires a new client it builds a stable earning structure by piling up profits through continuous support of customers’ manufacturing fabs, and that it can continue to earn stable income as long as those fabs keep manufacturing, even if capital investment at customers’ fabs decreases with the market trend.
The company shows a shift in the sales mix from the current FY2025 level of Initial 35.5% / Operation 64.5% toward Initial 25.0% / Operation 75.0%, and a target of Initial 15.0% / Operation 85.0%, on the assumption that the sales amount of initial work is unchanged. Its stated priorities are to expand market share using TFM (Total Facility Management) and maintenance skills for preventive maintenance service — increasing orders from current clients’ fabs, enhancing business for new NAND fabs and DRAM fabs, and expanding into the Kyushu and Hokkaido areas of Japan; to expand specialty gas sales activities by promoting sales to new clients’ fabs both in Japan and overseas and stably supplying specialty gases; and to enhance graphics solutions by increasing digital signage sales and expanding the “Bright Sign” network services.
This article is an analysis based on publicly available information and is not a recommendation to buy or sell any specific securities. Investment decisions are your own responsibility.
![[Obayashi] Investors’ Guide 2026 — The Complete 24-Article Breakdown](https://japan-equity.com/wp-content/uploads/2026/07/hub_cover-1024x1024.png)
![[Obayashi] IR & SR Policy — Feeding Dialogue Back into Management](https://japan-equity.com/wp-content/uploads/2026/07/p32_sq-1024x1024.jpg)
![[Obayashi] Real Estate Development — 18.7% Margin, ¥287.7bn Unrealized Gains](https://japan-equity.com/wp-content/uploads/2026/07/p20_sq-1024x1024.jpg)
![[Obayashi] Domestic Civil Engineering — Resilience Spending Supports 9.6% Margin](https://japan-equity.com/wp-content/uploads/2026/07/p11_sq-1024x1024.jpg)
![[Obayashi] Share Price & External Ratings — vs TOPIX, ESG Index Inclusion](https://japan-equity.com/wp-content/uploads/2026/07/p40_sq-1024x1024.jpg)
![[Construction] ¥75.5tn Investment, Shrinking Workforce — Big-5 Market Share](https://japan-equity.com/wp-content/uploads/2026/07/p12_sq-1024x1024.jpg)



![[Obayashi] Capital Policy & Shareholder Returns — ROE 10%+, DOE ~5%, ¥100bn Buyback](https://japan-equity.com/wp-content/uploads/2026/07/p27_sq-1024x1024.jpg)
![[Obayashi] Reducing Cross-Shareholdings — ¥285.2bn Sold in Five Years](https://japan-equity.com/wp-content/uploads/2026/07/p29_sq-1024x1024.jpg)
![[Obayashi] ¥750bn Investment Plan — ¥300bn to Development, ¥190bn to Tech/DX](https://japan-equity.com/wp-content/uploads/2026/07/p30_sq-1024x1024.jpg)
![[Obayashi] MTP2022 KPIs — Operating Profit ~2x Target, ROE 14.4%](https://japan-equity.com/wp-content/uploads/2026/07/p25_sq-1024x1024.jpg)
![[Obayashi] Cash Allocation — ¥420bn Investment CF Over Five Years](https://japan-equity.com/wp-content/uploads/2026/07/p26_sq-1024x1024.jpg)
![[Obayashi] Green Energy — 44 Plants, 344MW, and the Green Hydrogen Challenge](https://japan-equity.com/wp-content/uploads/2026/07/p21_sq-1024x1024.jpg)
![[Obayashi] Tackling the Labor Shortage — Robotics Construction®](https://japan-equity.com/wp-content/uploads/2026/07/p14_sq-1024x1024.jpg)
