
This article is based on publicly available IR materials and is not a recommendation to buy or sell any specific securities.
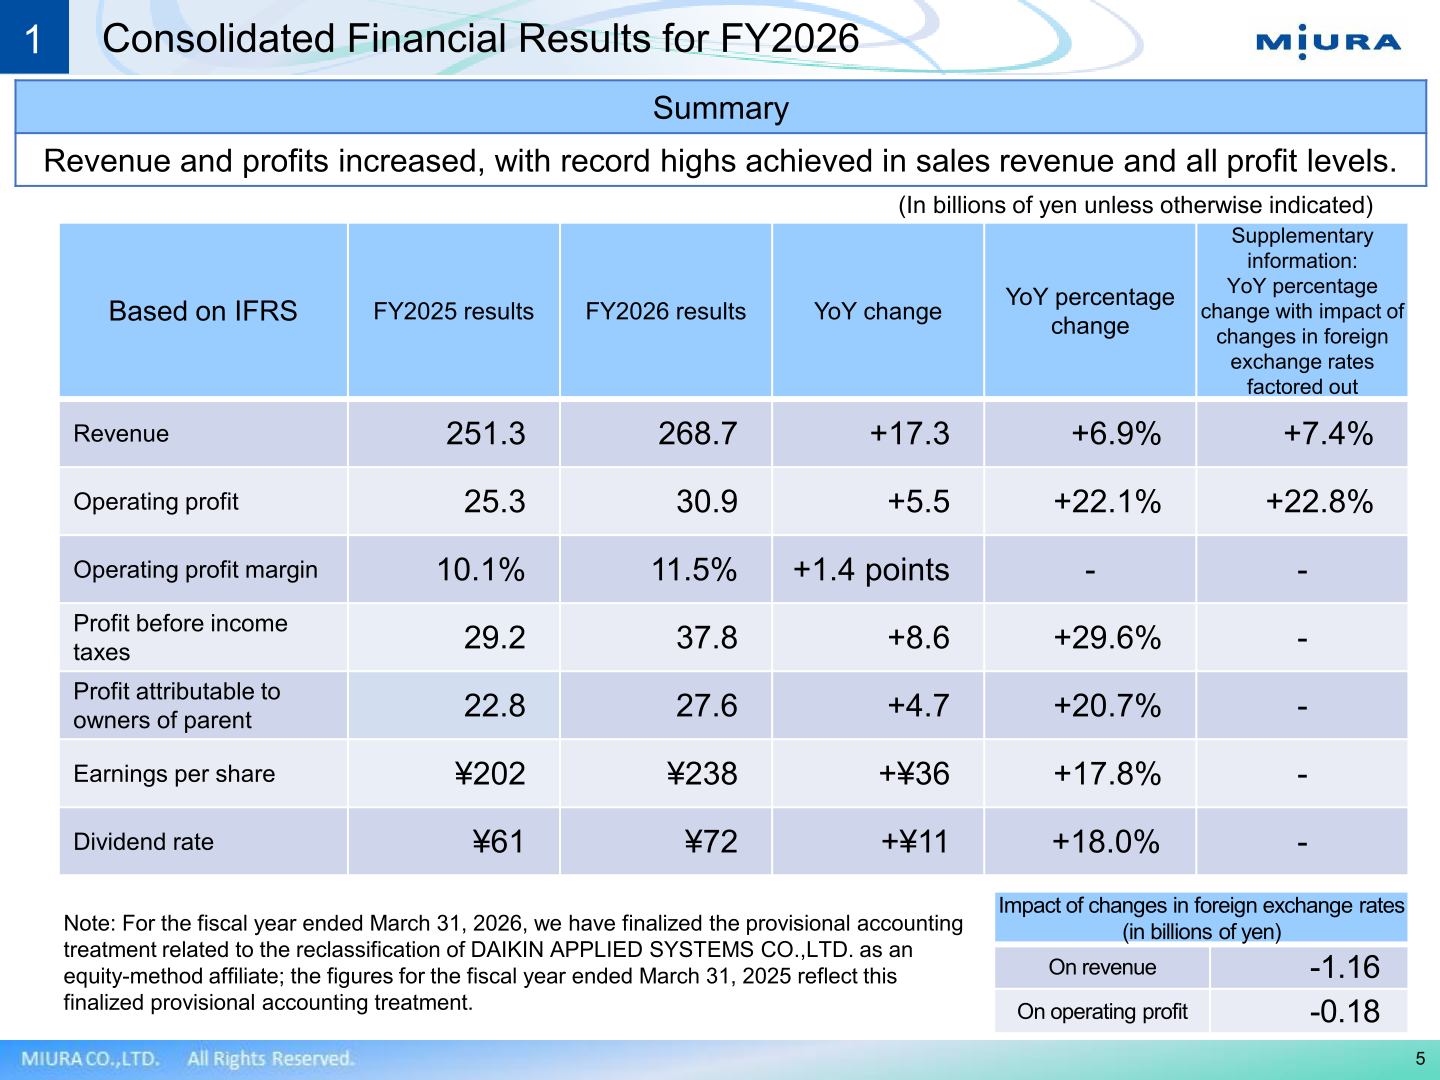
Note: Miura’s fiscal year ends on March 31. The company labels the fiscal year ended March 31, 2026 as “FY2026” and the fiscal year ending March 31, 2027 as “FY2027”; the text and tables below keep the company’s own labels. For FY2026 (the fiscal year ended March 31, 2026), MIURA CO., LTD. reported IFRS-based revenue of 268.7 billion yen (up 17.3 billion yen, +6.9% year on year) and operating profit of 30.9 billion yen (up 5.5 billion yen, +22.1%), with record highs achieved in sales revenue and all profit levels. Profit attributable to owners of parent rose to 27.6 billion yen (+20.7%), and the annual dividend was raised to 72 yen from 61 yen. Alongside the results, the company updated its capital allocation policy to prioritize growth investments, aiming for an EPS growth rate of at least 33% over the next three years, and presented a detailed review of the challenges at U.S. subsidiary Cleaver-Brooks.
Consolidated Results (Full-Year Actual)
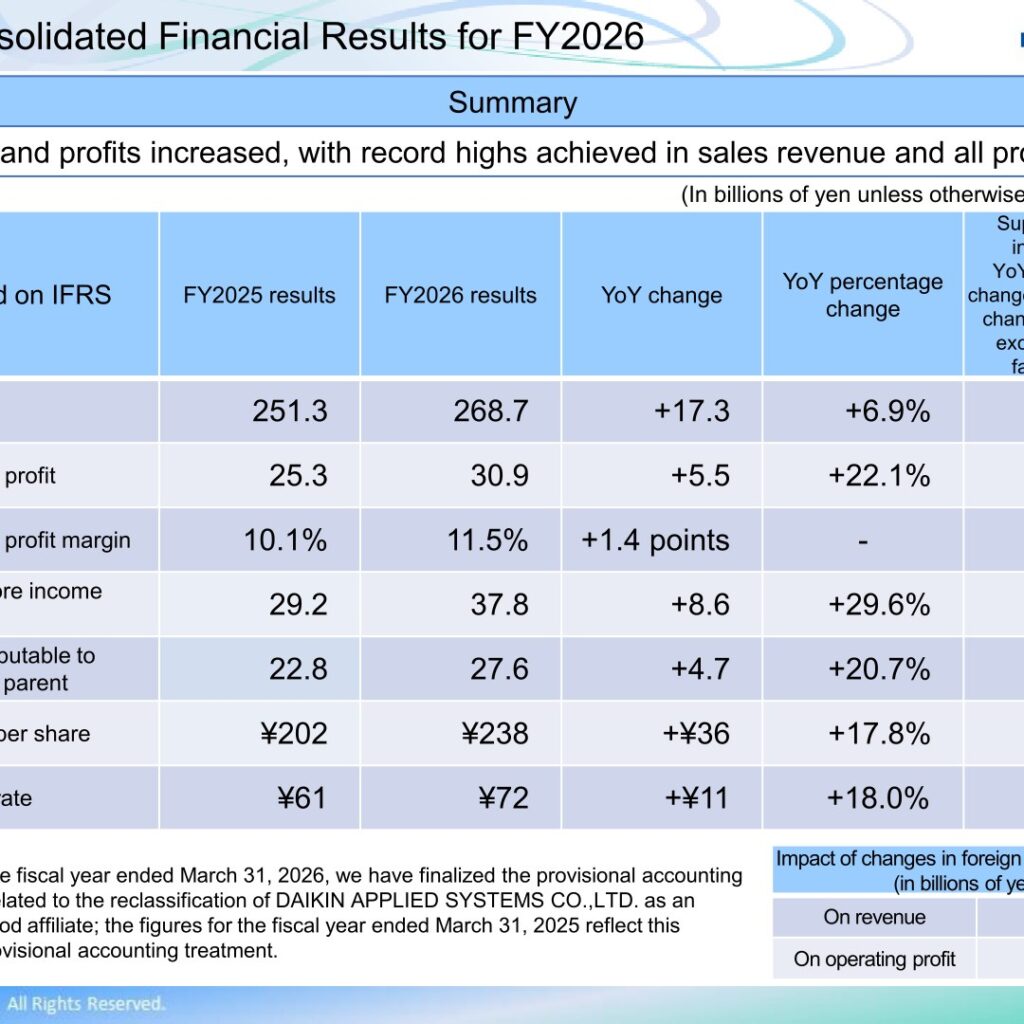
Revenue for FY2026 was 268.7 billion yen, up 17.3 billion yen (+6.9%) from 251.3 billion yen in FY2025; with the impact of changes in foreign exchange rates factored out, the increase was +7.4%. Operating profit increased 22.1% to 30.9 billion yen (+22.8% excluding foreign exchange effects), lifting the operating profit margin by 1.4 points to 11.5%. Profit before income taxes rose 29.6% to 37.8 billion yen and profit attributable to owners of parent increased 20.7% to 27.6 billion yen. Earnings per share were ¥238, up ¥36 (+17.8%). Changes in foreign exchange rates had an impact of -1.16 billion yen on revenue and -0.18 billion yen on operating profit. The company notes that for the fiscal year ended March 31, 2026 it finalized the provisional accounting treatment related to the reclassification of DAIKIN APPLIED SYSTEMS CO.,LTD. as an equity-method affiliate, and the figures for the fiscal year ended March 31, 2025 reflect this finalized treatment.
| Item (Billion Yen, IFRS) | FY2025 Results | FY2026 Results | YoY Change | YoY % Change |
|---|---|---|---|---|
| Revenue | 251.3 | 268.7 | +17.3 | +6.9% |
| Operating profit | 25.3 | 30.9 | +5.5 | +22.1% |
| Operating profit margin | 10.1% | 11.5% | +1.4 points | – |
| Profit before income taxes | 29.2 | 37.8 | +8.6 | +29.6% |
| Profit attributable to owners of parent | 22.8 | 27.6 | +4.7 | +20.7% |
| Earnings per share | ¥202 | ¥238 | +¥36 | +17.8% |
| Dividend rate | ¥61 | ¥72 | +¥11 | +18.0% |
In the breakdown of the year-on-year change in operating profit (+5.6 billion yen from 25.3 billion yen to 30.9 billion yen), gross profit from operations in Japan increased by 5.1 billion yen, while personnel expenses and other SG&A in Japan rose by 4.0 billion yen; the company states that although personnel and other expenses increased in Japan, profits rose due to the expansion of its total solutions offerings. In the Americas, gross profit margin declined (-0.5 billion yen) and SG&A increased (-1.5 billion yen), with profit falling due to rising raw material prices, changes in the sales mix, and increased personnel expenses. In Asia and Others, gross profit rose by 0.9 billion yen but SG&A increased by 1.0 billion yen, so profits declined despite higher revenue. A decrease in corporate M&A expenses contributed +5.6 billion yen, and other factors +1.0 billion yen.
Segment Results
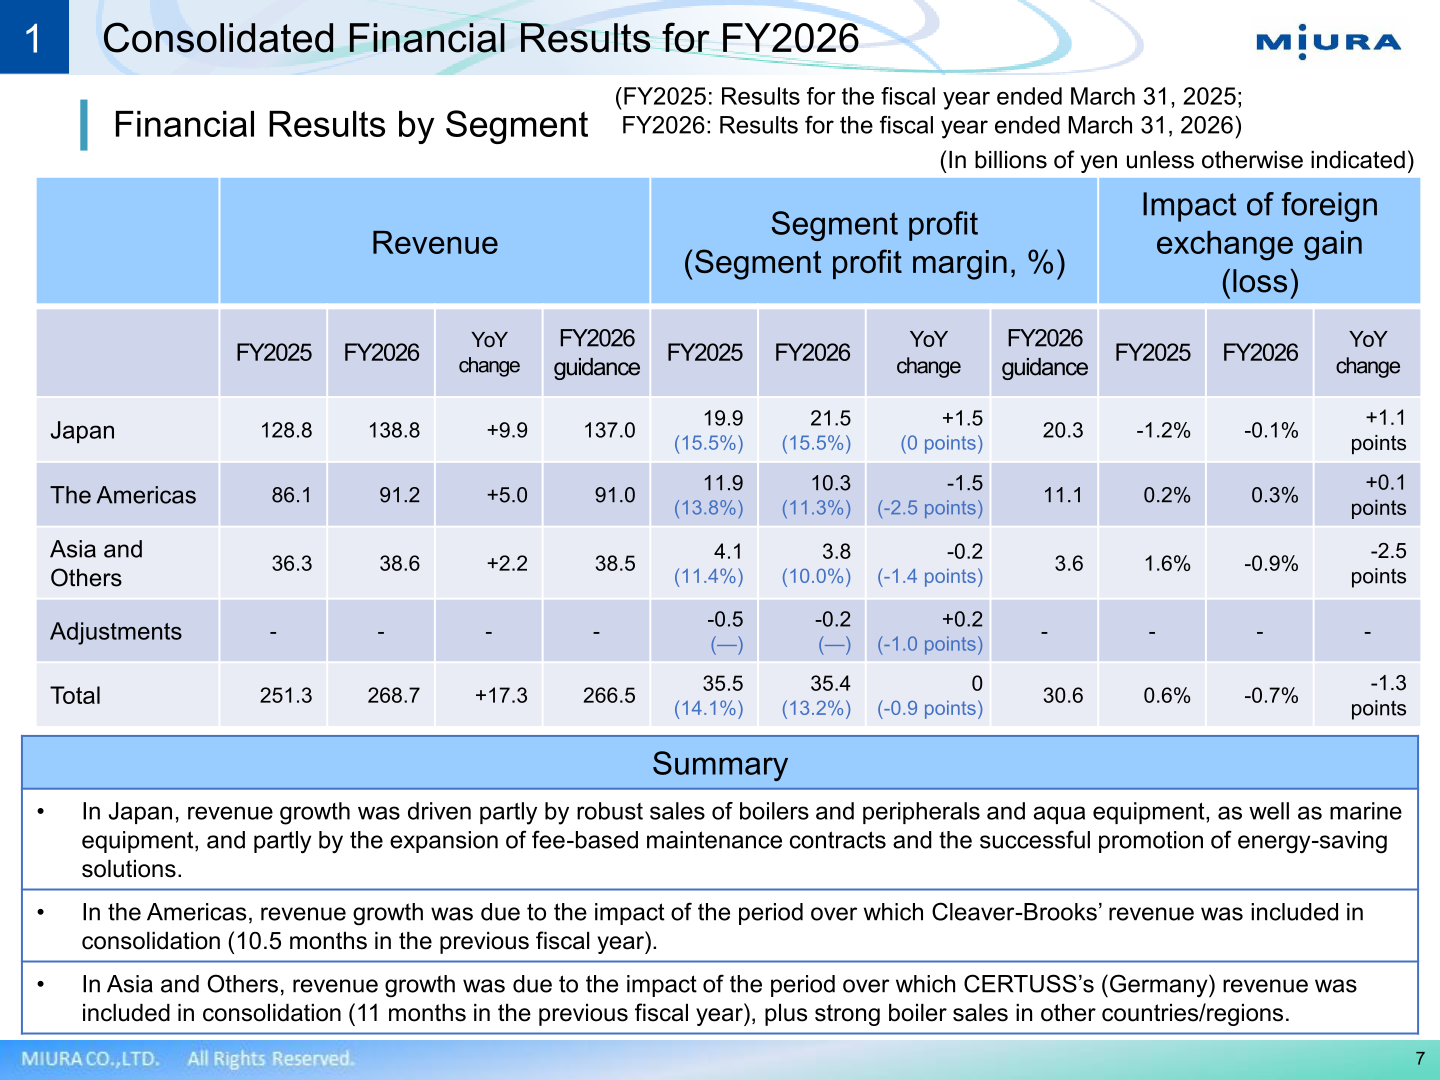
In Japan, revenue rose 9.9 billion yen to 138.8 billion yen (against FY2026 guidance of 137.0 billion yen) and segment profit increased 1.5 billion yen to 21.5 billion yen with the margin unchanged at 15.5%. The company attributes revenue growth partly to robust sales of boilers and peripherals and aqua equipment, as well as marine equipment, and partly to the expansion of fee-based maintenance contracts and the successful promotion of energy-saving solutions. In the Americas, revenue grew 5.0 billion yen to 91.2 billion yen due to the impact of the period over which Cleaver-Brooks’ revenue was included in consolidation (10.5 months in the previous fiscal year), but segment profit fell 1.5 billion yen to 10.3 billion yen and the margin declined 2.5 points to 11.3%. In Asia and Others, revenue rose 2.2 billion yen to 38.6 billion yen on the consolidation period of CERTUSS (Germany) (11 months in the previous fiscal year) plus strong boiler sales in other countries/regions, while segment profit slipped 0.2 billion yen to 3.8 billion yen (margin 10.0%). Total segment profit was 35.4 billion yen (13.2%), essentially flat against 35.5 billion yen (14.1%) a year earlier.
| Segment (Billion Yen) | Revenue FY2025 | Revenue FY2026 | Revenue YoY | FY2026 Revenue Guidance | Segment Profit FY2025 (Margin) | Segment Profit FY2026 (Margin) | Segment Profit YoY | FY2026 Profit Guidance |
|---|---|---|---|---|---|---|---|---|
| Japan | 128.8 | 138.8 | +9.9 | 137.0 | 19.9 (15.5%) | 21.5 (15.5%) | +1.5 (0 points) | 20.3 |
| The Americas | 86.1 | 91.2 | +5.0 | 91.0 | 11.9 (13.8%) | 10.3 (11.3%) | -1.5 (-2.5 points) | 11.1 |
| Asia and Others | 36.3 | 38.6 | +2.2 | 38.5 | 4.1 (11.4%) | 3.8 (10.0%) | -0.2 (-1.4 points) | 3.6 |
| Adjustments | – | – | – | – | -0.5 | -0.2 | +0.2 | – |
| Total | 251.3 | 268.7 | +17.3 | 266.5 | 35.5 (14.1%) | 35.4 (13.2%) | 0 (-0.9 points) | 30.6 |
In the appendix, revenue from operations in Japan by business line for FY2026 was 79.8 billion yen for Boiler (58% of the total), 12.7 billion yen for Water treatment (9%), 15.2 billion yen for Ship machinery (11%), 16.6 billion yen for Food-processing and medical equipment (12%) and 14.5 billion yen for Others including laundry equipment, special-purpose equipment, environmental solutions and new businesses (10%), for a total of 138.8 billion yen. By region, revenue was 138.8 billion yen in Japan, 12.8 billion yen in the Americas (excluding C-B), 77.8 billion yen at C-B, 11.7 billion yen in South Korea, 11.8 billion yen in China, 8.7 billion yen in other Asian countries and 7.1 billion yen in Europe.
Status of Cleaver-Brooks
The company devoted a section of the briefing to U.S. subsidiary Cleaver-Brooks. For the fiscal year ended March 31, 2026, Cleaver-Brooks’ revenue was 534 million dollars against a budget of 585 million dollars, with the shortfall attributed to a reduction in units sold (-25), a reduction in CBSS (-24) and a shortfall in price increase (-2), partly offset by product mix improvement (+13). Operating profit was 63 million dollars against a budget of 81 million dollars, reflecting an increase in management costs (-9), reduction in units sold (-8), reduction in CBSS (-8), product warranties (-6), tariffs (-5) and raw materials (-3), partly offset by a review of selling expenses (+8). Order intake for the 2025 calendar year totaled 494.5 million dollars (-4.0% YoY, -14.6% vs. guidance); Packaged Boiler orders rose 16.7% to 237.0 million dollars and Life Asset Management rose 6.8% to 116.0 million dollars, while Industrial Watertube fell 47.6% to 45.4 million dollars and CBSS total fell 29.1% to 69.1 million dollars. The company explains that the CBSS decline stems from short-term efficiency measures implemented under private-equity ownership that undermined organizational stability, including a change to the sales model (GM model), tightened purchase order rules, changes to the commission system and multiple rounds of layoffs, leading to a high turnover rate (approx. 35% of talent). Its response includes rebuilding customer touchpoints centered on the GM model, with a top-priority KPI of raising the touchpoint rate among Cleaver-Brooks users from over 20% to at least 50%, expanding Planned Maintenance and Boiler Plant Optimization (BPO) services, opening the Cleaver-Brooks Academy in the fall of 2026, and investing in quality and in-house production, process integration and automation. On tariffs, the company notes that the IEEPA tariffs were eliminated in February 2026, the new Section 122 (10%) has been introduced, and Section 232 was strengthened in April 2026, so that from the fiscal year ending March 31, 2027 tariffs will have a lasting impact on the cost structure rather than being a temporary cost.
| Cleaver-Brooks Orders, 2025 Calendar Year (Million Dollars) | Amount | YoY | Vs. Guidance |
|---|---|---|---|
| Cleaver-Brooks total | 494.5 | -4.0% | -14.6% |
| Packaged Boiler | 237.0 | +16.7% | -1.8% |
| Industrial Watertube | 45.4 | -47.6% | -43.3% |
| Life Asset Management | 116.0 | +6.8% | -3.2% |
| CBSS total | 69.1 | -29.1% | -36.4% |
| — Local Service | 29.0 | -22.3% | -29.1% |
| — Projects | 9.2 | -63.6% | -71.4% |
FY2027 Forecast and Medium-Term Management Plan
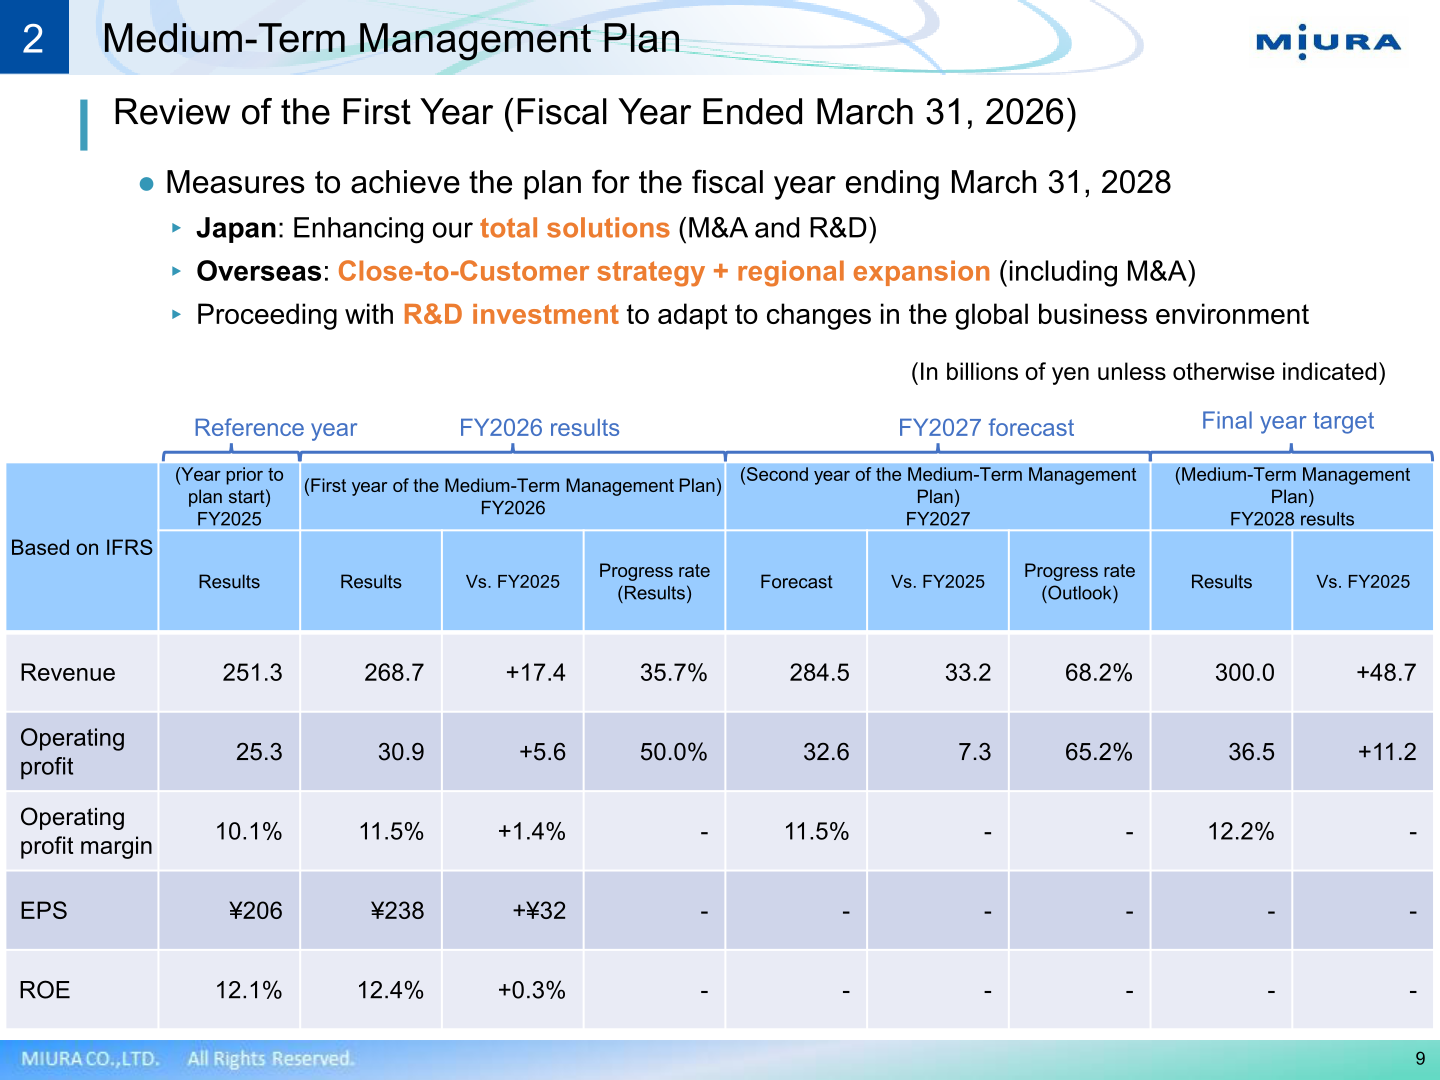
FY2026 was the first year of the Medium-Term Management Plan, whose final-year (FY2028) targets are revenue of 300.0 billion yen, operating profit of 36.5 billion yen and an operating profit margin of 12.2%. Against the reference year FY2025, revenue progress after the first year was 35.7% and operating profit progress was 50.0%. For FY2027 (the fiscal year ending March 31, 2027), the company forecasts revenue of 284.5 billion yen and operating profit of 32.6 billion yen with an operating profit margin of 11.5%, which would bring progress toward the plan to 68.2% for revenue and 65.2% for operating profit. ROE was 12.4% in FY2026 against 12.1% in FY2025. Measures to achieve the plan are enhancing total solutions in Japan (M&A and R&D), a Close-to-Customer strategy plus regional expansion overseas (including M&A), and proceeding with R&D investment to adapt to changes in the global business environment. By reclassified segment, the FY2027 revenue forecast is 144.0 billion yen for Japan, 98.0 billion yen for the Americas and 42.5 billion yen for Asia and Others, with segment profit forecasts of 22.0 billion yen (15.3%), 10.8 billion yen (11.0%) and 4.3 billion yen (10.1%) respectively, for a subtotal of 37.1 billion yen (13.0%). The FY2027 forecast assumes exchange rates of 155.00 yen to the U.S. dollar and 180.00 yen to the euro.
| Item (Billion Yen, IFRS) | FY2025 (Reference Year) | FY2026 Results | FY2027 Forecast | FY2028 Plan (Final Year Target) |
|---|---|---|---|---|
| Revenue | 251.3 | 268.7 | 284.5 | 300.0 |
| Operating profit | 25.3 | 30.9 | 32.6 | 36.5 |
| Operating profit margin | 10.1% | 11.5% | 11.5% | 12.2% |
| EPS | ¥206 | ¥238 | – | – |
| ROE | 12.1% | 12.4% | – | – |
Under its updated capital allocation policy, the company states that, under a financial discipline that targets an equity ratio of 50%, it prioritizes growth investments aimed at driving business growth and adapting to changes in the business environment, and that based on a policy of stable dividends with a target dividend payout ratio of 30%, it aims to optimize capital allocation, including shareholder returns that take into account surplus funds and its financial position. The company reaffirmed its vision of being a customer-focused total solutions provider that continues to grow globally through a virtuous cycle of equipment sales, recurring revenue generation, and expansion into new service areas, with the goal of maximizing customer lifetime value (LTV).
Shareholder Returns
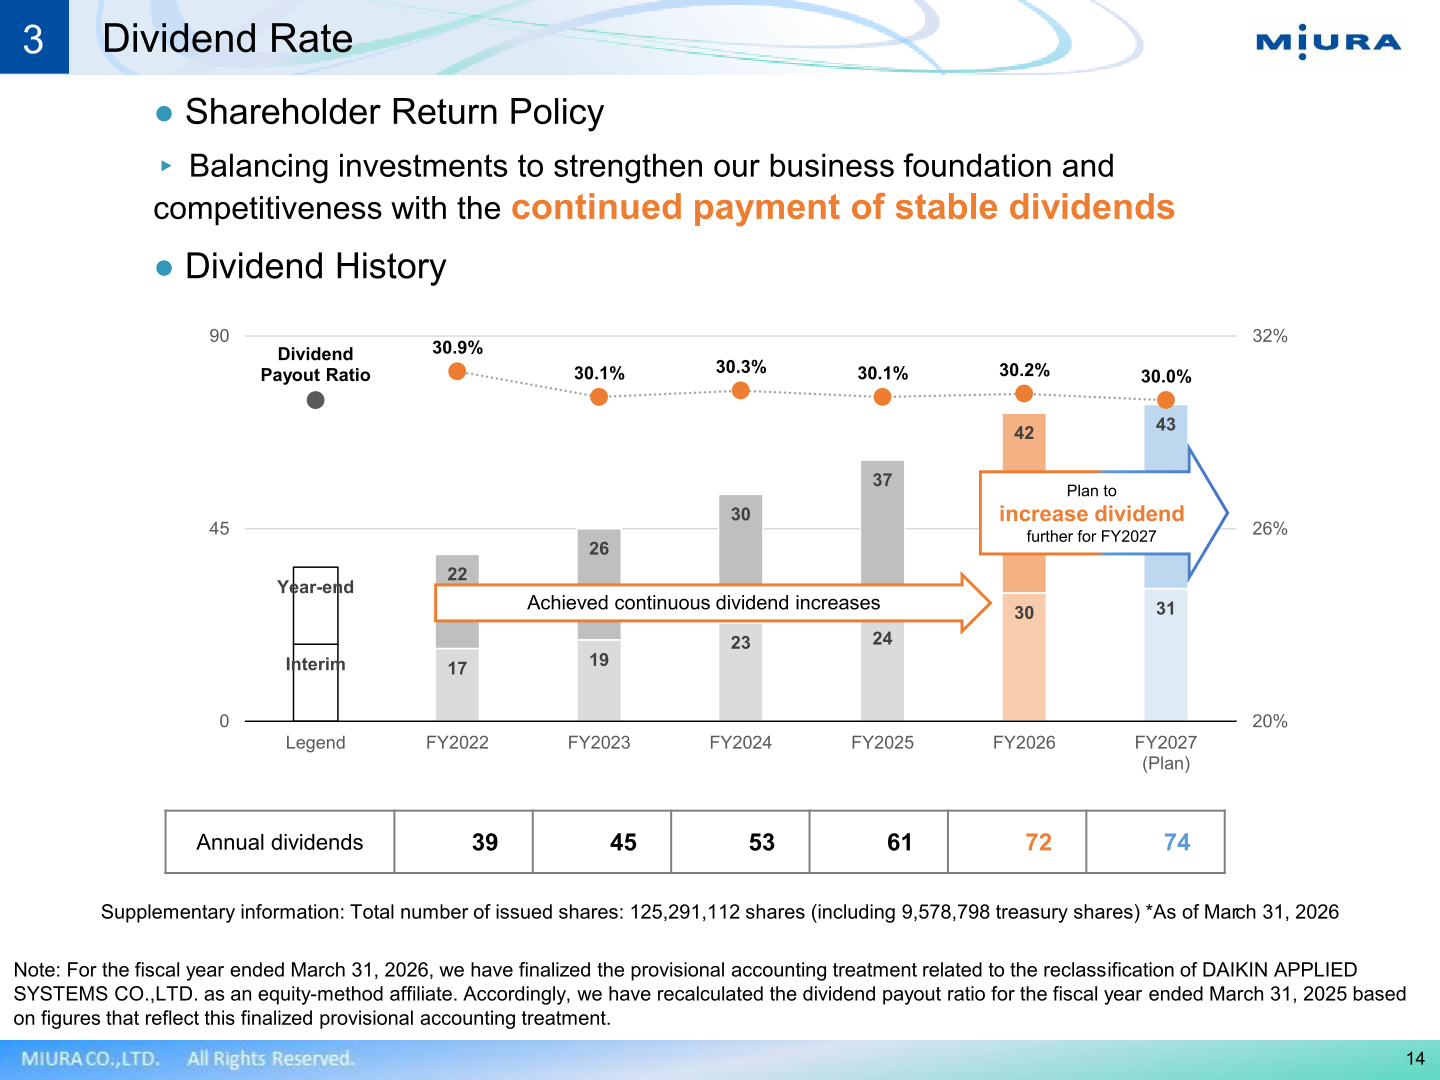
The shareholder return policy is to balance investments to strengthen the business foundation and competitiveness with the continued payment of stable dividends. The annual dividend for FY2026 was 72 yen per share (interim 30 yen, year-end 42 yen), up from 61 yen in FY2025, with a dividend payout ratio of 30.2%. For FY2027 the company plans to increase the dividend further to 74 yen (interim 31 yen, year-end 43 yen), with a payout ratio of 30.0%, continuing its record of continuous dividend increases. The total number of issued shares as of March 31, 2026 was 125,291,112 shares (including 9,578,798 treasury shares).
| Item | FY2022 | FY2023 | FY2024 | FY2025 | FY2026 | FY2027 (Plan) |
|---|---|---|---|---|---|---|
| Interim dividend (yen) | 17 | 19 | 23 | 24 | 30 | 31 |
| Year-end dividend (yen) | 22 | 26 | 30 | 37 | 42 | 43 |
| Annual dividends (yen) | 39 | 45 | 53 | 61 | 72 | 74 |
| Dividend payout ratio | 30.9% | 30.1% | 30.3% | 30.1% | 30.2% | 30.0% |
Balance Sheet and Cash Flows
Total assets stood at 476.4 billion yen as of March 31, 2026, up 37.2 billion yen from 439.1 billion yen a year earlier, with cash and cash equivalents of 69.0 billion yen (+13.7 billion yen). Total liabilities decreased 1.9 billion yen to 231.8 billion yen and total equity increased 39.2 billion yen to 244.5 billion yen. Cash flows from operating activities were 42.4 billion yen (+8.3 billion yen), reflecting increases in profit before income taxes and depreciation and amortization. Cash flows from investing activities were an outflow of 7.2 billion yen (against an outflow of 134.6 billion yen in FY2025), and cash flows from financing activities were an outflow of 24.2 billion yen (against an inflow of 119.7 billion yen), reflecting repayments of long-term borrowings and dividends paid. Free cash flows for FY2026 were 35,213 million yen. Capital expenditures (right-of-use assets not included) were 5,102 million yen, depreciation and amortization 13,663 million yen and research and development expenses 5,117 million yen.
This article is an analysis based on publicly available information and is not a recommendation to buy or sell any specific securities. Investment decisions are your own responsibility.
![[Obayashi] Investors’ Guide 2026 — The Complete 24-Article Breakdown](https://japan-equity.com/wp-content/uploads/2026/07/hub_cover-1024x1024.png)
![[Obayashi] IR & SR Policy — Feeding Dialogue Back into Management](https://japan-equity.com/wp-content/uploads/2026/07/p32_sq-1024x1024.jpg)
![[Obayashi] Real Estate Development — 18.7% Margin, ¥287.7bn Unrealized Gains](https://japan-equity.com/wp-content/uploads/2026/07/p20_sq-1024x1024.jpg)
![[Obayashi] Domestic Civil Engineering — Resilience Spending Supports 9.6% Margin](https://japan-equity.com/wp-content/uploads/2026/07/p11_sq-1024x1024.jpg)
![[Obayashi] Share Price & External Ratings — vs TOPIX, ESG Index Inclusion](https://japan-equity.com/wp-content/uploads/2026/07/p40_sq-1024x1024.jpg)
![[Construction] ¥75.5tn Investment, Shrinking Workforce — Big-5 Market Share](https://japan-equity.com/wp-content/uploads/2026/07/p12_sq-1024x1024.jpg)



![[Obayashi] Capital Policy & Shareholder Returns — ROE 10%+, DOE ~5%, ¥100bn Buyback](https://japan-equity.com/wp-content/uploads/2026/07/p27_sq-1024x1024.jpg)
![[Obayashi] Reducing Cross-Shareholdings — ¥285.2bn Sold in Five Years](https://japan-equity.com/wp-content/uploads/2026/07/p29_sq-1024x1024.jpg)
![[Obayashi] ¥750bn Investment Plan — ¥300bn to Development, ¥190bn to Tech/DX](https://japan-equity.com/wp-content/uploads/2026/07/p30_sq-1024x1024.jpg)
![[Obayashi] MTP2022 KPIs — Operating Profit ~2x Target, ROE 14.4%](https://japan-equity.com/wp-content/uploads/2026/07/p25_sq-1024x1024.jpg)
![[Obayashi] Cash Allocation — ¥420bn Investment CF Over Five Years](https://japan-equity.com/wp-content/uploads/2026/07/p26_sq-1024x1024.jpg)
![[Obayashi] Green Energy — 44 Plants, 344MW, and the Green Hydrogen Challenge](https://japan-equity.com/wp-content/uploads/2026/07/p21_sq-1024x1024.jpg)
![[Obayashi] Tackling the Labor Shortage — Robotics Construction®](https://japan-equity.com/wp-content/uploads/2026/07/p14_sq-1024x1024.jpg)
