
This article is based on publicly available IR materials and is not a recommendation to buy or sell any specific securities.
Note: ALINCO’s fiscal year ends on March 20. This article covers the fiscal year ended March 20, 2026, which the company labels “FY3/26” in its materials; the labels used in the text, tables and segment data below follow the company’s own presentation.
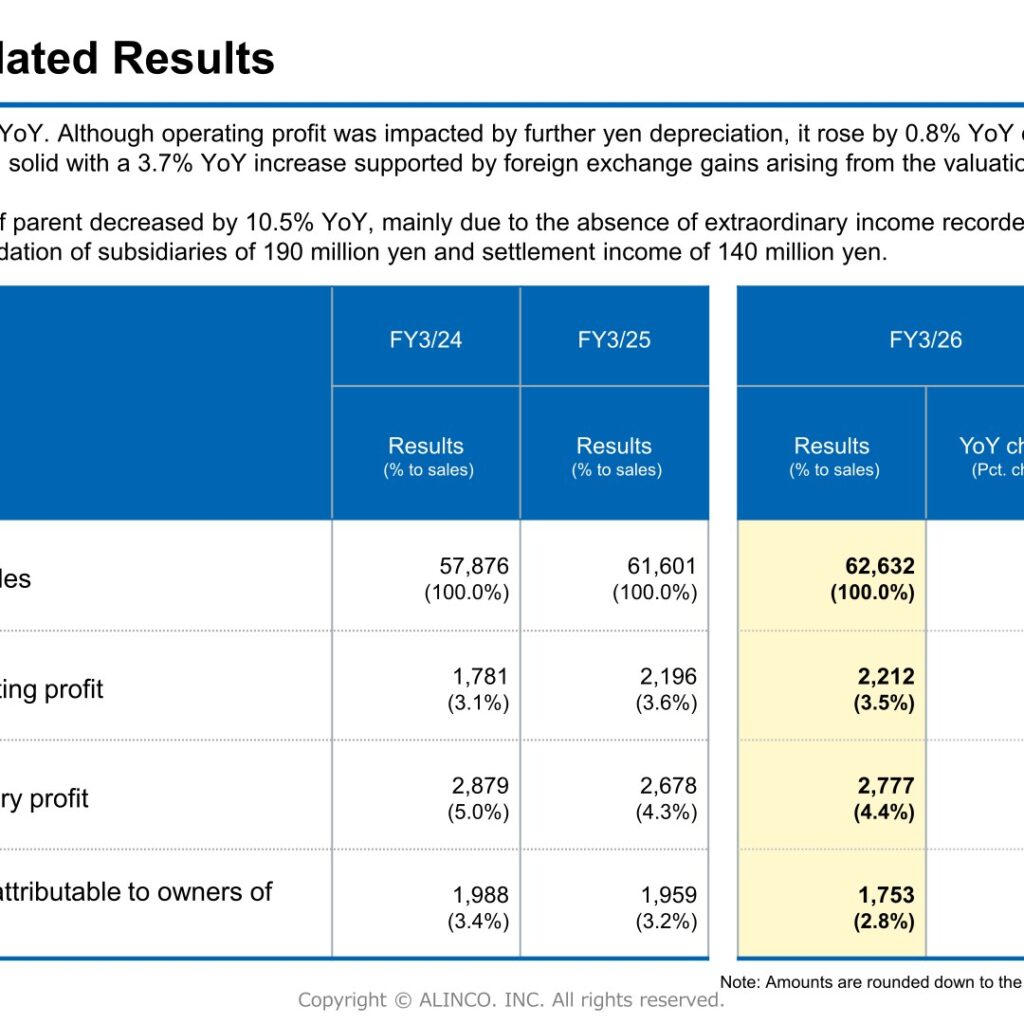
ALINCO INCORPORATED reported FY3/26 net sales of 62,632 million yen, up 1,030 million yen or 1.7% year on year, with operating profit of 2,212 million yen (up 0.8%) and ordinary profit of 2,777 million yen (up 3.7%). Profit attributable to owners of parent fell 10.5% to 1,753 million yen, mainly because of the absence of extraordinary income recorded in the previous fiscal year. For FY3/27 the company plans net sales of 65,200 million yen (up 4.1%), operating profit of 3,000 million yen (up 35.6%) and ordinary profit of 3,200 million yen (up 15.2%), and plans an annual dividend of 45 yen per share, a 1-yen increase.
Consolidated Results (Full-Year Actual)
Net sales increased by 1.7% year on year. Although operating profit was impacted by further yen depreciation, it rose by 0.8% year on year due to higher net sales, while ordinary profit remained solid with a 3.7% year-on-year increase supported by foreign exchange gains arising from the valuation of foreign currency-denominated assets. Profit attributable to owners of parent decreased by 10.5% year on year, mainly due to the absence of extraordinary income recorded in the previous fiscal year, including a gain on liquidation of subsidiaries of 190 million yen and settlement income of 140 million yen. Amounts are rounded down to the nearest million yen.
| Item (Millions of yen) | FY3/24 Results | FY3/25 Results | FY3/26 Results | YoY change (Pct. change) |
|---|---|---|---|---|
| Net sales | 57,876 | 61,601 | 62,632 | +1,030 (+1.7%) |
| Net sales (% to sales) | (100.0%) | (100.0%) | (100.0%) | – |
| Operating profit | 1,781 | 2,196 | 2,212 | +16 (+0.8%) |
| Operating profit (% to sales) | (3.1%) | (3.6%) | (3.5%) | – |
| Ordinary profit | 2,879 | 2,678 | 2,777 | +98 (+3.7%) |
| Ordinary profit (% to sales) | (5.0%) | (4.3%) | (4.4%) | – |
| Profit attributable to owners of parent | 1,988 | 1,959 | 1,753 | -206 (-10.5%) |
| Profit attributable to owners of parent (% to sales) | (3.4%) | (3.2%) | (2.8%) | – |
In the year-on-year breakdown of ordinary profit, the Construction Materials segment contributed -198 million yen and the Scaffolding Material Rental segment -138 million yen, while Home Equipment added 213 million yen and Electronic Equipment 140 million yen. Foreign exchange hedging was -142 million yen, valuation gains on foreign currency-denominated assets and similar items added 302 million yen, and others were -78 million yen, for a total increase of 98 million yen. The change in operating profit by segment was +16 million yen.
Segment Results
In the Construction Materials segment, net sales increased mainly for the flagship “ALBATROSS” product in response to planned procurement demand for future construction projects; however, segment profit decreased as sales were weighted toward highly consumable and relatively lower-margin products such as scaffolding boards. In the Scaffolding Material Rental segment, utilization rates for products for medium to high-rise buildings remained solid and orders for products for low-rise buildings were steadily secured, leaving net sales at the same level as the previous fiscal year, while segment profit decreased as depreciation expenses increased by 170 million yen on continued proactive investment in rental assets. In the Home Equipment segment, aerial elevated work platforms and brown rice storage refrigerators performed strongly and fitness equipment showed signs of recovery in relatively high-priced items such as treadmills, improving the segment loss. In the Electronic Equipment segment, demand for replacement firefighting radio systems drove a 145.9% year-on-year increase in related sales, and higher net sales improved the segment loss.
| Segment (Millions of yen) | Metric | FY3/24 Results | FY3/25 Results | FY3/26 Results | YoY change |
|---|---|---|---|---|---|
| Construction Materials | Sales | 21,829 | 24,565 | 24,674 | +0.4% |
| Construction Materials | Segment profit | 2,514 | 2,212 | 1,971 | -10.9% |
| Scaffolding Material Rental | Sales | 17,607 | 18,001 | 17,881 | -0.7% |
| Scaffolding Material Rental | Segment profit | 383 | 1,407 | 1,269 | -9.8% |
| Home Equipment | Sales | 13,274 | 13,973 | 14,456 | +3.5% |
| Home Equipment | Segment profit | -462 | -523 | -363 | – |
| Electronic Equipment | Sales | 5,164 | 5,061 | 5,620 | +11.0% |
| Electronic Equipment | Segment profit | -65 | -534 | -441 | – |
| Adjustment | Segment profit | 509 | 115 | 340 | – |
| Consolidated Total | Sales | 57,876 | 61,601 | 62,632 | +1.7% |
| Consolidated Total | Segment profit | 2,879 | 2,678 | 2,777 | +3.7% |
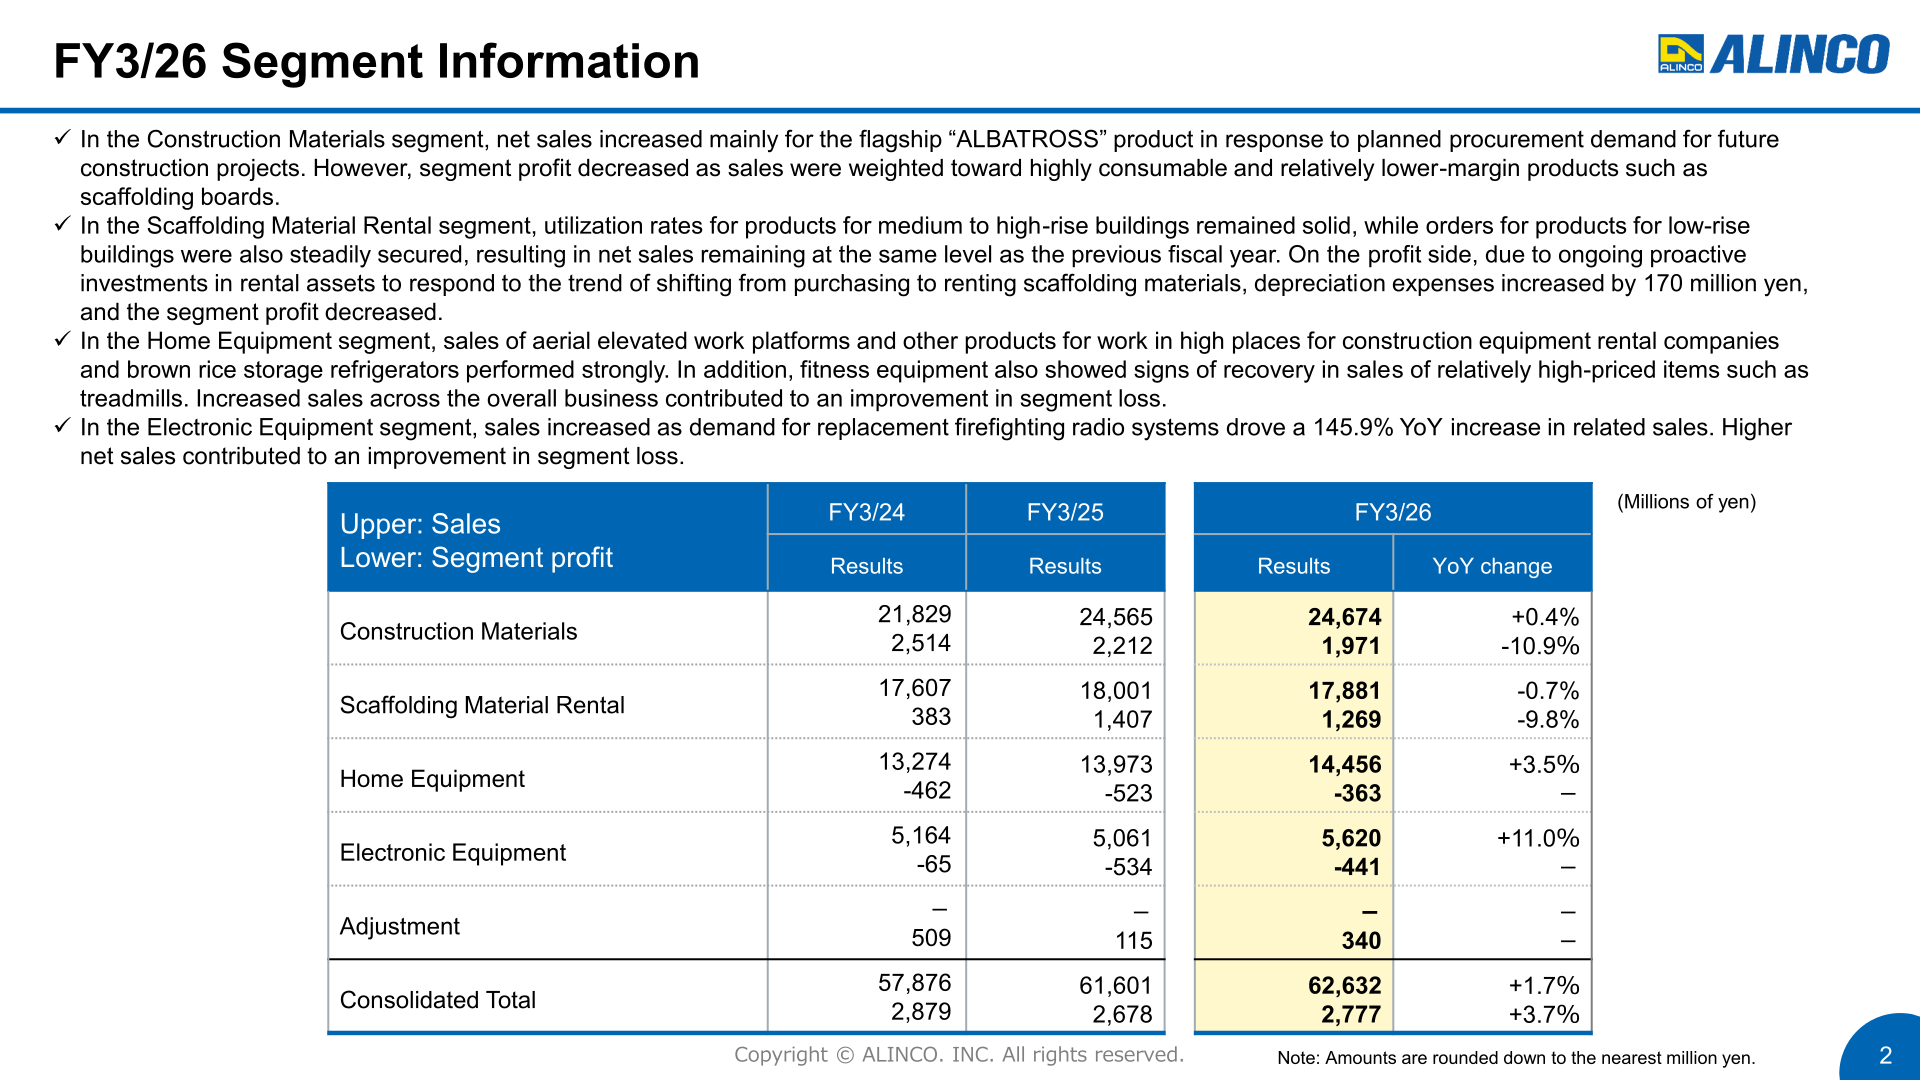
In the sales bridge from FY3/25 to FY3/26, Construction Materials added 108 million yen and Scaffolding Material Rental was -119 million yen, so core business sales overall were -10 million yen; Home Equipment added 483 million yen and Electronic Equipment 558 million yen, for a total increase of 1,030 million yen.
Financial Position and Cash Flows
Total assets stood at 73,282 million yen, up 2,399 million yen (+3.4%) year on year, with current assets of 42,966 million yen and non-current assets of 30,316 million yen (up 2,627 million yen, +9.5%). Total liabilities were 39,724 million yen (up 835 million yen, +2.1%) and net assets 33,557 million yen (up 1,563 million yen, +4.9%). The equity ratio improved to 45.8% from 45.1% (+0.7pt) and the debt equity ratio was unchanged at 0.81x. Major factors included buildings and structures of +1,108 million yen, investment in rental assets of +1,518 million yen, depreciation of rental assets of -1,022 million yen, short- and long-term borrowing of +1,342 million yen and dividends paid of -877 million yen.
Cash flows from operating activities were 3,350 million yen (down 2,073 million yen year on year), mainly due to an increase in inventories resulting from planned production for future demand and increases in payments for consumption taxes and income taxes. Cash flows from investing activities were -3,626 million yen (an improvement of 1,934 million yen), mainly due to a decrease in expenditures for the purchase of property, plant and equipment, while cash flows from financing activities were 484 million yen. Free cash flows were -275 million yen versus -136 million yen in the previous fiscal year.
FY3/27 Forecast
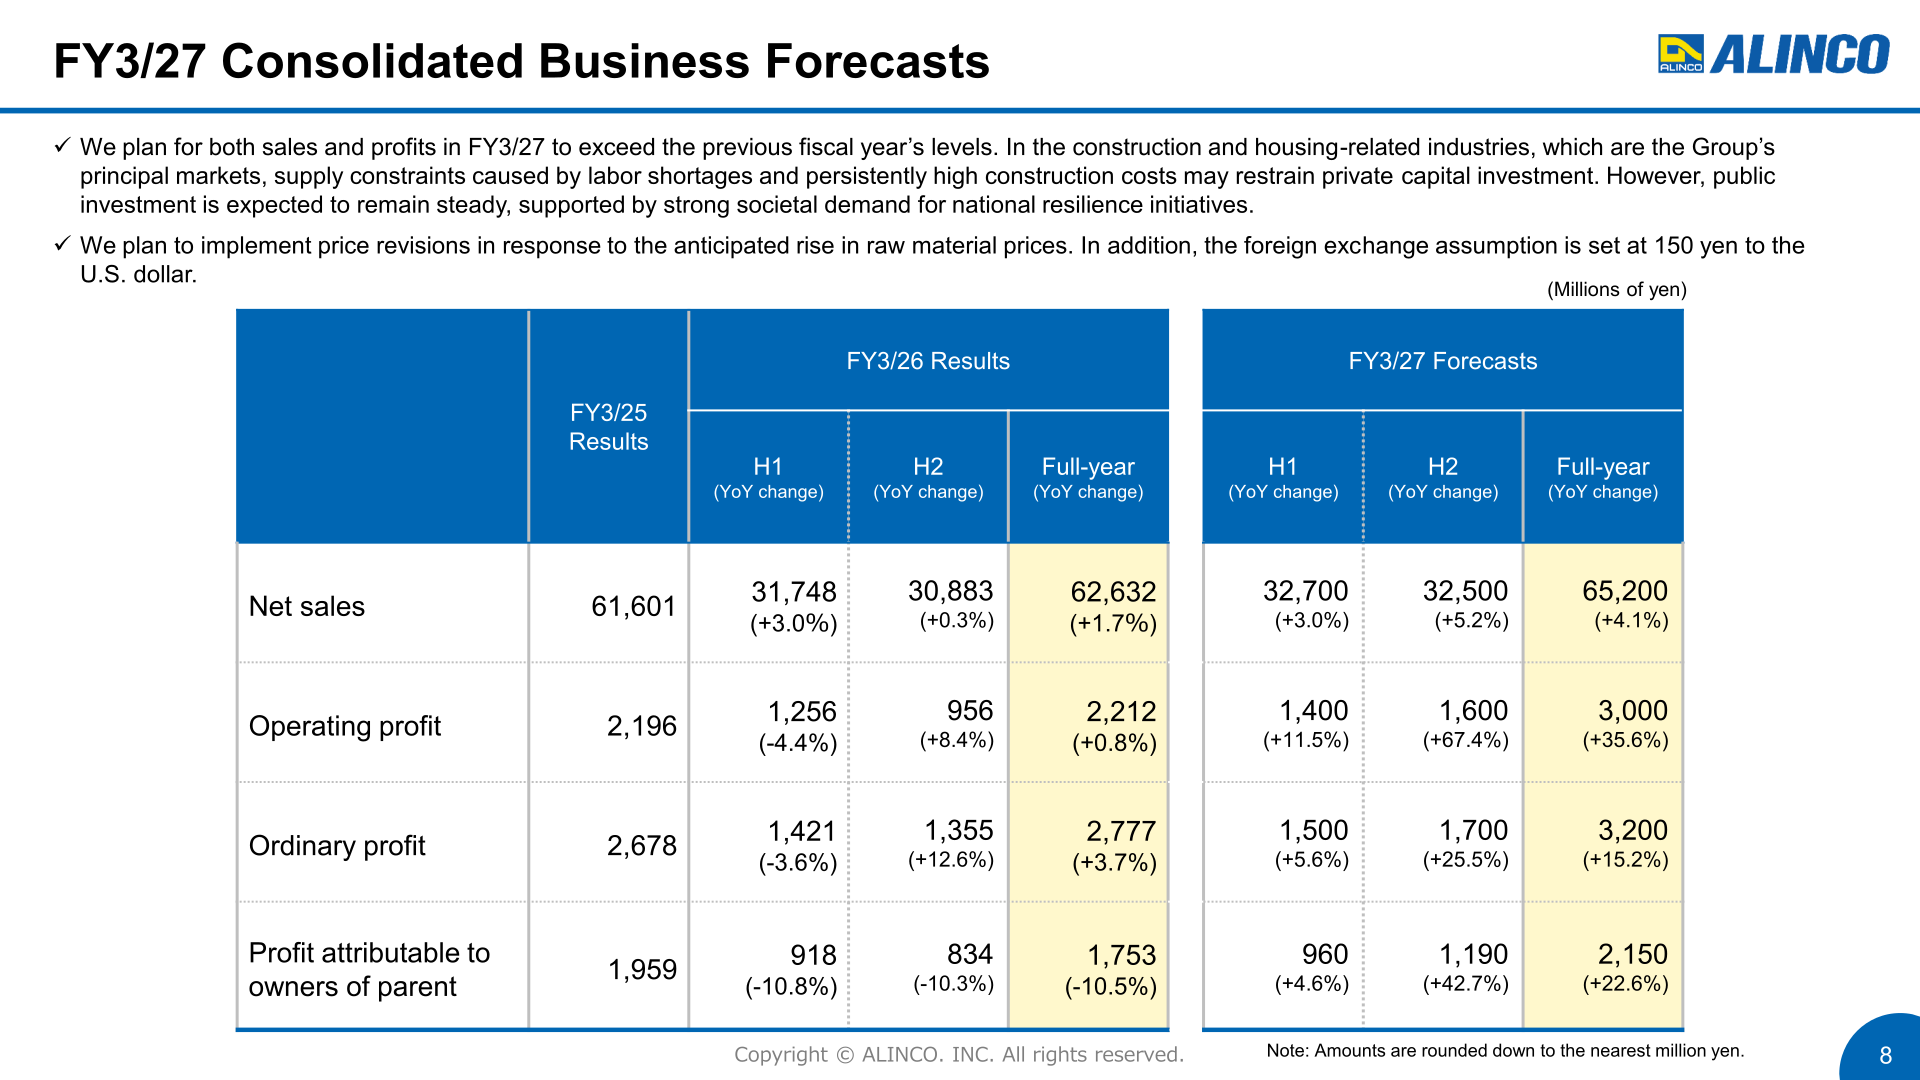
The company plans for both sales and profits in FY3/27 to exceed the previous fiscal year’s levels. In the construction and housing-related industries, which are the Group’s principal markets, supply constraints caused by labor shortages and persistently high construction costs may restrain private capital investment; however, public investment is expected to remain steady, supported by strong societal demand for national resilience initiatives. Price revisions are planned in response to the anticipated rise in raw material prices, and the foreign exchange assumption is set at 150 yen to the U.S. dollar.
| Item (Millions of yen) | FY3/25 Results | FY3/26 Results (Full-year) | FY3/27 Forecast (H1) | FY3/27 Forecast (H2) | FY3/27 Forecast (Full-year) |
|---|---|---|---|---|---|
| Net sales | 61,601 | 62,632 (+1.7%) | 32,700 (+3.0%) | 32,500 (+5.2%) | 65,200 (+4.1%) |
| Operating profit | 2,196 | 2,212 (+0.8%) | 1,400 (+11.5%) | 1,600 (+67.4%) | 3,000 (+35.6%) |
| Ordinary profit | 2,678 | 2,777 (+3.7%) | 1,500 (+5.6%) | 1,700 (+25.5%) | 3,200 (+15.2%) |
| Profit attributable to owners of parent | 1,959 | 1,753 (-10.5%) | 960 (+4.6%) | 1,190 (+42.7%) | 2,150 (+22.6%) |
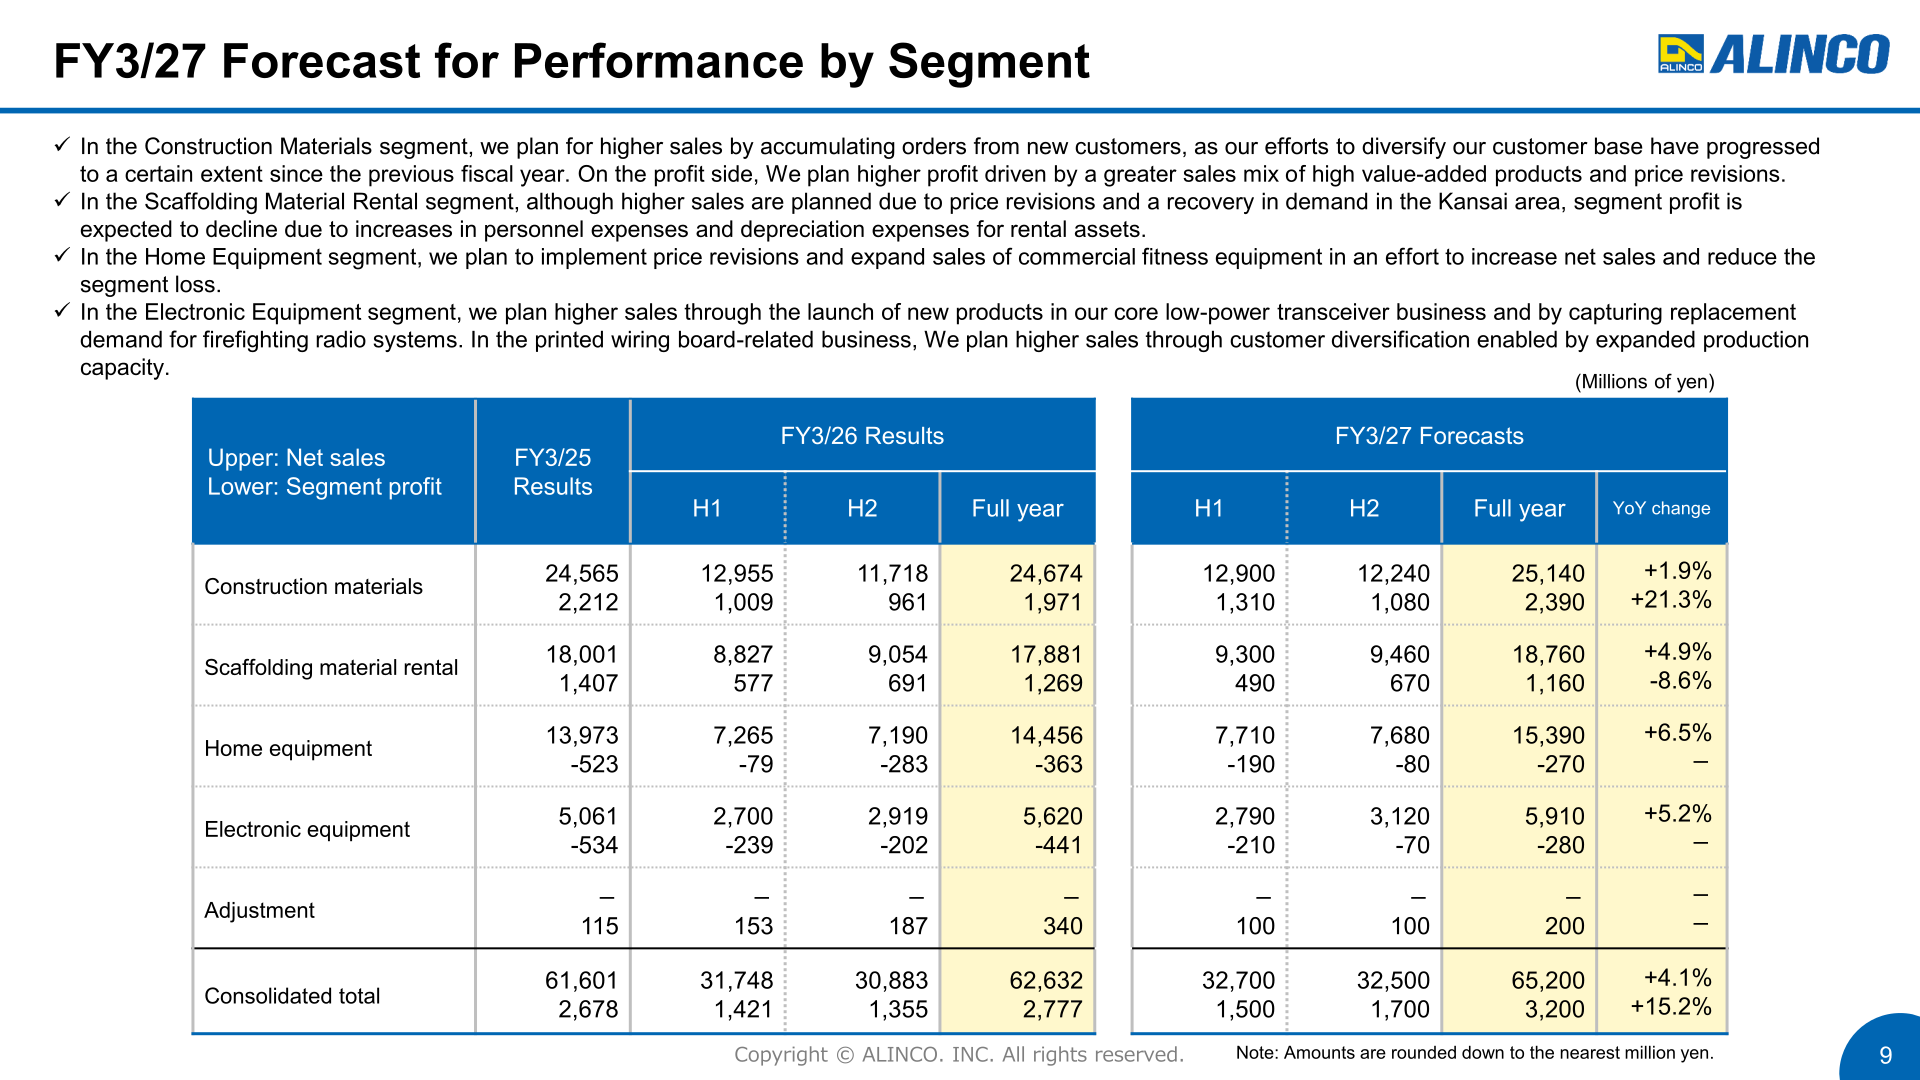
By segment, the FY3/27 plan calls for Construction Materials sales of 25,140 million yen (+1.9%) and segment profit of 2,390 million yen (+21.3%), Scaffolding Material Rental sales of 18,760 million yen (+4.9%) with segment profit of 1,160 million yen (-8.6%), Home Equipment sales of 15,390 million yen (+6.5%) with a segment loss of 270 million yen, and Electronic Equipment sales of 5,910 million yen (+5.2%) with a segment loss of 280 million yen, plus an adjustment of 200 million yen. In the sales bridge, Construction Materials adds 466 million yen, Scaffolding Material Rental 879 million yen, Home Equipment 934 million yen and Electronic Equipment 290 million yen, for an increase of 2,568 million yen; core businesses account for +1,345 million yen. The change in operating profit by segment is +787 million yen, and ordinary profit is projected to rise by 423 million yen despite a 220 million yen decline in foreign exchange gains due to currency hedging compared with the previous year.
Shareholder Returns
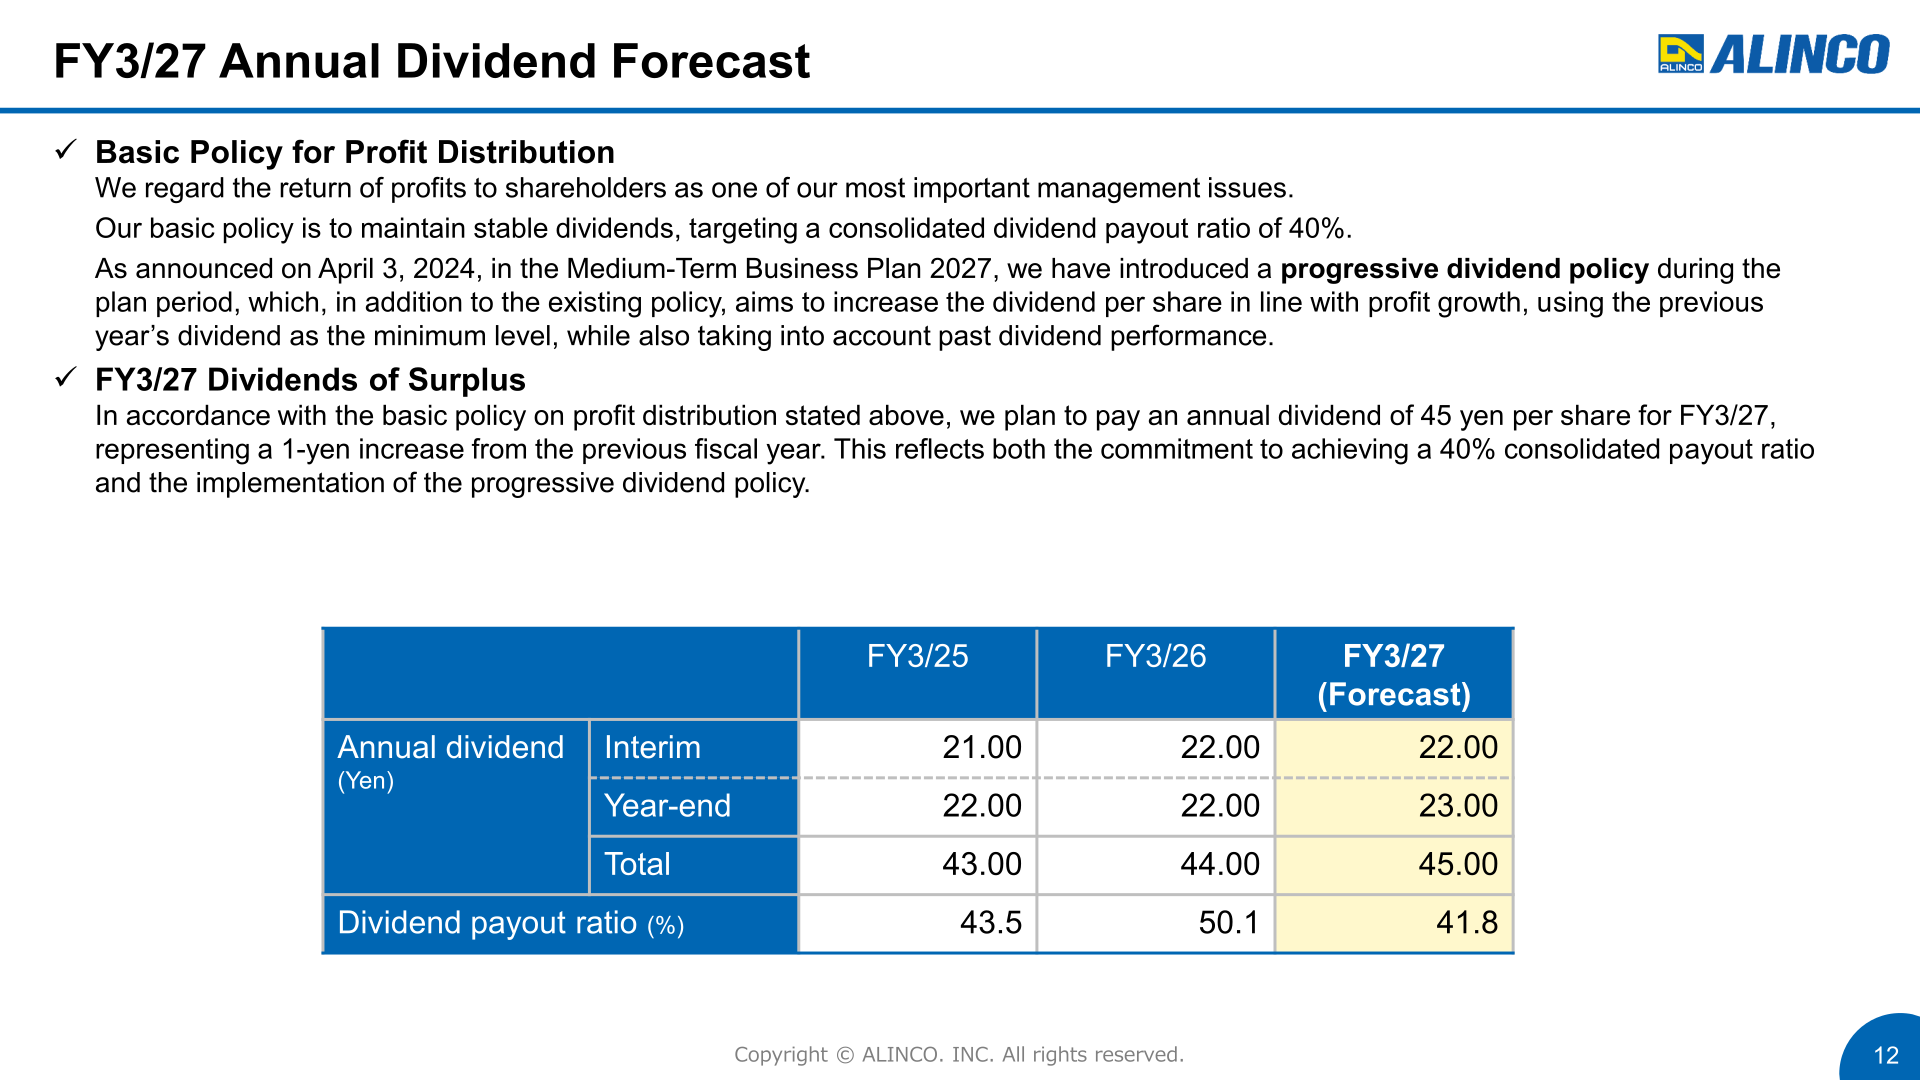
ALINCO regards the return of profits to shareholders as one of its most important management issues, and its basic policy is to maintain stable dividends targeting a consolidated dividend payout ratio of 40%. As announced on April 3, 2024 in the Medium-Term Business Plan 2027, the company introduced a progressive dividend policy during the plan period, which aims to increase the dividend per share in line with profit growth using the previous year’s dividend as the minimum level, while also taking into account past dividend performance. For FY3/27 the company plans an annual dividend of 45 yen per share, a 1-yen increase from the previous fiscal year, reflecting both the commitment to achieving a 40% consolidated payout ratio and the implementation of the progressive dividend policy.
| Annual dividend (Yen) | FY3/25 | FY3/26 | FY3/27 (Forecast) |
|---|---|---|---|
| Interim | 21.00 | 22.00 | 22.00 |
| Year-end | 22.00 | 22.00 | 23.00 |
| Total | 43.00 | 44.00 | 45.00 |
| Dividend payout ratio (%) | 43.5 | 50.1 | 41.8 |
Medium-Term Business Plan
The Medium-Term Business Plan 2027 covers FY3/25 to FY3/27. Under the plan the company adopts a progressive dividend policy, ensuring that dividends per share will not fall below the previous year’s level and will grow in line with profit growth, in addition to its basic policy of paying a stable dividend with a consolidated payout ratio of 40% as the target. Since FY3/20 the company has raised its target dividend payout ratio from 30% to 40%.
This article is an analysis based on publicly available information and is not a recommendation to buy or sell any specific securities. Investment decisions are your own responsibility.
![[Obayashi] Investors’ Guide 2026 — The Complete 24-Article Breakdown](https://japan-equity.com/wp-content/uploads/2026/07/hub_cover-1024x1024.png)
![[Obayashi] IR & SR Policy — Feeding Dialogue Back into Management](https://japan-equity.com/wp-content/uploads/2026/07/p32_sq-1024x1024.jpg)
![[Obayashi] Real Estate Development — 18.7% Margin, ¥287.7bn Unrealized Gains](https://japan-equity.com/wp-content/uploads/2026/07/p20_sq-1024x1024.jpg)
![[Obayashi] Domestic Civil Engineering — Resilience Spending Supports 9.6% Margin](https://japan-equity.com/wp-content/uploads/2026/07/p11_sq-1024x1024.jpg)
![[Obayashi] Share Price & External Ratings — vs TOPIX, ESG Index Inclusion](https://japan-equity.com/wp-content/uploads/2026/07/p40_sq-1024x1024.jpg)
![[Construction] ¥75.5tn Investment, Shrinking Workforce — Big-5 Market Share](https://japan-equity.com/wp-content/uploads/2026/07/p12_sq-1024x1024.jpg)



![[Obayashi] Capital Policy & Shareholder Returns — ROE 10%+, DOE ~5%, ¥100bn Buyback](https://japan-equity.com/wp-content/uploads/2026/07/p27_sq-1024x1024.jpg)
![[Obayashi] Reducing Cross-Shareholdings — ¥285.2bn Sold in Five Years](https://japan-equity.com/wp-content/uploads/2026/07/p29_sq-1024x1024.jpg)
![[Obayashi] ¥750bn Investment Plan — ¥300bn to Development, ¥190bn to Tech/DX](https://japan-equity.com/wp-content/uploads/2026/07/p30_sq-1024x1024.jpg)
![[Obayashi] MTP2022 KPIs — Operating Profit ~2x Target, ROE 14.4%](https://japan-equity.com/wp-content/uploads/2026/07/p25_sq-1024x1024.jpg)
![[Obayashi] Cash Allocation — ¥420bn Investment CF Over Five Years](https://japan-equity.com/wp-content/uploads/2026/07/p26_sq-1024x1024.jpg)
![[Obayashi] Green Energy — 44 Plants, 344MW, and the Green Hydrogen Challenge](https://japan-equity.com/wp-content/uploads/2026/07/p21_sq-1024x1024.jpg)
![[Obayashi] Tackling the Labor Shortage — Robotics Construction®](https://japan-equity.com/wp-content/uploads/2026/07/p14_sq-1024x1024.jpg)
