
This article is based on publicly available IR materials and is not a recommendation to buy or sell any specific securities.
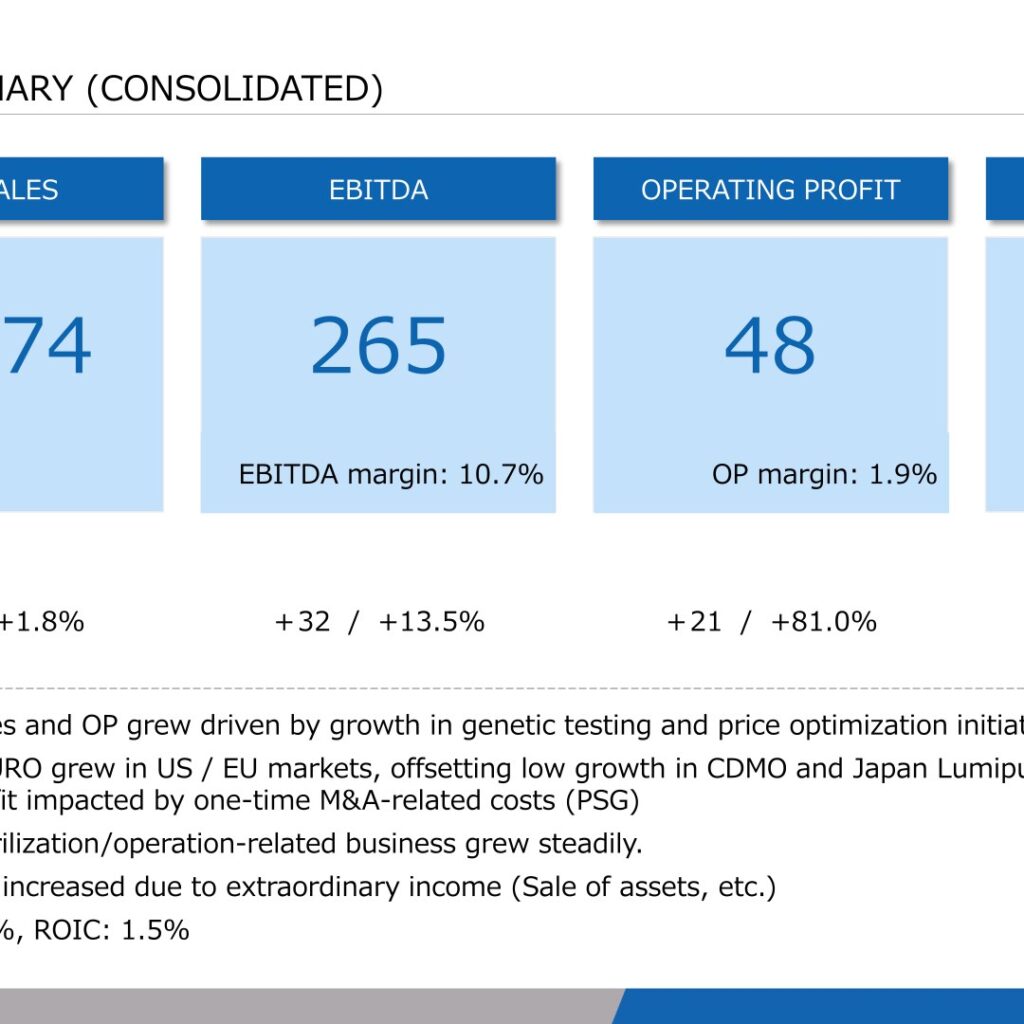
H.U. Group Holdings, Inc. (TSE: 4544) announced its FY2025 (fiscal year ended March 31, 2026) financial results on May 14, 2026, together with an updated mid-term management plan, “H.U.2030” 2.0 — Towards a Global H.U. Group. Consolidated net sales rose 1.8% year on year to 2,474, operating profit increased 81.0% to 48, and net profit jumped 147% to 68, lifted by extraordinary income from asset sales. EBITDA grew 13.5% to 265 (EBITDA margin: 10.7%). Unless otherwise noted, figures are in units of 100 million yen, as presented in the company’s materials.
Consolidated Results (Full-Year Actual)
Net sales increased by +43 year on year, with the LTS segment contributing +43, IVD +2, and HS -2. Operating profit improved from 26 to 48 (operating margin: 1.9%), as a +47 improvement in LTS was partly offset by a -23 decline in IVD, which was impacted by lower COVID-19 reagent sales and one-time M&A-related costs of 4.7 (related to the PSG acquisition). Ordinary profit declined from 47 to 28, reflecting non-operating factors including equity in losses of affiliates of 9.0 and a loss on investments in capital of 5.9 (versus a 30.7 gain in FY2024). Net profit rose to 68 on extraordinary income, including a gain of 39.3 on the sale of shares in Care’X and a gain of 22.9 on the sale of land in Kyoto, partly offset by a 4.0 loss on retirement of non-current assets following the SRL legacy system shutdown. ROE was 5.0% and ROIC was 1.5%, and operating cash flow was 216.
| Item (¥100 million) | FY2025 | FY2024 | YoY Change |
|---|---|---|---|
| Net sales | 2,474 | 2,430 | +43 (+1.8%) |
| Operating profit | 48 | 26 | +21 (+81.0%) |
| EBITDA | 265 | — | +32 (+13.5%) |
| Ordinary profit | 28 | 47 | — |
| Net profit | 68 | 28 | +41 (+147%) |
Segment Results
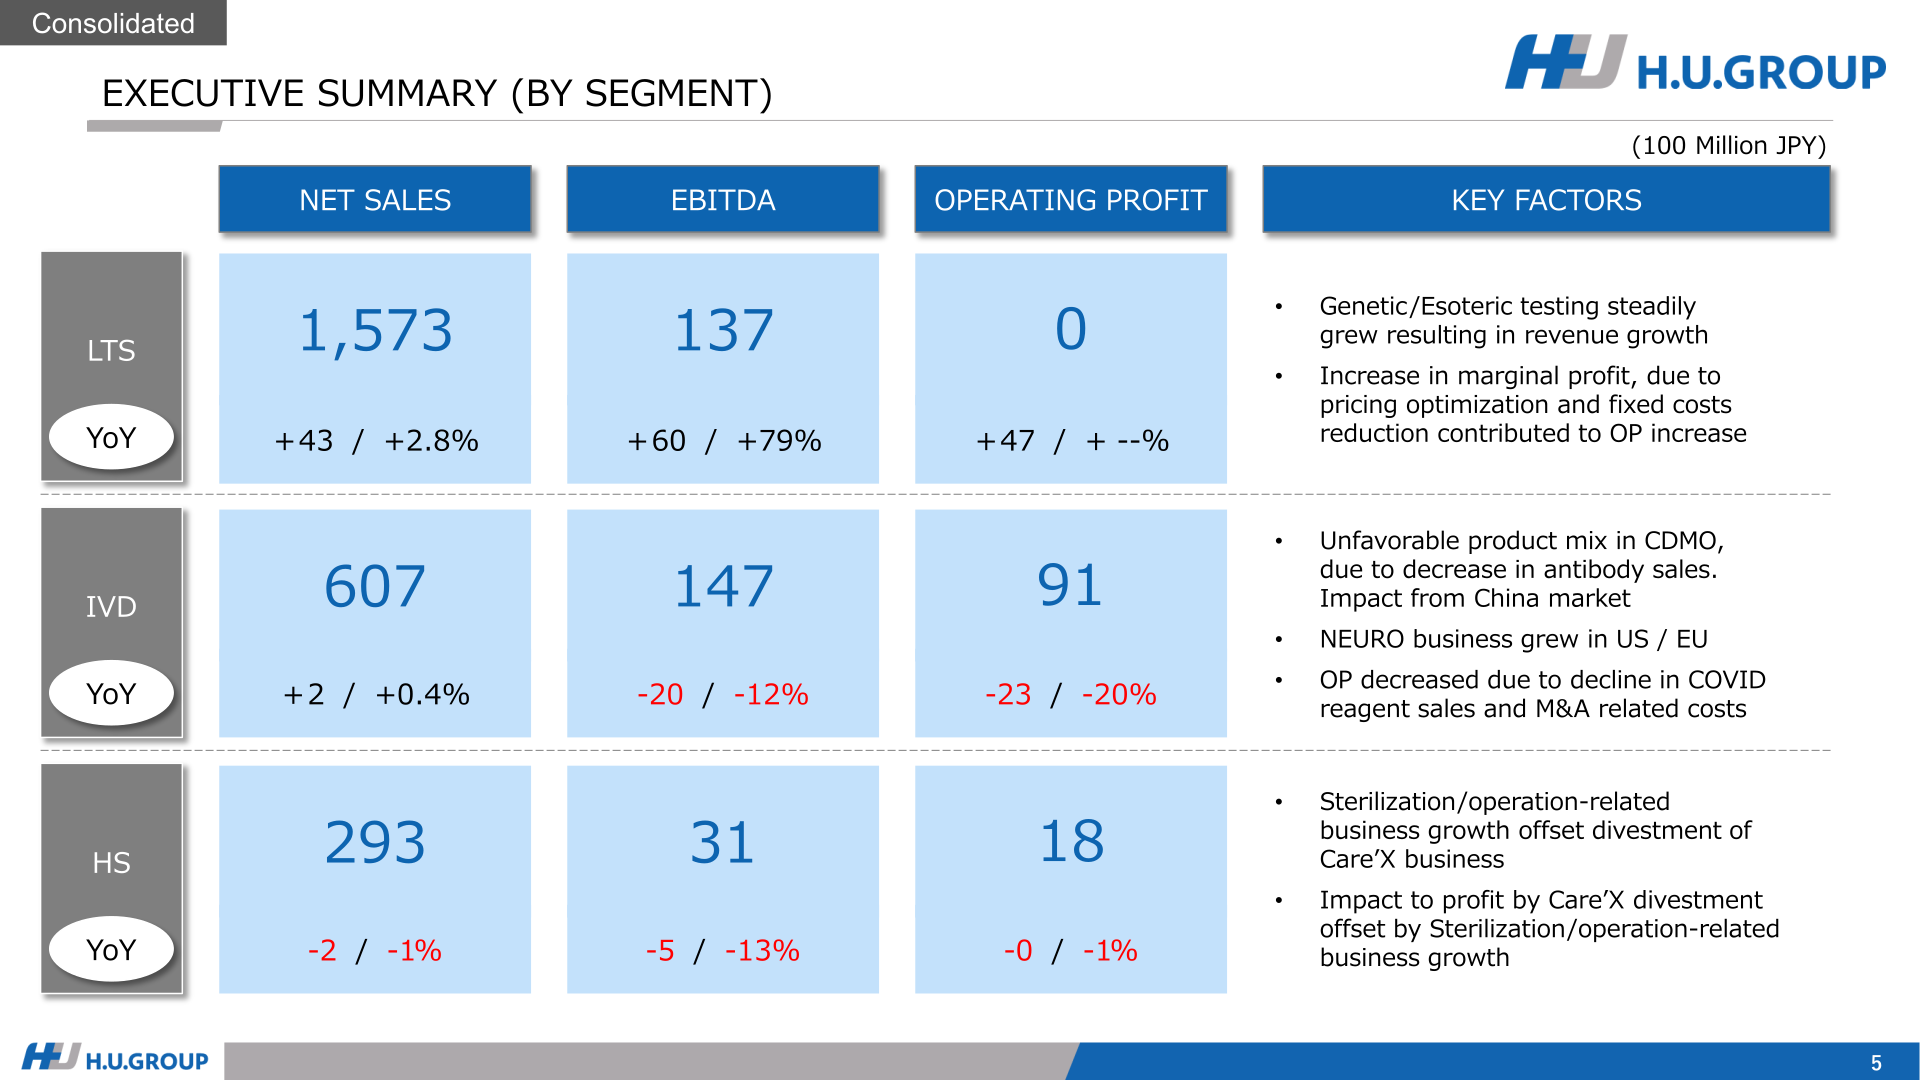
LTS (Lab Testing and its related Services) sales grew 2.8% to 1,573, driven by genetic and esoteric testing growth mainly from hospital clients; genetic test sales rose 6.5% to 315 and hospital-channel sales rose 4.3% to 978. LTS operating profit improved from -46 to 0, supported by pricing optimization, sales growth, and improved testing operations leveraging the fully operational Akiruno Cube laboratory. IVD (In-Vitro Diagnostics) sales were roughly flat at 607: the overseas NEURO business grew 69.7% to 79 and Lumipulse sales rose 7.0% to 278, while Japan COVID-related Lumipulse sales fell 32.2% to 29; IVD operating profit fell 20.2% to 91 on the COVID reagent decline and M&A-related costs. HS (Healthcare-related Services) sales edged down 0.6% to 293, as growth in the sterilization/operation-related business (+3.0% to 236) offset the divestment of the Care’X welfare business (welfare sales -39.9% to 36); home-visiting sales rose to 22 following the consolidation of GAIA Medicare in December 2024.
| Segment | Metric (¥100 million) | FY2025 | FY2024 | YoY |
|---|---|---|---|---|
| LTS | Net sales | 1,573 | 1,530 | +43 (+2.8%) |
| LTS | Operating profit | 0 | -46 | +47 |
| LTS | EBITDA | 137 | 77 | +60 (+78.7%) |
| IVD | Net sales | 607 | 605 | +2 (+0.4%) |
| IVD | Operating profit | 91 | 113 | -23 (-20.2%) |
| IVD | EBITDA | 147 | 167 | -20 (-12.1%) |
| HS | Net sales | 293 | 295 | -2 (-0.6%) |
| HS | Operating profit | 18 | 18 | -0 (-1.0%) |
| HS | EBITDA | 31 | 35 | -5 (-13.0%) |
FY2026 Forecast
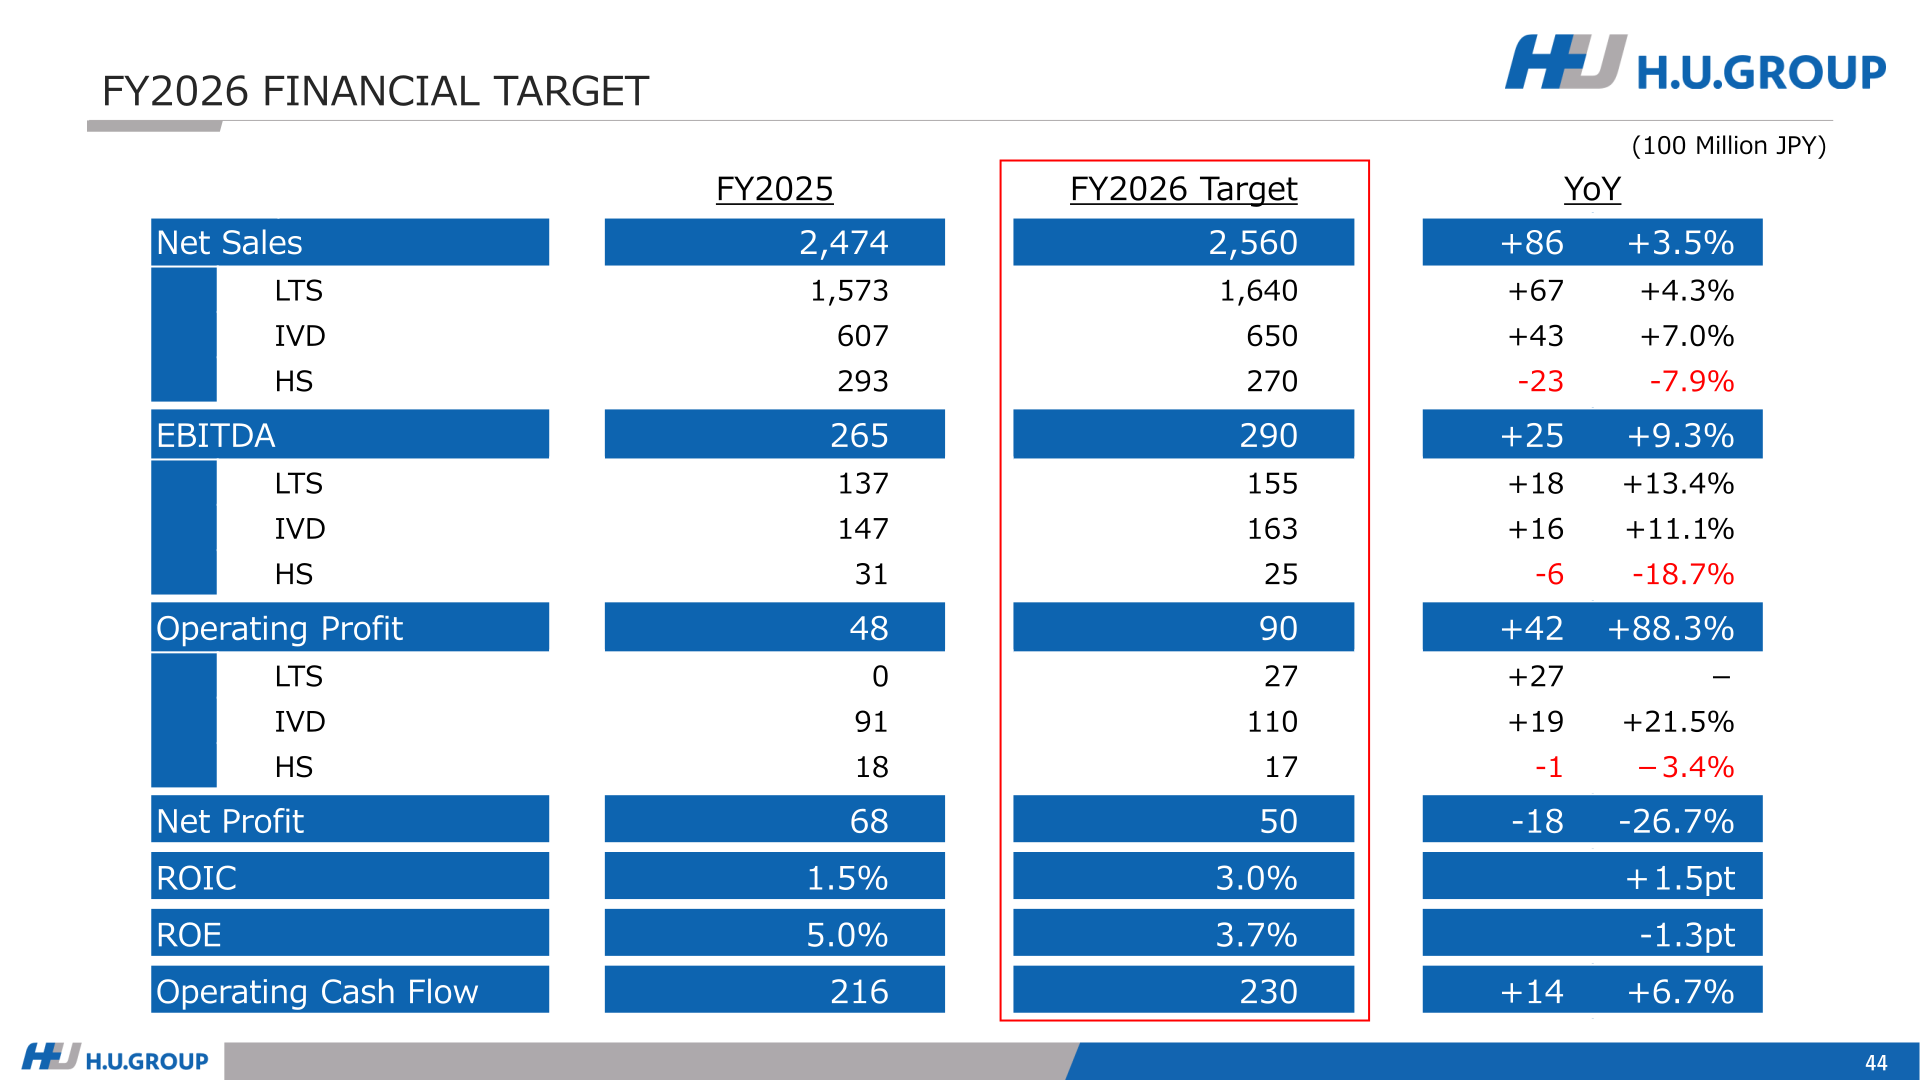
For FY2026 (ending March 31, 2027), the company targets net sales of 2,560 (+3.5%), operating profit of 90 (+88.3%), EBITDA of 290 (+9.3%), and net profit of 50 (-26.7%, reflecting the absence of the prior year’s extraordinary gains). By segment, sales targets are 1,640 for LTS (+4.3%), 650 for IVD (+7.0%), and 270 for HS (-7.9%), with operating profit targets of 27 for LTS, 110 for IVD (+21.5%), and 17 for HS. Operating cash flow is targeted at 230 (+6.7%), with ROE of 3.7% and ROIC of 3.0%. Key drivers cited include pricing optimization and hospital-market growth including genetic testing in LTS, and CDMO recovery in the global market plus steady NEURO growth in IVD.
| Item (¥100 million) | FY2026 Target | FY2025 (Actual) | YoY |
|---|---|---|---|
| Net sales | 2,560 | 2,474 | +86 (+3.5%) |
| Net sales: LTS | 1,640 | 1,573 | +67 (+4.3%) |
| Net sales: IVD | 650 | 607 | +43 (+7.0%) |
| Net sales: HS | 270 | 293 | -23 (-7.9%) |
| Operating profit | 90 | 48 | +42 (+88.3%) |
| EBITDA | 290 | 265 | +25 (+9.3%) |
| Net profit | 50 | 68 | -18 (-26.7%) |
| Operating cash flow | 230 | 216 | +14 (+6.7%) |
Shareholder Returns
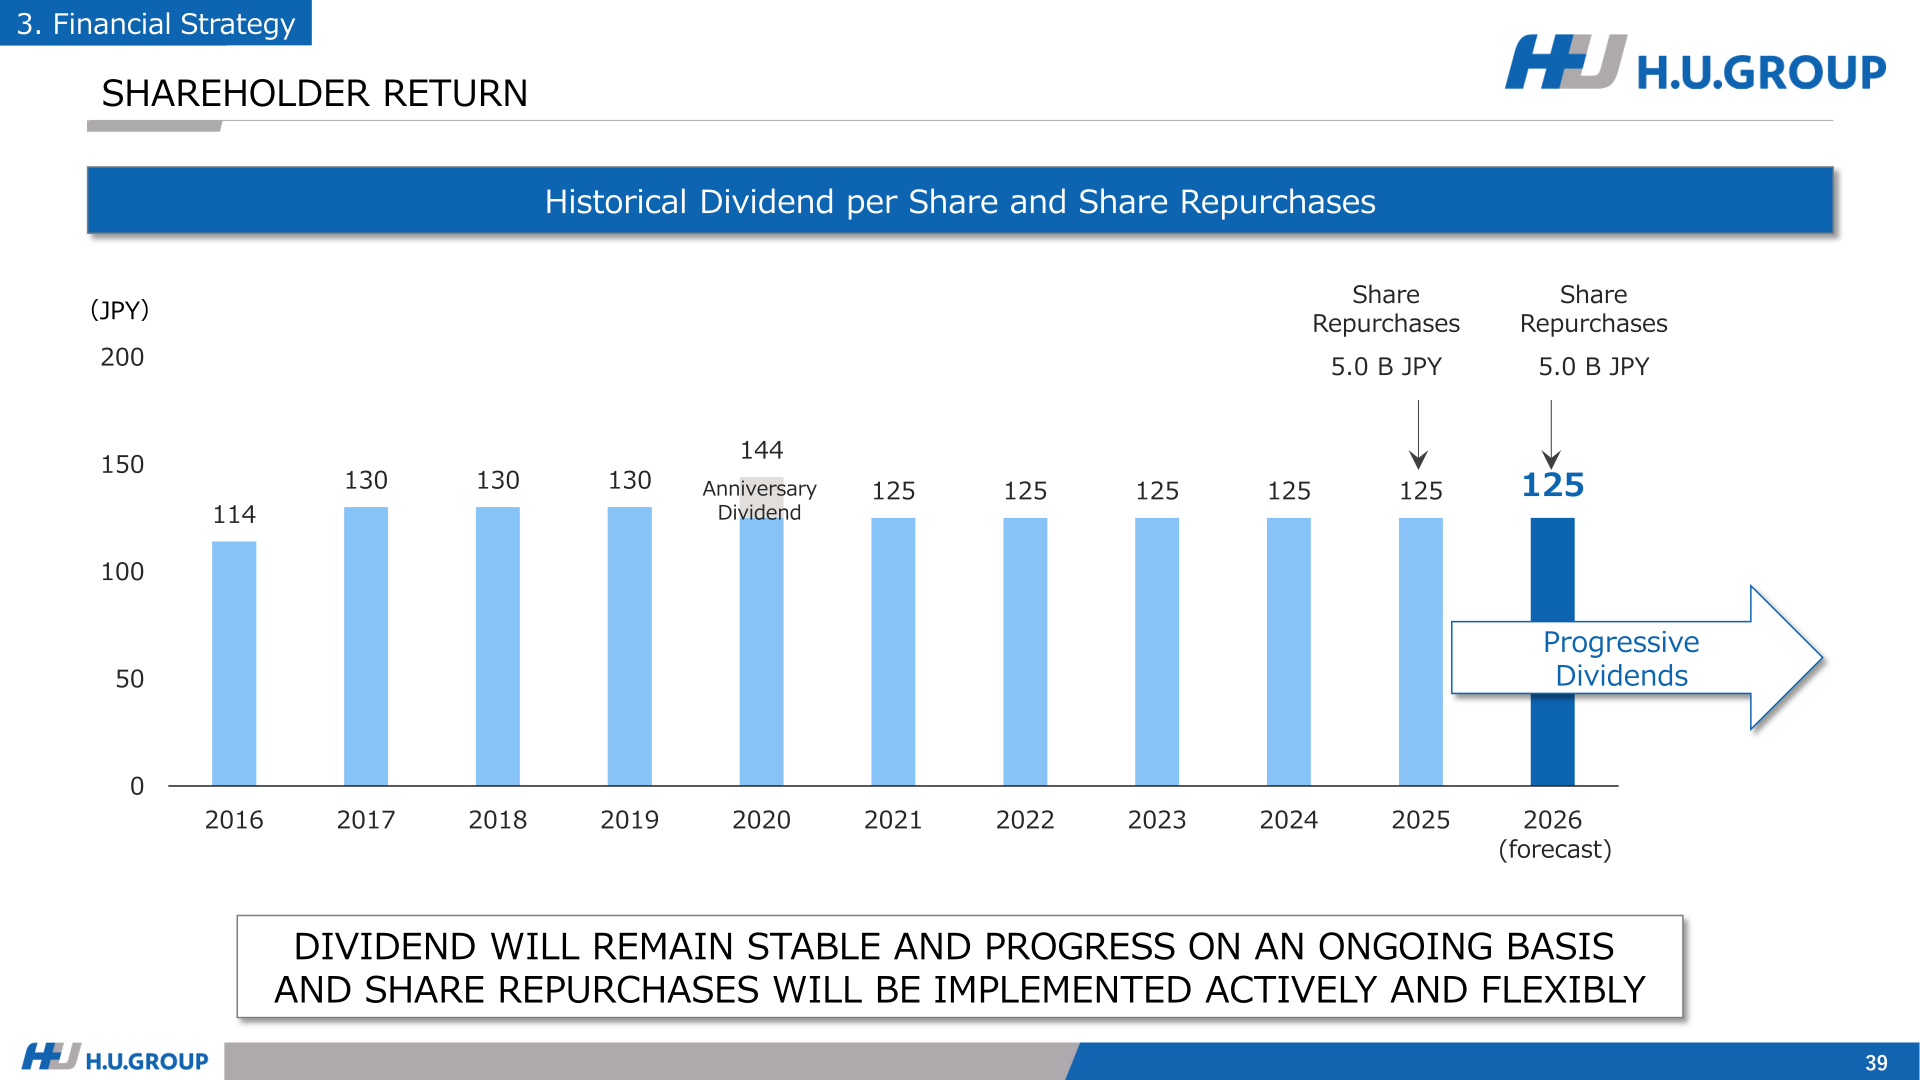
The company maintains a stable, progressive dividend policy and aims for a Dividend on Equity (DOE) ratio of 6%. According to the dividend history chart in the materials, the dividend per share was ¥125 for FY2025, with FY2026 also planned at ¥125. Share repurchases are to be implemented actively and flexibly: ¥5.0 billion was implemented in FY2025, and an additional ¥5.0 billion repurchase was resolved on May 14, 2026, with the target of over ¥20 billion in total remaining in place. Under the mid-term capital allocation policy, the company plans shareholder returns of ¥56 billion including dividends, funded by cumulative operating cash flow of 1,500 or more and asset sales of 150 or more, alongside strategic investment in M&A and growth.
| Item | Detail |
|---|---|
| Dividend per share (FY2025) | ¥125 |
| Dividend per share (FY2026 plan) | ¥125 |
| Share repurchases (FY2025) | ¥5.0 billion implemented |
| Additional share repurchase | ¥5.0 billion resolved on May 14, 2026 (total target of over ¥20 billion remains) |
| Dividend policy | Stable and progressive; aim for DOE ratio of 6% |
Mid-Term Management Plan “H.U.2030” 2.0
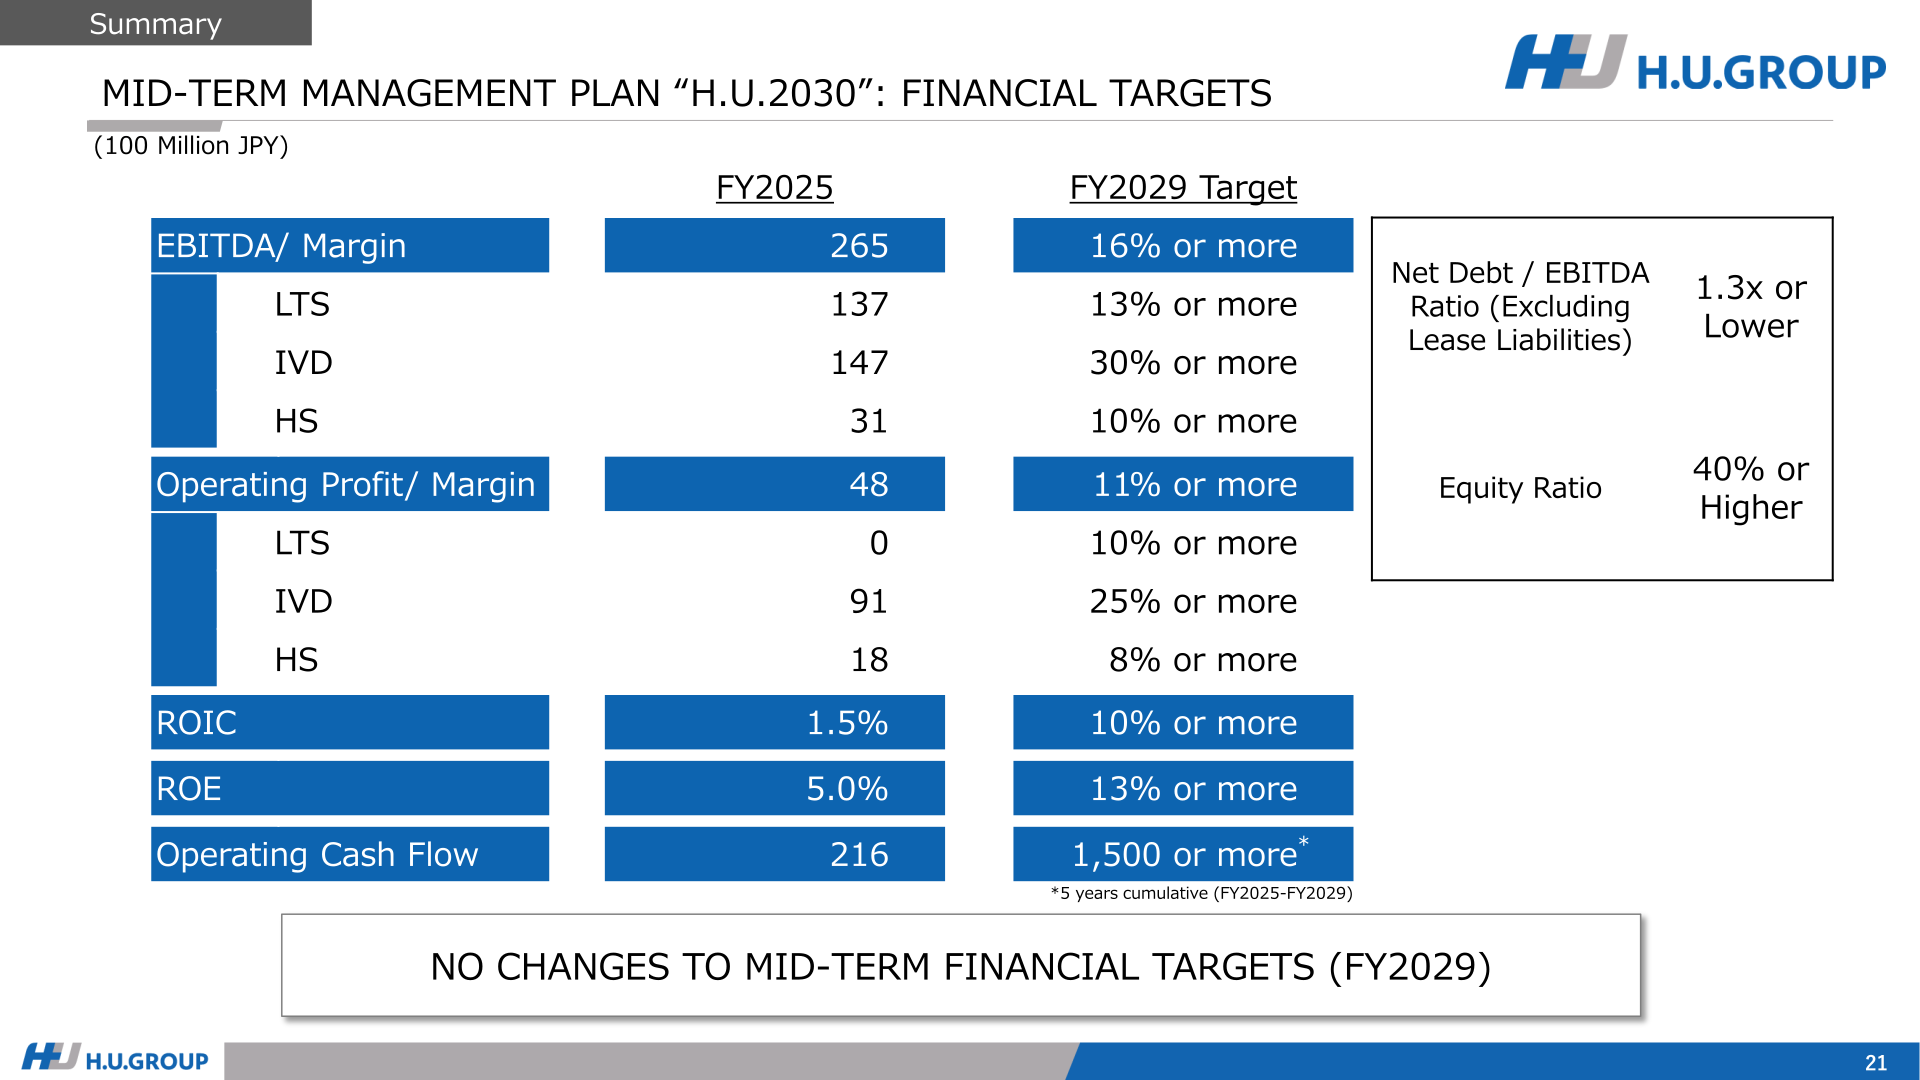
Alongside the results, the company presented “H.U.2030” 2.0 — Towards a Global H.U. Group, an update to the plan announced in May 2025. The updated plan introduces a group strategy focused on disease areas — with strong focus on Oncology and NEURO (neurodegenerative disease testing) while positioning infectious diseases and other areas as core fields — and has each operating company focus on its core strengths to improve profitability. The FY2029 financial targets are unchanged: an operating profit margin of 11% or more (LTS 10% or more, IVD 25% or more, HS 8% or more), an EBITDA margin of 16% or more, ROE of 13% or more, ROIC of 10% or more, cumulative operating cash flow of 1,500 or more over FY2025-FY2029, a net debt/EBITDA ratio (excluding lease liabilities) of 1.3x or lower, and an equity ratio of 40% or higher. In NEURO, blood-based NfL and pTau217 assays received CE marking in Europe, and ADx was integrated into Fujirebio Europe in April 2026 to accelerate expansion of the NEURO assay lineup.
This article is an analysis based on publicly available information and is not a recommendation to buy or sell any specific securities. Investment decisions are your own responsibility.
![[Obayashi] Investors’ Guide 2026 — The Complete 24-Article Breakdown](https://japan-equity.com/wp-content/uploads/2026/07/hub_cover-1024x1024.png)
![[Obayashi] IR & SR Policy — Feeding Dialogue Back into Management](https://japan-equity.com/wp-content/uploads/2026/07/p32_sq-1024x1024.jpg)
![[Obayashi] Domestic Civil Engineering — Resilience Spending Supports 9.6% Margin](https://japan-equity.com/wp-content/uploads/2026/07/p11_sq-1024x1024.jpg)
![[Obayashi] Overseas Construction — Orders Reach ¥1.2tn](https://japan-equity.com/wp-content/uploads/2026/07/p15_sq-1024x1024.jpg)
![[Obayashi] Share Price & External Ratings — vs TOPIX, ESG Index Inclusion](https://japan-equity.com/wp-content/uploads/2026/07/p40_sq-1024x1024.jpg)
![[Construction] ¥75.5tn Investment, Shrinking Workforce — Big-5 Market Share](https://japan-equity.com/wp-content/uploads/2026/07/p12_sq-1024x1024.jpg)



![[Obayashi] Capital Policy & Shareholder Returns — ROE 10%+, DOE ~5%, ¥100bn Buyback](https://japan-equity.com/wp-content/uploads/2026/07/p27_sq-1024x1024.jpg)
![[Obayashi] Reducing Cross-Shareholdings — ¥285.2bn Sold in Five Years](https://japan-equity.com/wp-content/uploads/2026/07/p29_sq-1024x1024.jpg)
![[Obayashi] ¥750bn Investment Plan — ¥300bn to Development, ¥190bn to Tech/DX](https://japan-equity.com/wp-content/uploads/2026/07/p30_sq-1024x1024.jpg)
![[Obayashi] MTP2022 KPIs — Operating Profit ~2x Target, ROE 14.4%](https://japan-equity.com/wp-content/uploads/2026/07/p25_sq-1024x1024.jpg)
![[Obayashi] Cash Allocation — ¥420bn Investment CF Over Five Years](https://japan-equity.com/wp-content/uploads/2026/07/p26_sq-1024x1024.jpg)
![[Obayashi] Green Energy — 44 Plants, 344MW, and the Green Hydrogen Challenge](https://japan-equity.com/wp-content/uploads/2026/07/p21_sq-1024x1024.jpg)
![[Obayashi] Tackling the Labor Shortage — Robotics Construction®](https://japan-equity.com/wp-content/uploads/2026/07/p14_sq-1024x1024.jpg)
