
This article is based on publicly available IR materials and is not a recommendation to buy or sell any specific securities.
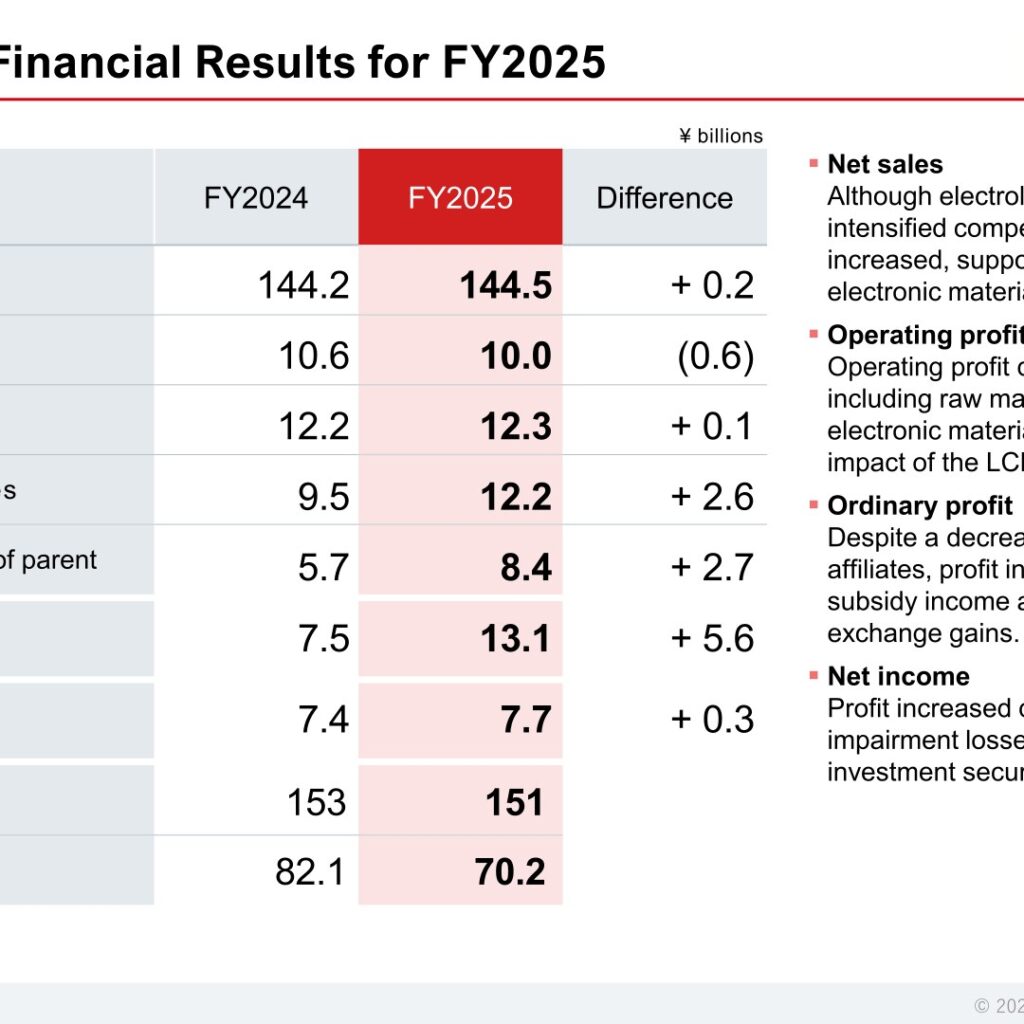
Central Glass Co., Ltd. reported its financial results for FY2025 (April 1, 2025 to March 31, 2026) on May 14, 2026. Net sales increased by ¥0.2 billion year-on-year to ¥144.5 billion, as growth in electronic materials and architectural glass offset a decline in energy materials. Operating profit decreased by ¥0.6 billion to ¥10.0 billion, primarily due to higher costs for raw materials and fuel, as well as the impact of the LCM method. Net sales and operating profit exceeded the forecast by ¥1.3 billion and ¥1.9 billion, respectively. For FY2026, the company projects net sales of ¥164.0 billion, up ¥19.5 billion, driven by higher sales in energy materials, with operating profit expected to remain flat at ¥10.0 billion.
Consolidated Results (Full-Year Actual)
Although electrolyte sales declined due to intensified competition, overall net sales increased, supported by solid sales in electronic materials and architectural glass. Operating profit decreased due to higher costs, including raw materials and fuel, in the electronic materials segment, as well as the impact of the LCM method. Ordinary profit rose to ¥12.3 billion: despite a decrease in equity in earnings of affiliates, profit increased due to higher subsidy income and an increase in foreign exchange gains. Profit attributable to owners of parent increased by ¥2.7 billion to ¥8.4 billion, due to a reduction in impairment losses and gains on the sale of investment securities.
| Item (¥ billions) | FY2024 | FY2025 | Difference |
|---|---|---|---|
| Net sales | 144.2 | 144.5 | + 0.2 |
| Operating profit | 10.6 | 10.0 | (0.6) |
| Ordinary profit | 12.2 | 12.3 | + 0.1 |
| Profit before income taxes | 9.5 | 12.2 | + 2.6 |
| Profit attributable to owners of parent | 5.7 | 8.4 | + 2.7 |
| Comprehensive income | 7.5 | 13.1 | + 5.6 |
| R&D | 7.4 | 7.7 | + 0.3 |
| Exchange rate (JPY/USD) | 153 | 151 | – |
| Crude oil (USD/bbl, CIF) | 82.1 | 70.2 | – |
Compared with the forecast announced on February 10, 2026 (net sales ¥143.2 billion, operating profit ¥8.1 billion, ordinary profit ¥9.3 billion, profit attributable to owners of parent ¥6.3 billion), results came in higher across the board: net sales by ¥1.3 billion, operating profit by ¥1.9 billion, ordinary profit by ¥3.0 billion and profit attributable to owners of parent by ¥2.1 billion. The company cited the continued depreciation of the yen, increased sales of electronic materials and other products, accelerated shipments of certain products in the medical and applied chemicals businesses, and progress in passing on higher raw material and other costs in automotive glass. Ordinary profit was also lifted by an increase in foreign exchange gains due to further yen depreciation and a timing shift of removal expenses to the following fiscal period.
On the balance sheet, total assets decreased by ¥7.0 billion to ¥197.8 billion as accounts receivable and inventories decreased. Interest-bearing debt (excluding lease obligations) decreased by ¥12.5 billion to ¥29.8 billion, while net assets increased by ¥7.2 billion to ¥128.2 billion. The equity ratio rose 5.5 percentage points to 62.5%, and the D/E ratio stood at 0.25x. Cash flows from operating activities were ¥26.4 billion (+ ¥2.9 billion), cash flows from investing activities were (¥10.0 billion), and free cash flows were ¥16.4 billion. Capital investment was ¥8.6 billion (FY2024: ¥7.9 billion) and depreciation expenses were ¥8.0 billion (FY2024: ¥8.9 billion).
Segment Results
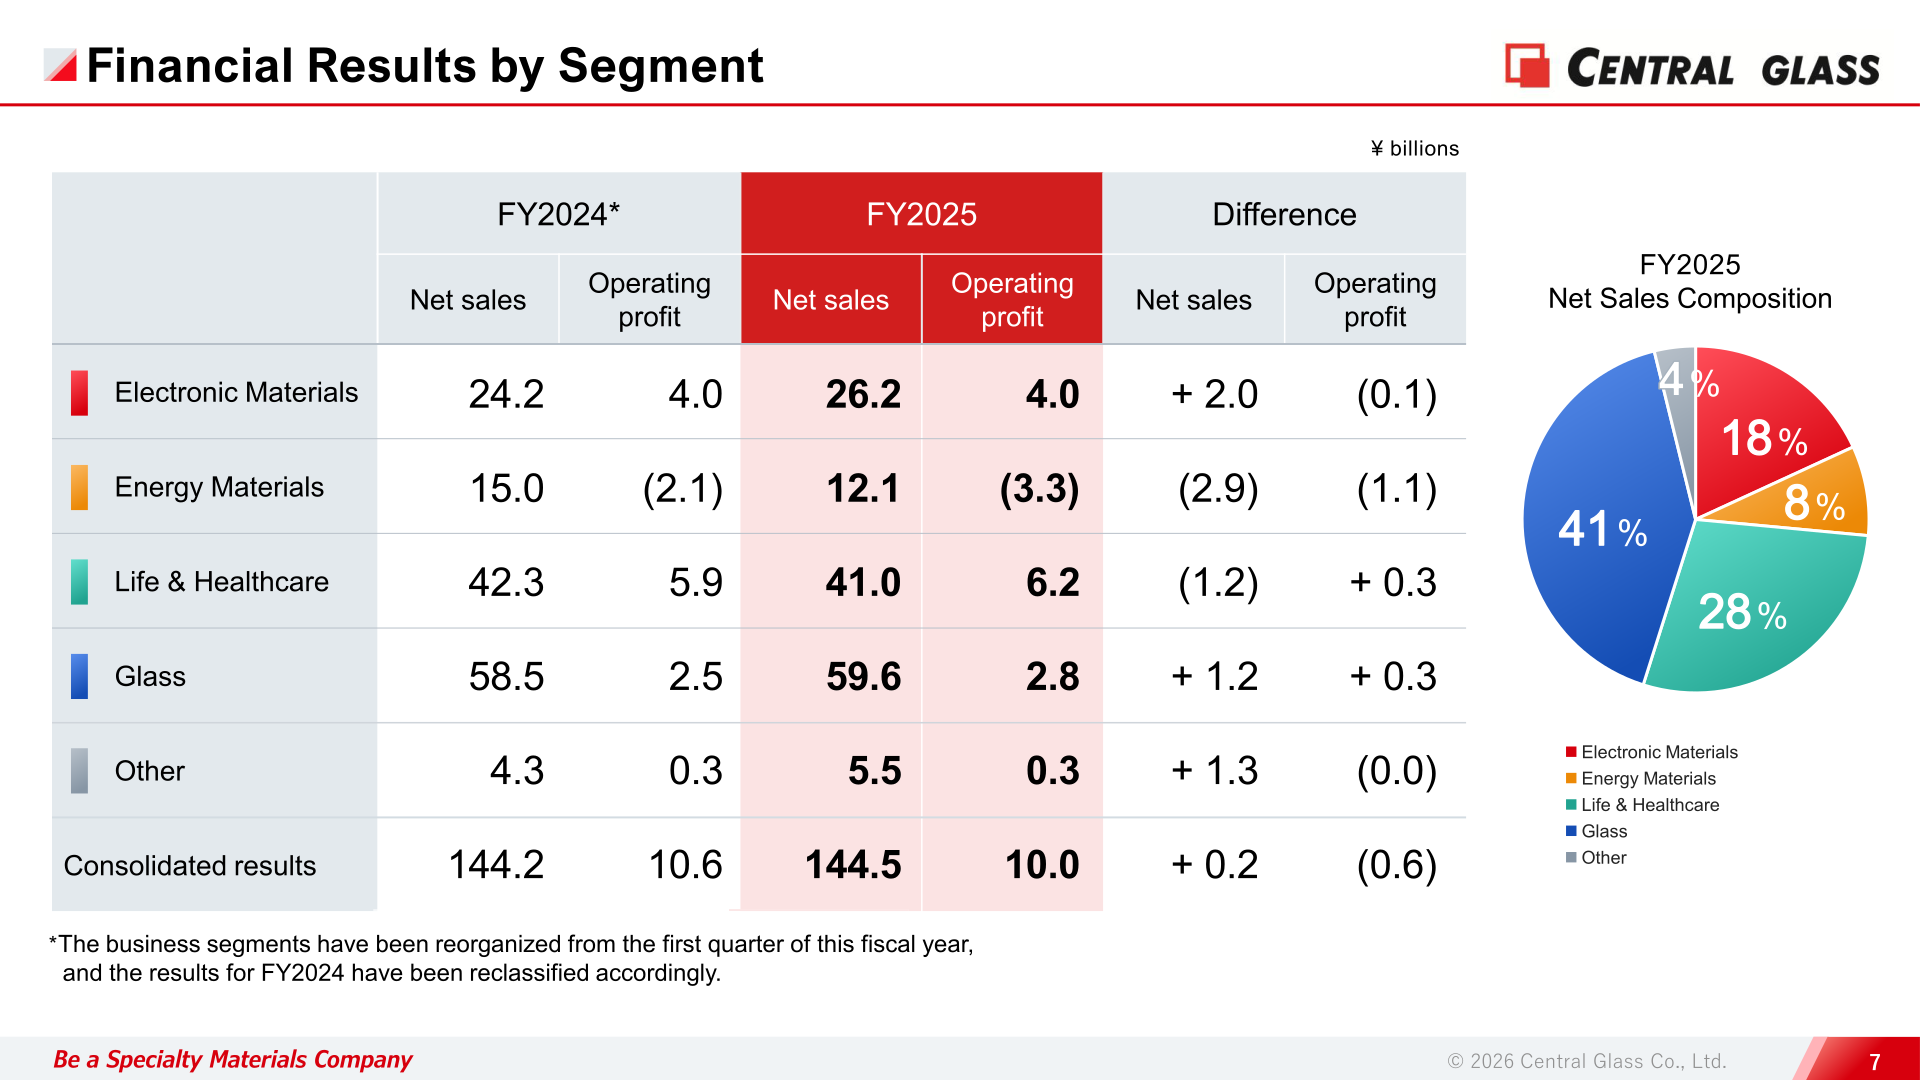
The business segments were reorganized from the first quarter of FY2025 into five segments — Electronic Materials, Energy Materials, Life & Healthcare, Glass and Other — and FY2024 results have been reclassified accordingly. Glass accounted for 41% of FY2025 net sales, Life & Healthcare 28%, Electronic Materials 18%, Energy Materials 8% and Other 4%.
| Segment (¥ billions) | Net sales FY2024 | Net sales FY2025 | Operating profit FY2024 | Operating profit FY2025 |
|---|---|---|---|---|
| Electronic Materials | 24.2 | 26.2 | 4.0 | 4.0 |
| Energy Materials | 15.0 | 12.1 | (2.1) | (3.3) |
| Life & Healthcare | 42.3 | 41.0 | 5.9 | 6.2 |
| Glass | 58.5 | 59.6 | 2.5 | 2.8 |
| Other | 4.3 | 5.5 | 0.3 | 0.3 |
| Consolidated results | 144.2 | 144.5 | 10.6 | 10.0 |
Electronic Materials: While sales of specialty gases increased, driven by growing demand for semiconductors for AI, and contributed to higher net sales, profit remained in line with the previous year due to rising costs, including raw materials, as well as the impact of inventory reductions. Resist materials sales increased as sales volumes remained strong despite a temporary decrease due to changes in transaction terms, and Pattern Keeper sales increased due to higher sales to major customers. The operating profit ratio was 15.2% (FY2024: 16.7%).
Energy Materials: Although shipment volumes to new customers in Japan continued to grow, net sales and operating profit declined due to intensified price competition overseas and the impact of the LCM method. In China, net sales increased due to higher sales volumes to existing customers; however, overall overseas net sales declined, as sales volumes in North America, South Korea, and Europe decreased significantly amid intensifying price competition.
Life & Healthcare: Net sales decreased to ¥41.0 billion due to lower sales volumes of inhalation anesthetic APIs and functional materials, as well as the withdrawal from the unprofitable PAC business. By business, Medi-Chemicals was ¥11.0 billion (FY2024: ¥11.9 billion), Applied Chemicals ¥18.3 billion (¥19.1 billion) and Fertilizers ¥11.7 billion (¥11.2 billion). Despite negative impacts from the LCM method in applied chemicals and fertilizers, operating profit increased to ¥6.2 billion due to reduced fixed costs and the effects of exiting unprofitable business, and the operating profit ratio improved to 15.0% (FY2024: 14.0%).
Glass: Net sales increased to ¥59.6 billion due to strong sales of architectural glass and glass fiber, while profit rose to ¥2.8 billion as higher costs, including raw materials and fuel, were successfully passed on through pricing. Architectural Glass was ¥23.3 billion (FY2024: ¥22.3 billion), supported by strong sales for non-residential building applications in the Tokyo metropolitan area; Automotive Glass was ¥27.4 billion (¥27.7 billion), reflecting reduced sales at certain customers and a temporary production shutdown; and Glass Fiber was ¥9.0 billion (¥8.6 billion). The operating profit ratio was 4.7% (FY2024: 4.2%).
FY2026 Forecast
For FY2026, net sales are projected to increase due to the recovery in energy materials, while operating profit is expected to remain in line with the previous year due to the impact of rising costs, including raw materials. Ordinary profit is forecast to decrease due to a decline in foreign exchange gains and subsidy income. Regarding the impact of the situation in the Middle East, the company estimates a cost impact from rising raw material and fuel prices of ¥2.5 billion, of which the unrecovered cost increase (negative impact on profit) is ¥1.8 billion (Electronic Materials: ¥0.1 billion, Life & Healthcare: ¥0.8 billion, Glass: ¥0.9 billion); items not yet determined, such as production adjustments by customers, are not included.
| Item (¥ billions) | FY2025 Results | FY2026 Forecast | Difference |
|---|---|---|---|
| Net sales | 144.5 | 164.0 | + 19.5 |
| Operating profit | 10.0 | 10.0 | 0.0 |
| Ordinary profit | 12.3 | 10.3 | (2.0) |
| Profit attributable to owners of parent | 8.4 | 7.2 | (1.2) |
| Exchange rate (JPY/USD) | 151 | 155 | – |
| Crude oil (USD/bbl, CIF) | 70.2 | 100 | – |
| R&D | 7.7 | 7.9 | + 0.2 |
| Segment (¥ billions) | Net sales FY2026 Forecast | Operating profit FY2026 Forecast | Net sales Difference | Operating profit Difference |
|---|---|---|---|---|
| Electronic Materials | 32.1 | 4.5 | + 5.9 | + 0.5 |
| Energy Materials | 25.2 | (0.8) | +13.1 | + 2.5 |
| Life & Healthcare | 40.2 | 5.0 | (0.8) | (1.2) |
| Glass | 61.2 | 1.3 | + 1.6 | (1.5) |
| Other | 5.3 | 0.0 | (0.2) | (0.3) |
| Consolidated results | 164.0 | 10.0 | +19.5 | 0.0 |
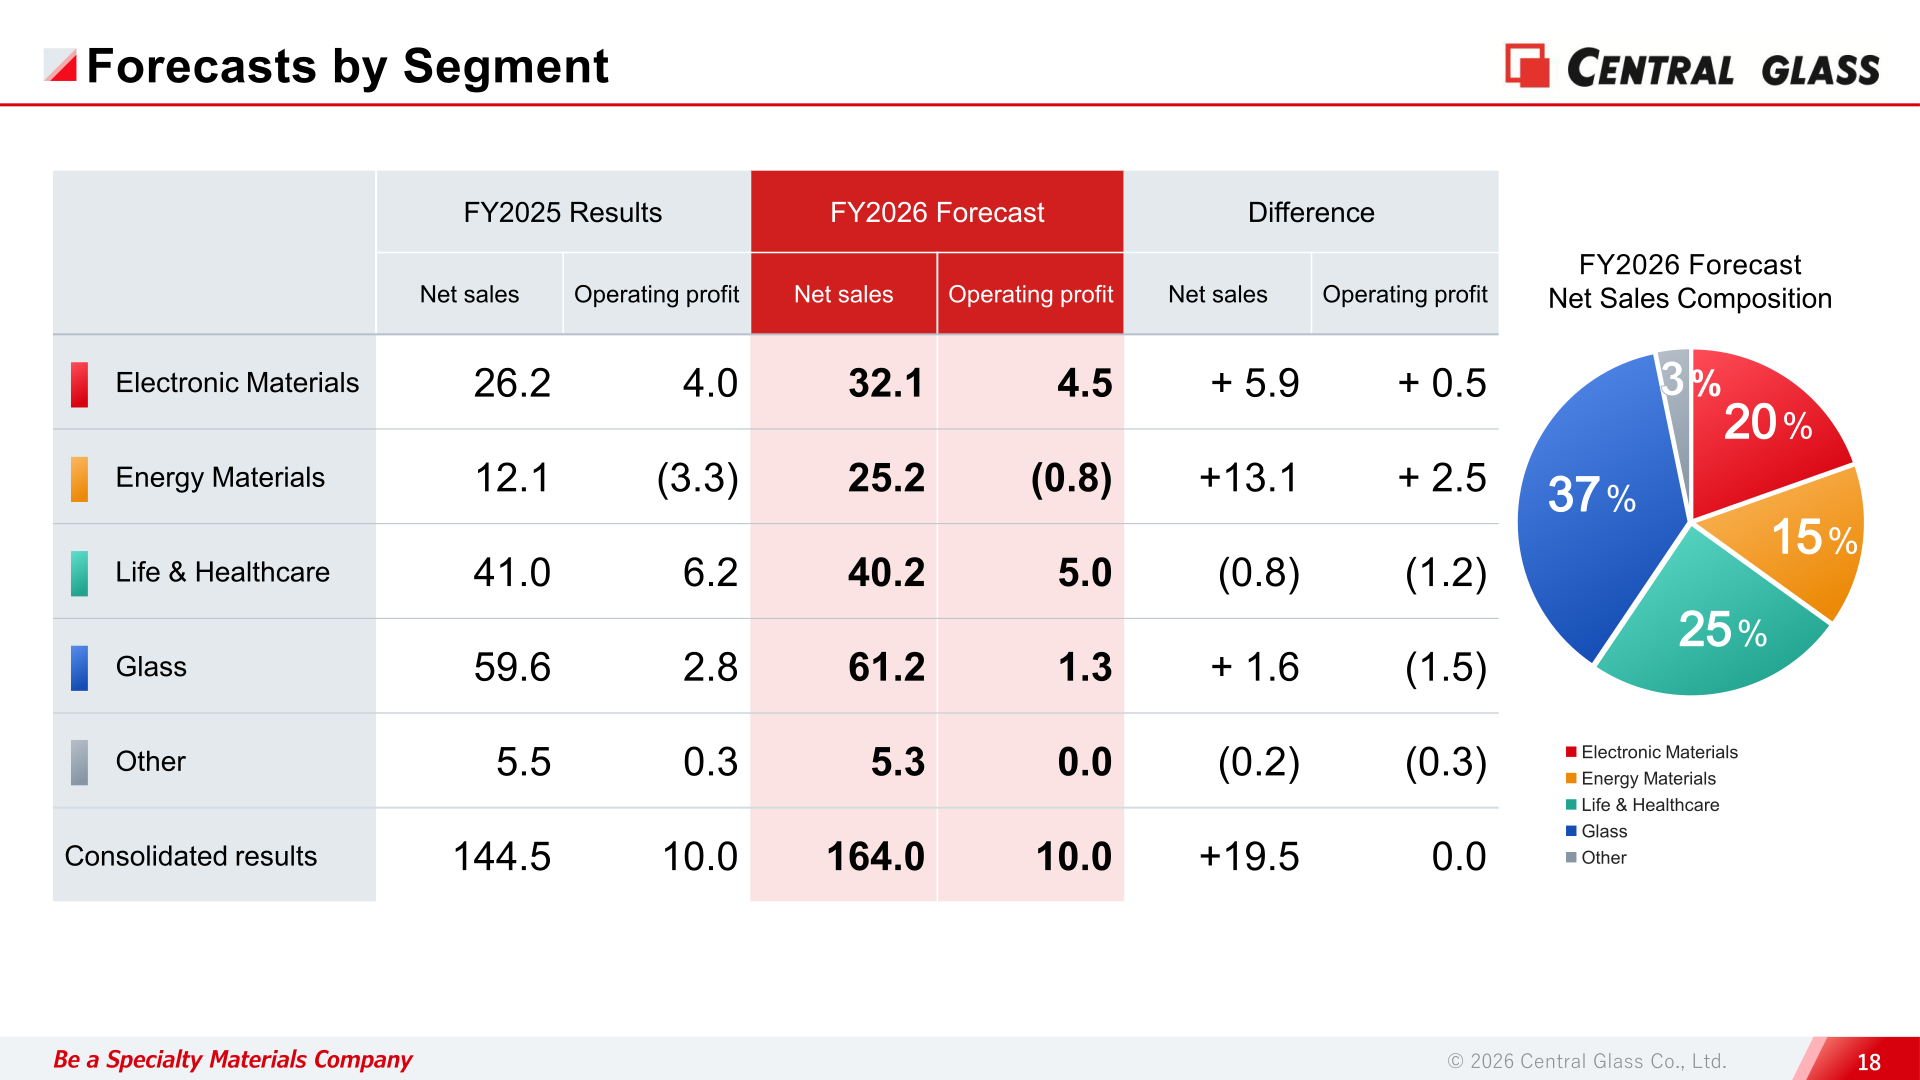
In Electronic Materials, sales of semiconductors for AI are expected to remain strong, supporting net sales growth, but the increase in profit is expected to be limited due to rising raw material costs associated with China’s export restrictions. Energy Materials net sales are expected to increase due to higher domestic sales volumes and delayed expansion of the OEM business in Europe, with operating losses projected to narrow. In Life & Healthcare, net sales are expected to increase in applied chemicals and fertilizers, but profit is expected to decline due to a significant decline in anesthetic APIs (Medi-Chemicals forecast: ¥8.9 billion) and unrecovered cost increases. In Glass, net sales are expected to increase on a recovery in architectural glass exports, a rebound in glass fiber volumes and price revisions, while profit is expected to decline due to unrecovered cost increases from higher raw material and fuel prices associated with the situation in the Middle East. Capital investment is planned at ¥10.0 billion and depreciation expenses at ¥8.0 billion.
Shareholder Returns
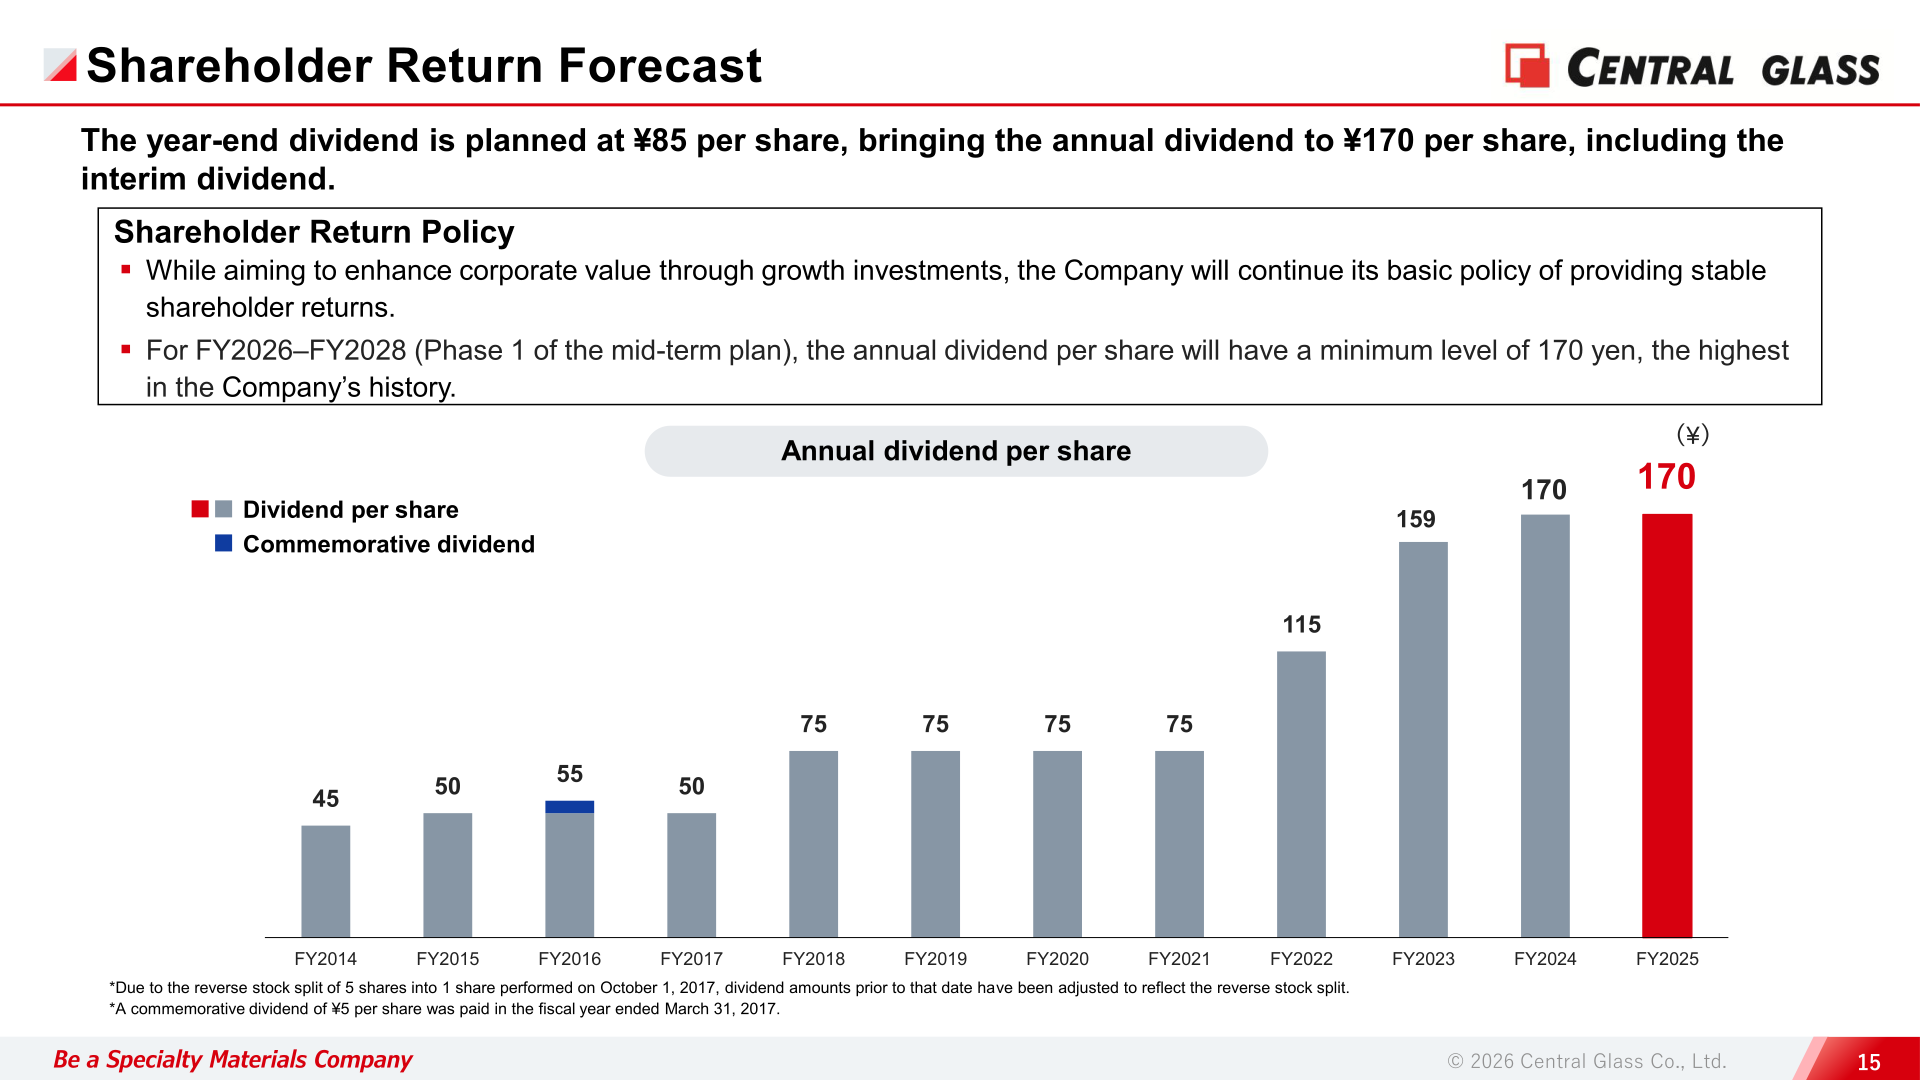
The year-end dividend for FY2025 is planned at ¥85 per share, bringing the annual dividend to ¥170 per share, including the interim dividend. For FY2026, an annual dividend of ¥170 is planned. While aiming to enhance corporate value through growth investments, the company will continue its basic policy of providing stable shareholder returns, and for Phase 1 of the mid-term plan the annual dividend per share will have a minimum level of 170 yen, the highest in the company’s history.
| Annual dividend per share | FY2024 | FY2025 | FY2026 Forecast |
|---|---|---|---|
| Annual dividend (¥) | 170 | 170 | 170 |
Medium-Term Plan: Financial Targets for VISION 2030
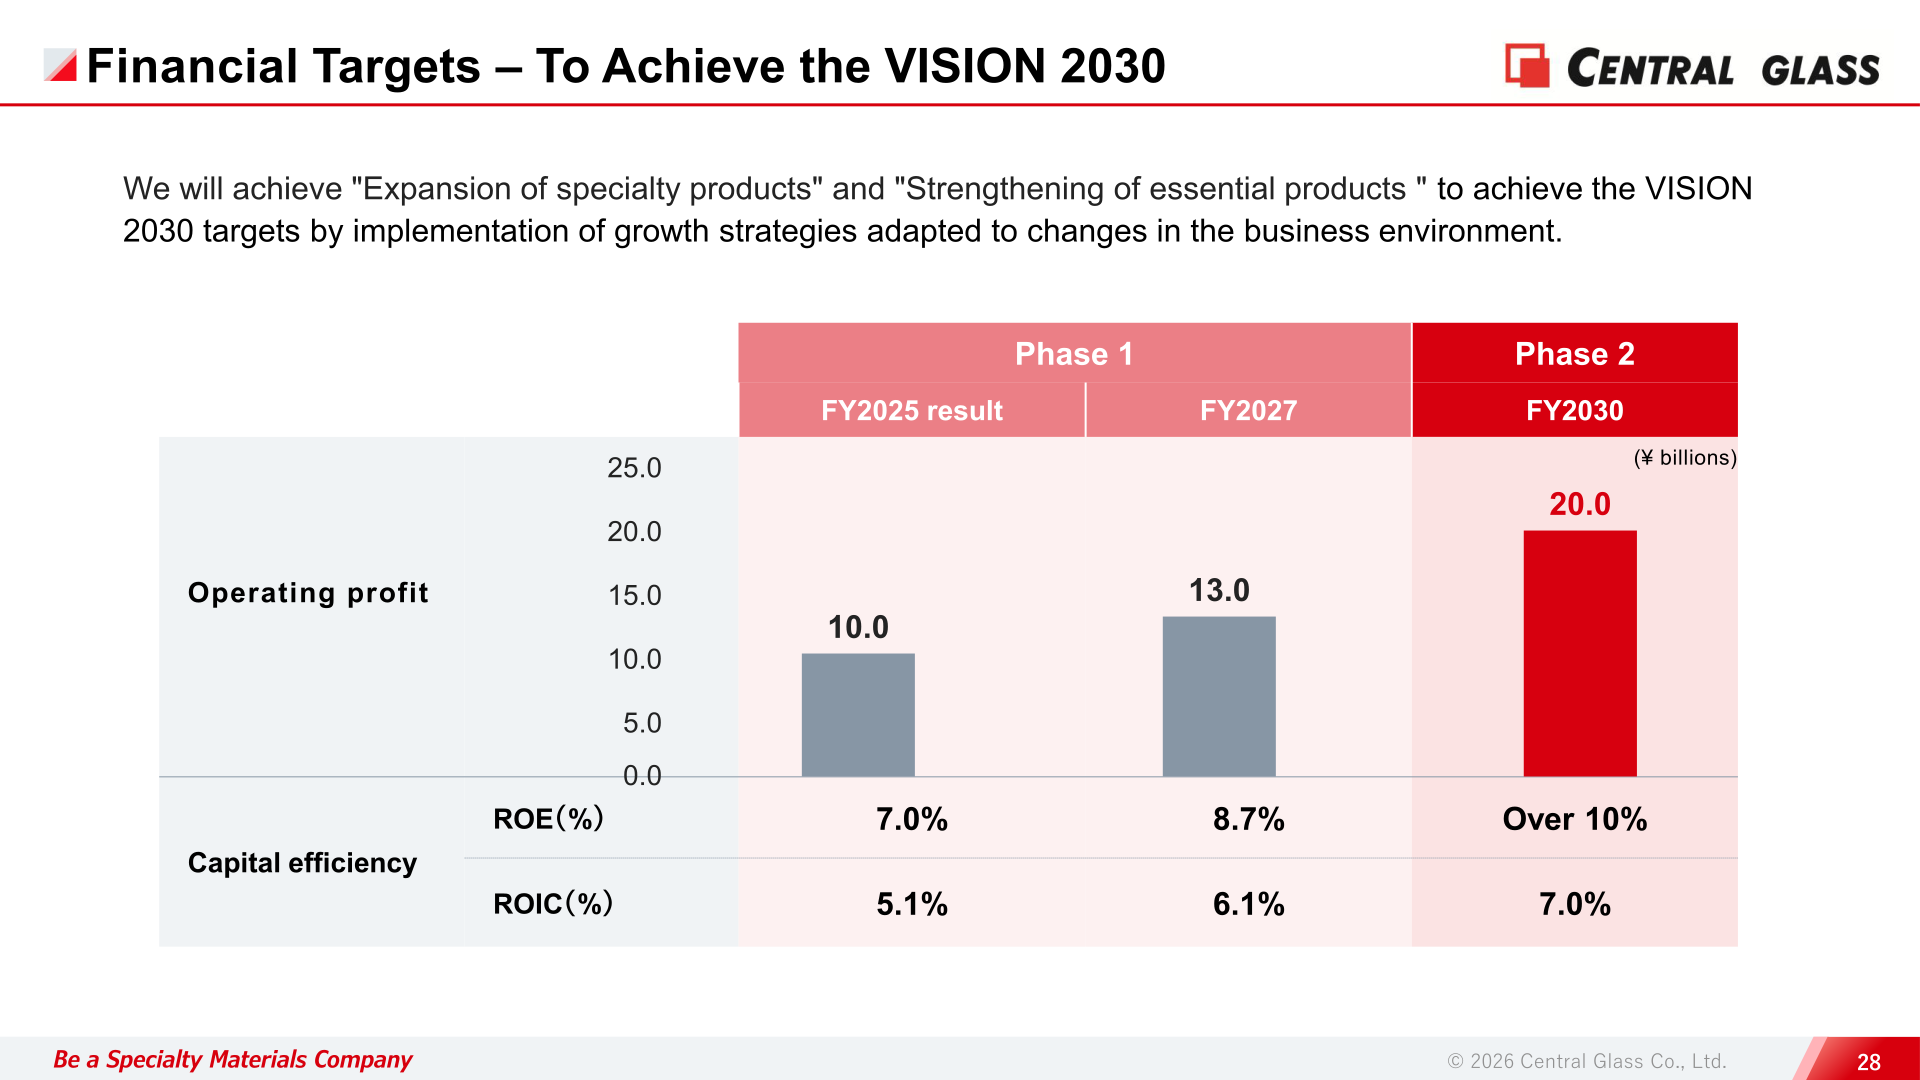
Under its medium-term plan, Central Glass aims to achieve the VISION 2030 targets through “Expansion of specialty products” and “Strengthening of essential products”. Operating profit of ¥10.0 billion in FY2025 compares with targets of ¥13.0 billion for FY2027 (Phase 1) and ¥20.0 billion for FY2030 (Phase 2). On capital efficiency, ROE was 7.0% and ROIC 5.1% in FY2025. As part of its actions to achieve management conscious of cost of capital and stock price, the company noted that although the PBR improved due to a rise in the share price, it remained below 1x, and that ROE improved while the PER declined due to an increase in EPS. The Phase 1 capital allocation plan includes growth investment of 37.0 billion yen, and the company states there are no changes to the measures or target figures for B/S management and capital allocation.
| Target | FY2025 result | FY2027 (Phase 1) | FY2030 (Phase 2) |
|---|---|---|---|
| Operating profit (¥ billions) | 10.0 | 13.0 | 20.0 |
| ROE (%) | 7.0% | 8.7% | Over 10% |
| ROIC (%) | 5.1% | 6.1% | 7.0% |
This article is an analysis based on publicly available information and is not a recommendation to buy or sell any specific securities. Investment decisions are your own responsibility.
















