
This article is based on publicly available IR materials and is not a recommendation to buy or sell any specific securities.
Note: Good Com Asset’s fiscal year ends in October. In this article, FY2025 refers to the fiscal year ended October 31, 2025 (November 1, 2024 to October 31, 2025), consistent with the labels used in the company’s presentation, and FY2026 refers to the fiscal year ending October 2026.
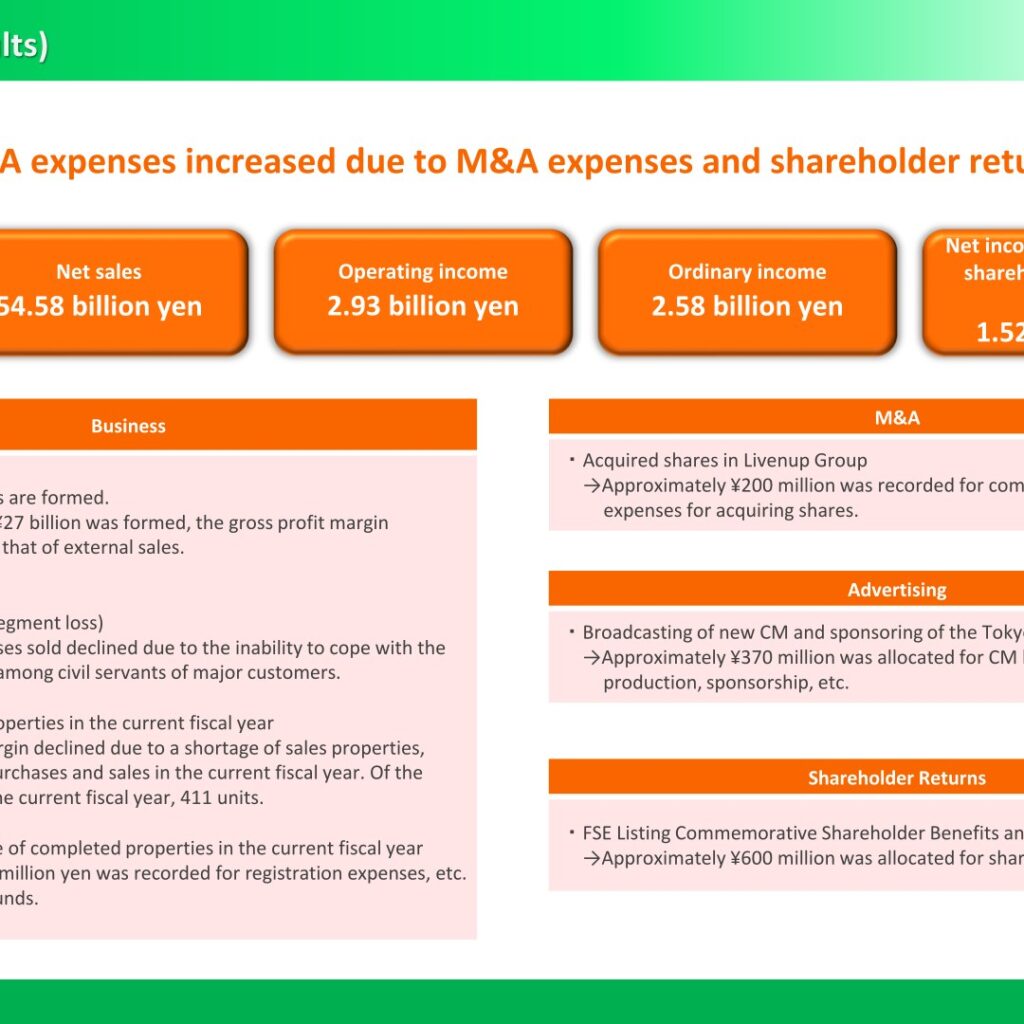
Good Com Asset Co., Ltd. (TSE Prime / FSE: 3475), which plans, develops, sells and manages investment condominiums under its own GENOVIA brand mainly in Tokyo’s 23 wards, reported lower sales and profits for FY2025. Net sales fell 8.7% year on year to 54.58 billion yen and operating income fell 46.2% to 2.93 billion yen, as selling, general and administrative expenses rose 43.6% on M&A expenses, advertising and shareholder benefit costs, and as the formation of real estate funds No. 3 and No. 4 lowered the gross profit margin. For FY2026, the company forecasts higher sales and profits due to its abundant lineup of properties, with net sales of 79.28 billion yen and operating income of 7.72 billion yen, and expects to raise its dividend for the ninth consecutive year.
Consolidated Results (Full-Year Actual)
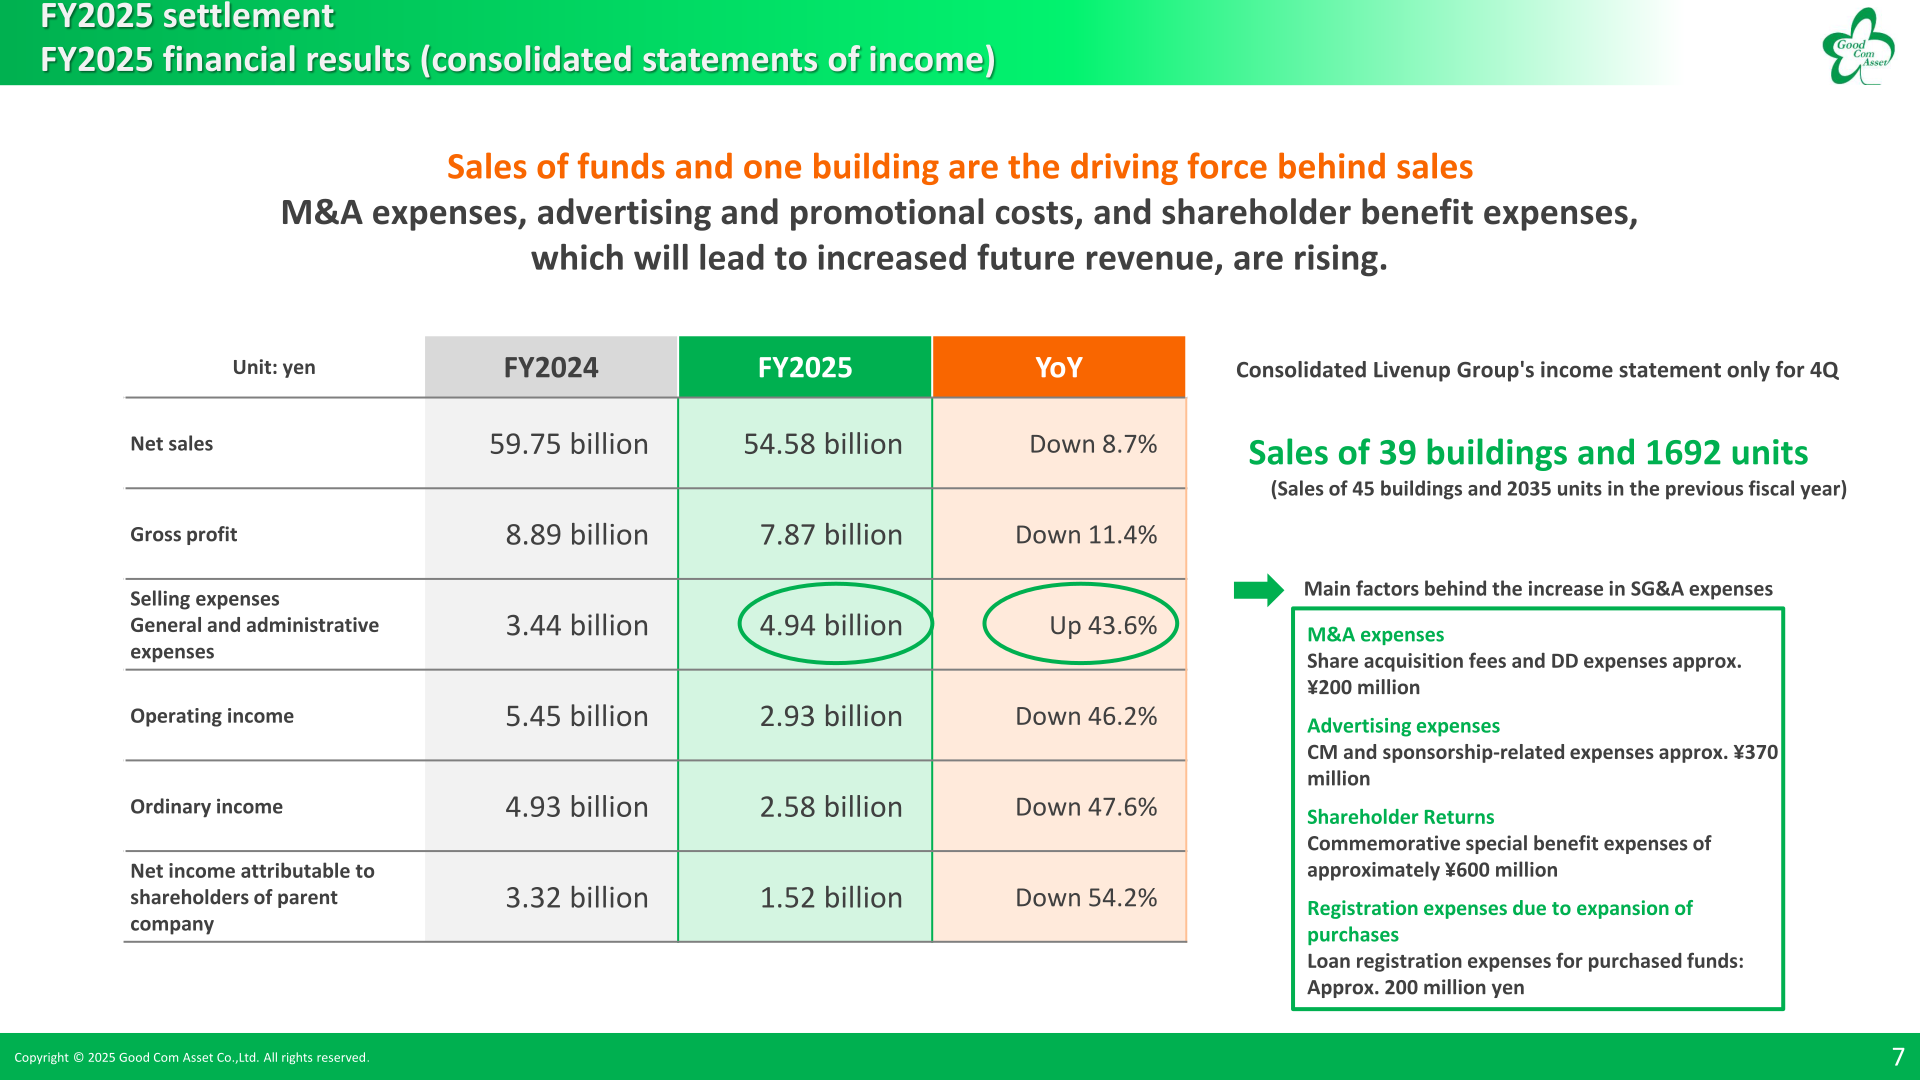
The company sold 39 buildings and 1692 units in FY2025, compared with 45 buildings and 2035 units in the previous fiscal year. It describes sales of funds and one building as the driving force behind sales. Net income attributable to shareholders of parent company decreased 54.2% to 1.52 billion yen. The income statement of Livenup Group, which became a consolidated subsidiary, was consolidated only for the fourth quarter.
| Item (yen) | FY2025 | FY2024 | YoY |
|---|---|---|---|
| Net sales | 54.58 billion | 59.75 billion | Down 8.7% |
| Gross profit | 7.87 billion | 8.89 billion | Down 11.4% |
| Selling, general and administrative expenses | 4.94 billion | 3.44 billion | Up 43.6% |
| Operating income | 2.93 billion | 5.45 billion | Down 46.2% |
| Ordinary income | 2.58 billion | 4.93 billion | Down 47.6% |
| Net income attributable to shareholders of parent company | 1.52 billion | 3.32 billion | Down 54.2% |
The company lists the main factors behind the increase in SG&A expenses as: M&A expenses (share acquisition fees and due diligence expenses of approximately ¥200 million related to the acquisition of Livenup Group shares); advertising expenses (approximately ¥370 million for broadcasting and production of a new TV commercial and sponsorship of Tokyo Verdy); shareholder returns (commemorative special benefit expenses of approximately ¥600 million for the FSE listing); and loan registration expenses of approximately 200 million yen for borrowings used to fund the expanded purchase of completed properties. The company describes the M&A, advertising and shareholder benefit expenses as costs that will lead to increased future revenue.
On the business side, the formation of the third and fourth funds, totaling about ¥27 billion, reduced the gross profit margin compared with external sales. Retail sales recorded a segment loss of approximately ¥1.2 billion, as the number of units sold declined because the company could not cope with the sharp rise in prices for its main customer base of civil servants. In addition, a shortage of properties for sale led to properties being purchased and sold within the same fiscal year, which lowered the gross profit margin; of the 1692 units sold in FY2025, 411 units fell into this category.
On the balance sheet, total assets increased to 46.28 billion yen from 39.46 billion yen, with inventories rising to 29.52 billion yen and interest-bearing debt to 27.79 billion yen due to the expansion of purchases and the balance sheet consolidation of Livenup Group from the third quarter. Fixed assets increased to 3.7 billion yen, reflecting the acquisition of shares of Nissei Advance and Livenup Group and investment in the third and fourth funds. Cash and deposits decreased as a result of procurement deposits, investment in funds, M&A expenses and shareholder returns (share buybacks, dividends and special benefits). The equity ratio was 30.7%.
| Item (yen) | FY2025 | FY2024 | Change |
|---|---|---|---|
| Current assets | 42.57 billion | 38.28 billion | 4.29 billion |
| Cash and deposits | 9.54 billion | 11.66 billion | (2.11 billion) |
| Inventories | 29.52 billion | 24.09 billion | 5.42 billion |
| Fixed assets | 3.7 billion | 1.17 billion | 2.53 billion |
| Total assets | 46.28 billion | 39.46 billion | 6.82 billion |
| Interest-bearing debt | 27.79 billion | 19.82 billion | 7.96 billion |
| Net assets | 14.54 billion | 13.93 billion | 600 million |
| Equity ratio | 30.7% | 35.3% | (4.7pt) |
| Debt to total assets | 60.1% | 50.2% | 9.8pt |
Sales by Customer Type and Business Topics
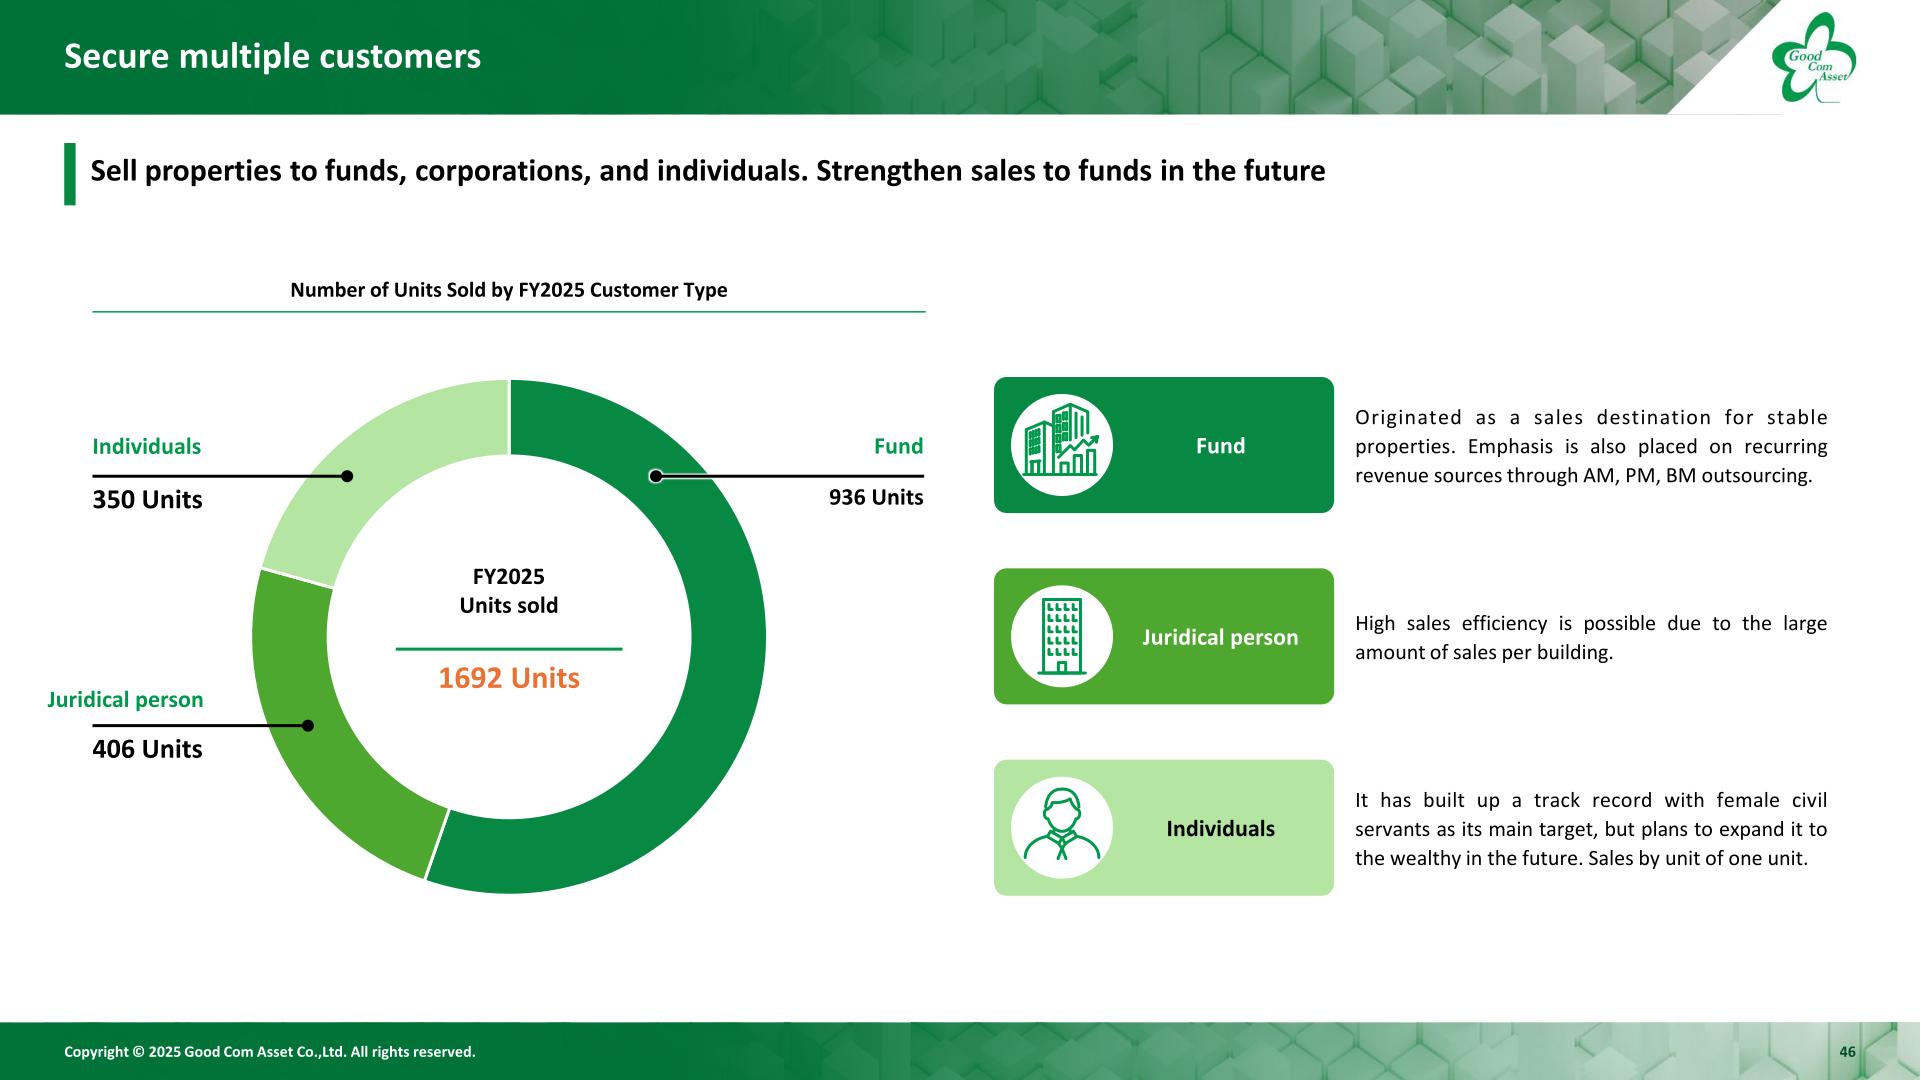
The presentation does not include a segment-by-segment breakdown of sales and profit, so detailed segment figures cannot be confirmed from the materials. The company’s segments are Wholesale (sales to corporations), Retail Sales (sales to individual investors), Livenup Group (detached house sales and renovation and resale of existing homes), Real Estate Management (building management, rent management and rent obligation guarantees) and Others. By customer type, of the 1692 units sold in FY2025, 936 units were sold to funds, 406 units to corporations and 350 units to individuals. The company plans to strengthen sales to funds going forward.
| Customer Type | FY2025 Units Sold |
|---|---|
| Fund | 936 Units |
| Juridical person (corporations) | 406 Units |
| Individuals | 350 Units |
| Total | 1692 Units |
Key topics in FY2025 included the establishment of real estate funds No. 3 (Tokyo Area Residential 3 GK, four GENOVIA properties totaling 332 units, total assets of approx. 11.1 billion yen, effective April 30, 2025) and No. 4 (Tokyo Area Residential 4 GK, 12 GENOVIA properties totaling 604 units, total assets of approx. 16.1 billion yen, effective September 30, 2025). Total fund assets were approx. 43.2 billion yen as of October 31, 2025. The company also formed a capital and business alliance with Nissei Advance to expand purchases in the Kansai area (three buildings in Kansai have already been purchased), made Livenup Group a consolidated subsidiary to enter the new detached house market, and launched the new high-end condominium brand “G-classt,” with construction of four buildings (Akabane, Ontakesan, Shinjuku and Asakusa) started or planned by December 2025.
The company reports that it has secured property worth ¥106.9 billion, including properties for which purchase contracts have been concluded or agreed on with only a deposit paid (and which are therefore not recorded on the balance sheet), and a pipeline of 66 buildings totaling 4832 units as of December 12, 2025.
FY2026 Forecast
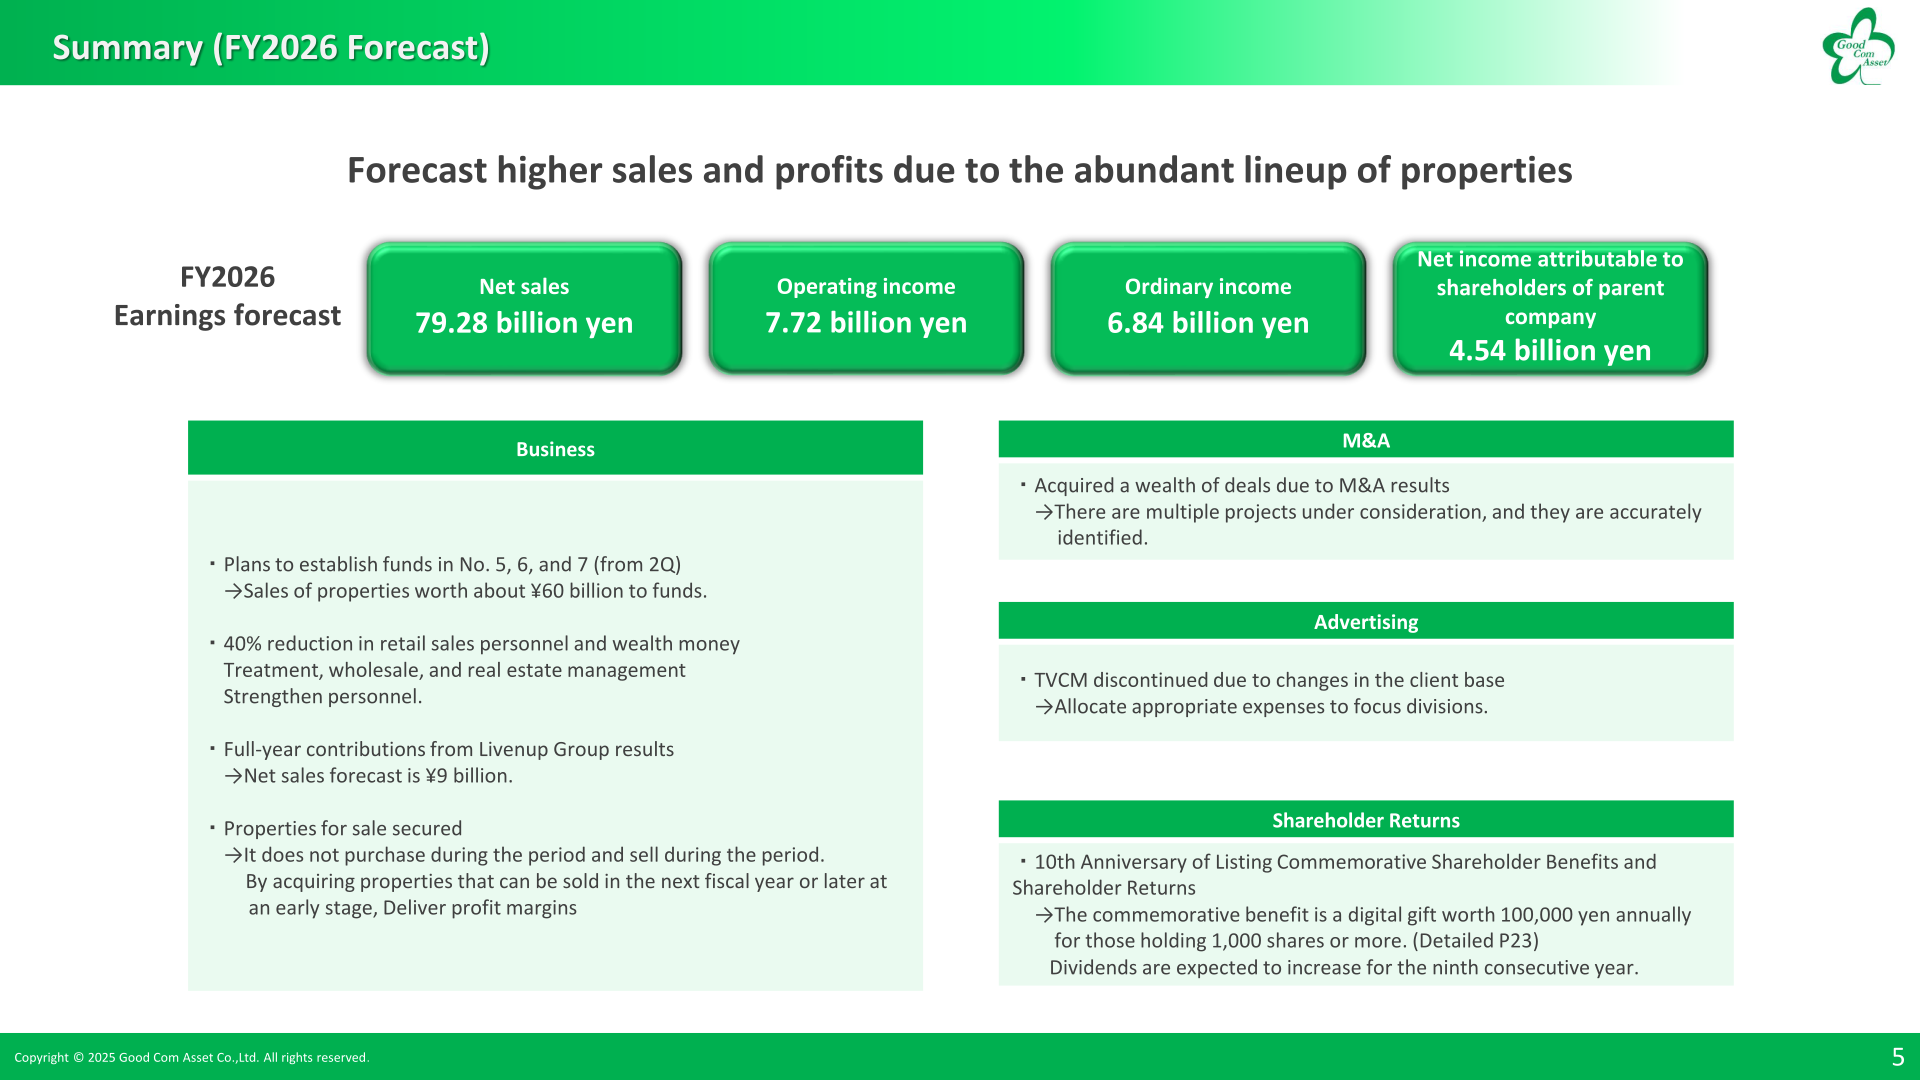
For FY2026, the company forecasts higher sales and profits due to the abundant lineup of properties. It plans to establish funds No. 5, 6 and 7 (from the second quarter), with sales of properties worth about ¥60 billion to funds. Livenup Group is expected to make a full-year contribution, with a net sales forecast of ¥9 billion. The company plans a 40% reduction in retail sales personnel while strengthening personnel in wealth management, wholesale and real estate management. Having secured properties for sale, it will not purchase and sell properties within the same period, and aims to protect profit margins by acquiring properties that can be sold in the next fiscal year or later at an early stage. TV commercials will be discontinued due to changes in the client base, with expenses allocated to focus divisions. On M&A, the company states that there are multiple projects under consideration.
| Item (yen) | FY2026 Forecast | FY2025 (Actual) |
|---|---|---|
| Net sales | 79.28 billion | 54.58 billion |
| Operating income | 7.72 billion | 2.93 billion |
| Ordinary income | 6.84 billion | 2.58 billion |
| Net income attributable to shareholders of parent company | 4.54 billion | 1.52 billion |
Shareholder Returns
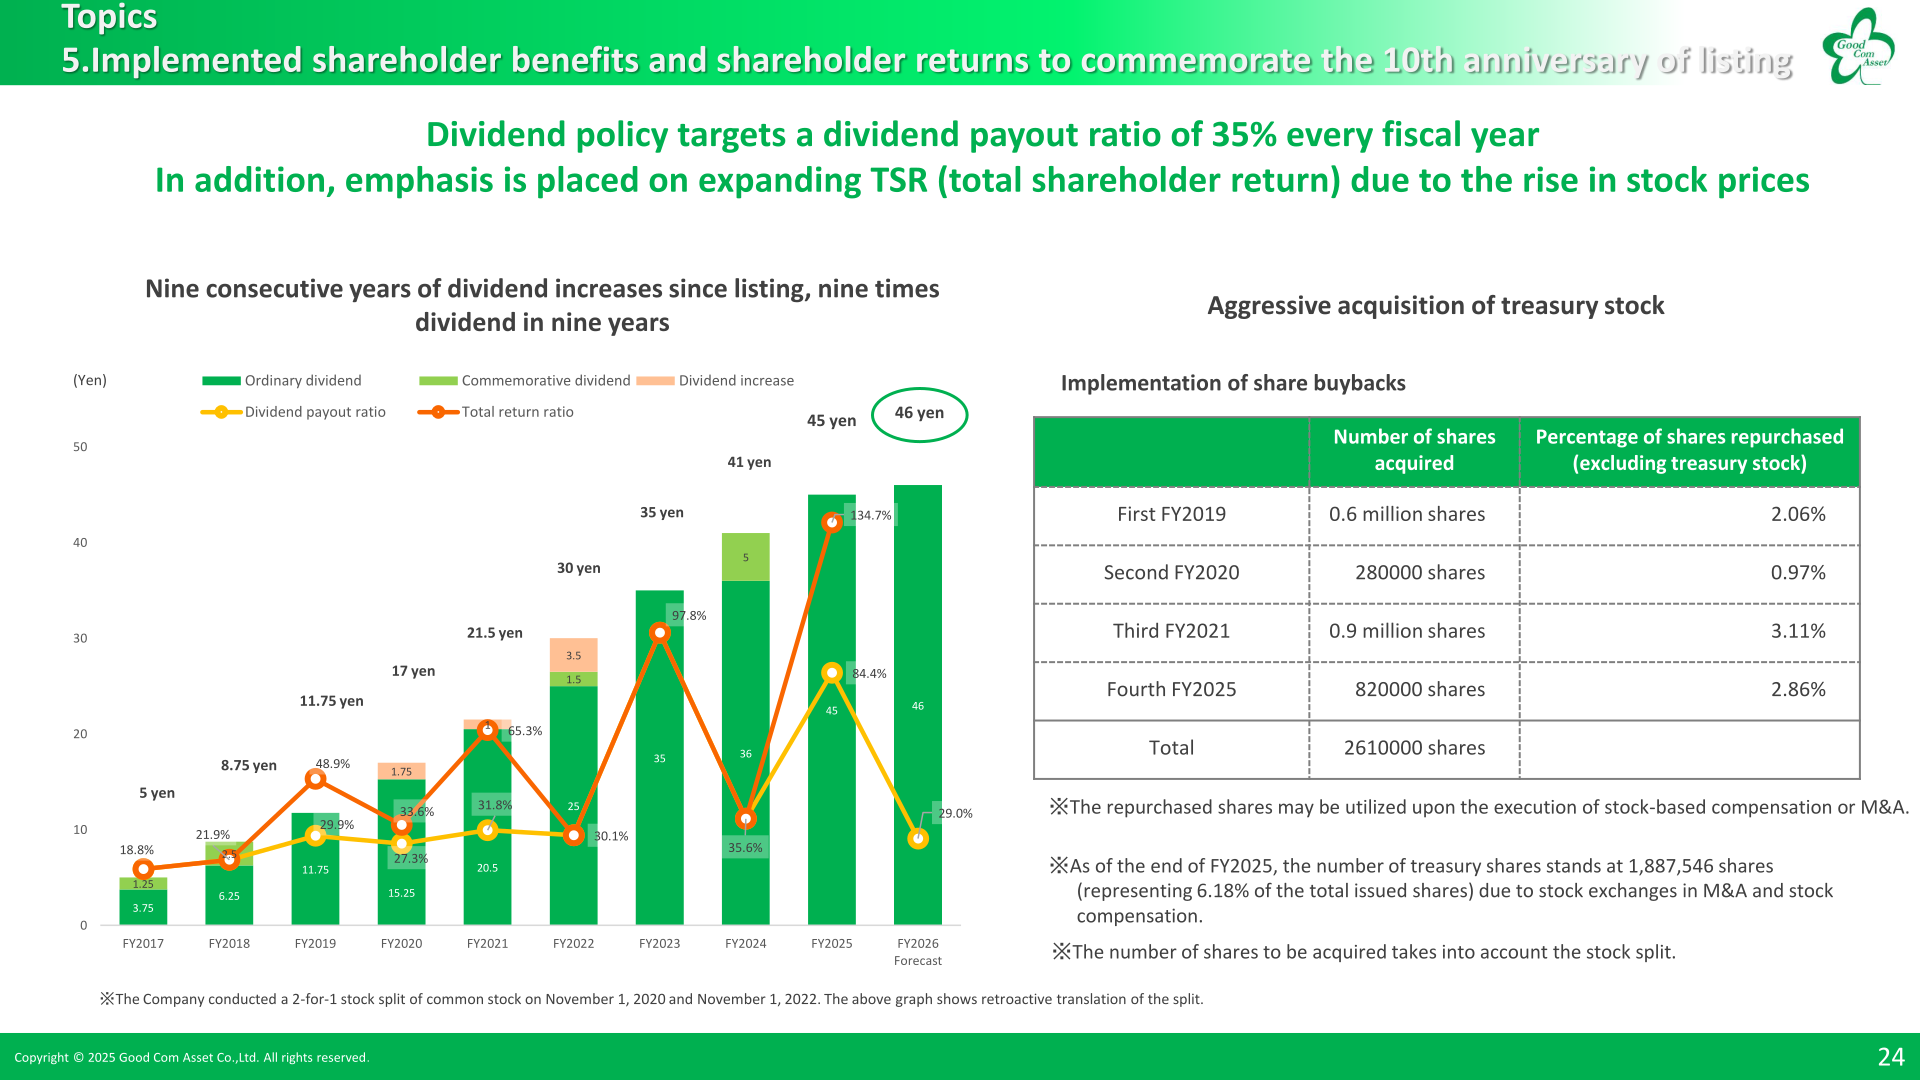
The company’s dividend policy targets a dividend payout ratio of 35% every fiscal year, and it also emphasizes expanding total shareholder return (TSR). The annual dividend for FY2025 was 45 yen, up from 41 yen in FY2024, and the FY2026 dividend is forecast at 46 yen, which would be the ninth consecutive annual increase. The dividend payout ratio for FY2025 was 84.4% and the total return ratio was 134.7%. In FY2025, the company carried out its fourth share buyback, acquiring 820000 shares (2.86% of shares excluding treasury stock). As of the end of FY2025, treasury shares stood at 1,887,546 shares (6.18% of total issued shares), and the repurchased shares may be used for stock-based compensation or M&A.
| Annual Dividend per Share (yen) | FY2023 | FY2024 | FY2025 | FY2026 (Forecast) |
|---|---|---|---|---|
| Annual dividend | 35 | 41 | 45 | 46 |
Dividend figures reflect the 2-for-1 stock splits conducted on November 1, 2020 and November 1, 2022. The FY2024 dividend included a 20th anniversary commemorative dividend. To commemorate the 10th anniversary of its initial listing in 2026, the company will present digital gifts worth 50,000 yen to shareholders holding 1,000 shares or more as of the end of April 2026 and again as of the end of October 2026 (100,000 yen worth annually). The company puts the commemorative benefit yield at approx. 9.0% and the dividend plus benefit yield at approx. 13.2% for the minimum qualifying holding, based on the closing stock price on December 12, 2025.
Medium-Term Management Plan (2026-2030)
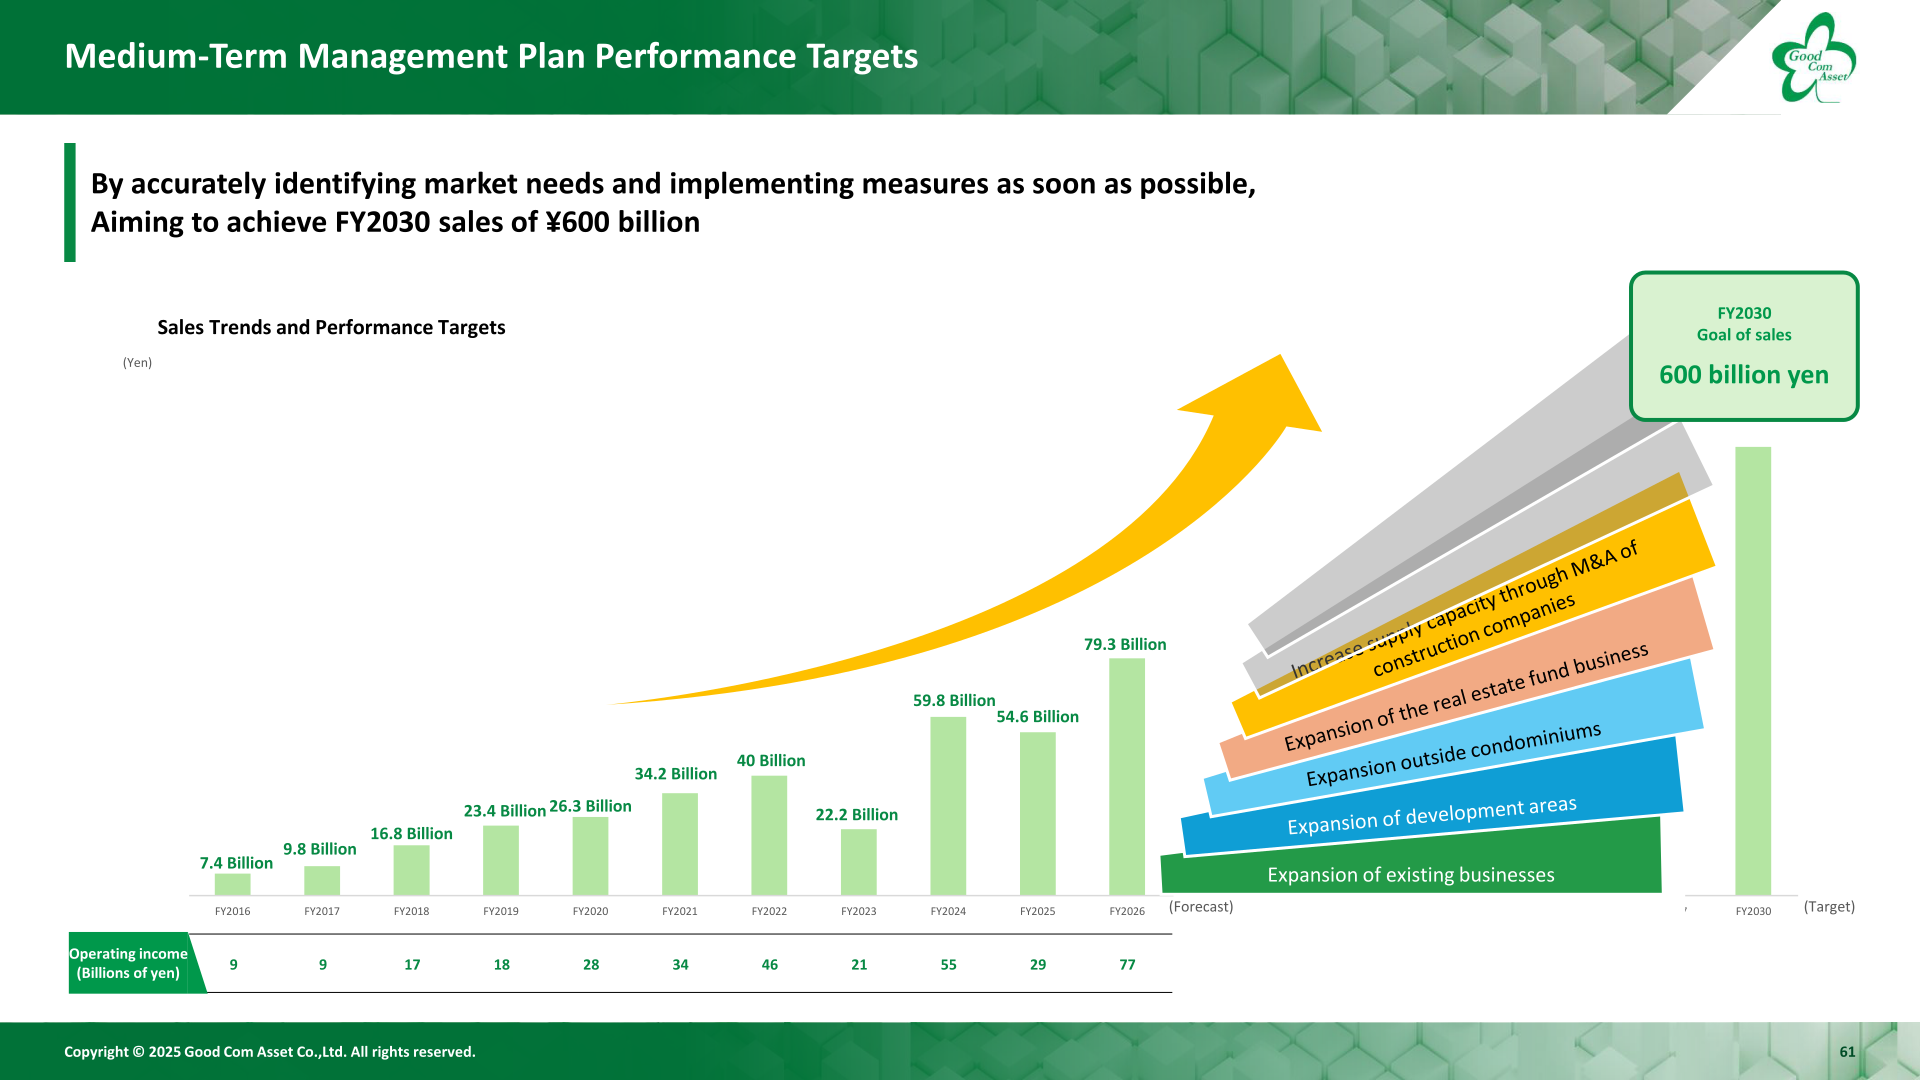
Alongside the results, the company announced a Medium-Term Management Plan for 2026-2030 under the vision of creating a leading real estate company in the 21st century, aiming to be among the top real estate companies by market capitalization by the release of FY2030 results. The plan targets FY2030 sales of 600 billion yen through the expansion of existing businesses, expansion of development areas, expansion outside condominiums, expansion of the real estate fund business and increased supply capacity through M&A of construction companies.
Key strategies include aggressive M&A, including acceleration of M&A through share exchanges and M&A of construction companies to build an integrated value chain; growth of the real estate fund business, expanding from private funds to private REITs and listed REITs, and considering a real estate STO mainly targeting retail investors; area expansion into the Kansai region through the alliance with Nissei Advance; and the establishment of a wealth consulting department targeting high-net-worth individuals as buyers of G-classt condominiums. On financial discipline, the company plans for the time being to conduct M&A using treasury stock, sets the equity ratio at 30% or more from the viewpoint of financial soundness, and targets a dividend payout ratio of 35% or more.
This article is an analysis based on publicly available information and is not a recommendation to buy or sell any specific securities. Investment decisions are your own responsibility.
















