
This article is based on publicly available IR materials and is not a recommendation to buy or sell any specific securities.
Note: KI-STAR REAL ESTATE CO., LTD. (KEIAI) has a March fiscal year-end and labels the fiscal year covered here as “FY3/26” (the fiscal year ended March 31, 2026); on this site the most recently completed fiscal year is classified as FY2025, and the labels used in the text, tables and segment data below follow the company’s own materials.
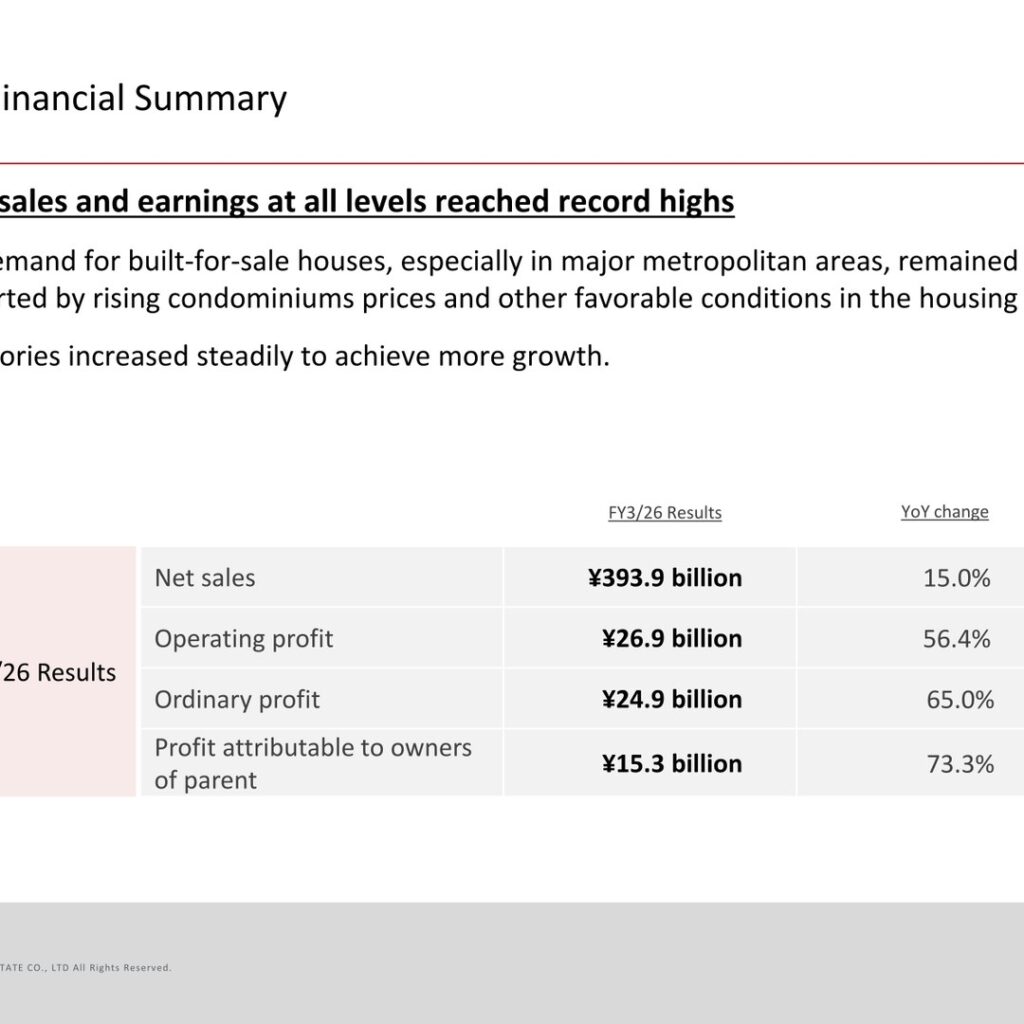
KI-Star Real Estate reported FY3/26 net sales of 393,905 million yen (up 15.0% YoY), operating profit of 26,995 million yen (up 56.4%), ordinary profit of 24,963 million yen (up 65.0%) and profit attributable to owners of parent of 15,355 million yen (up 73.3%), with sales and earnings at all levels reaching record highs. The company says demand for built-for-sale houses, especially in major metropolitan areas, remained strong, supported by rising condominium prices and other favorable conditions in the housing market, and that inventories increased steadily to achieve more growth. For FY3/27, it forecasts net sales of 450,000 million yen and profit attributable to owners of parent of 17,500 million yen, above the goals in its Medium-term Plan, and it raised the FY3/26 dividend to 235 yen per share.
Consolidated Results (Full-Year Actual)
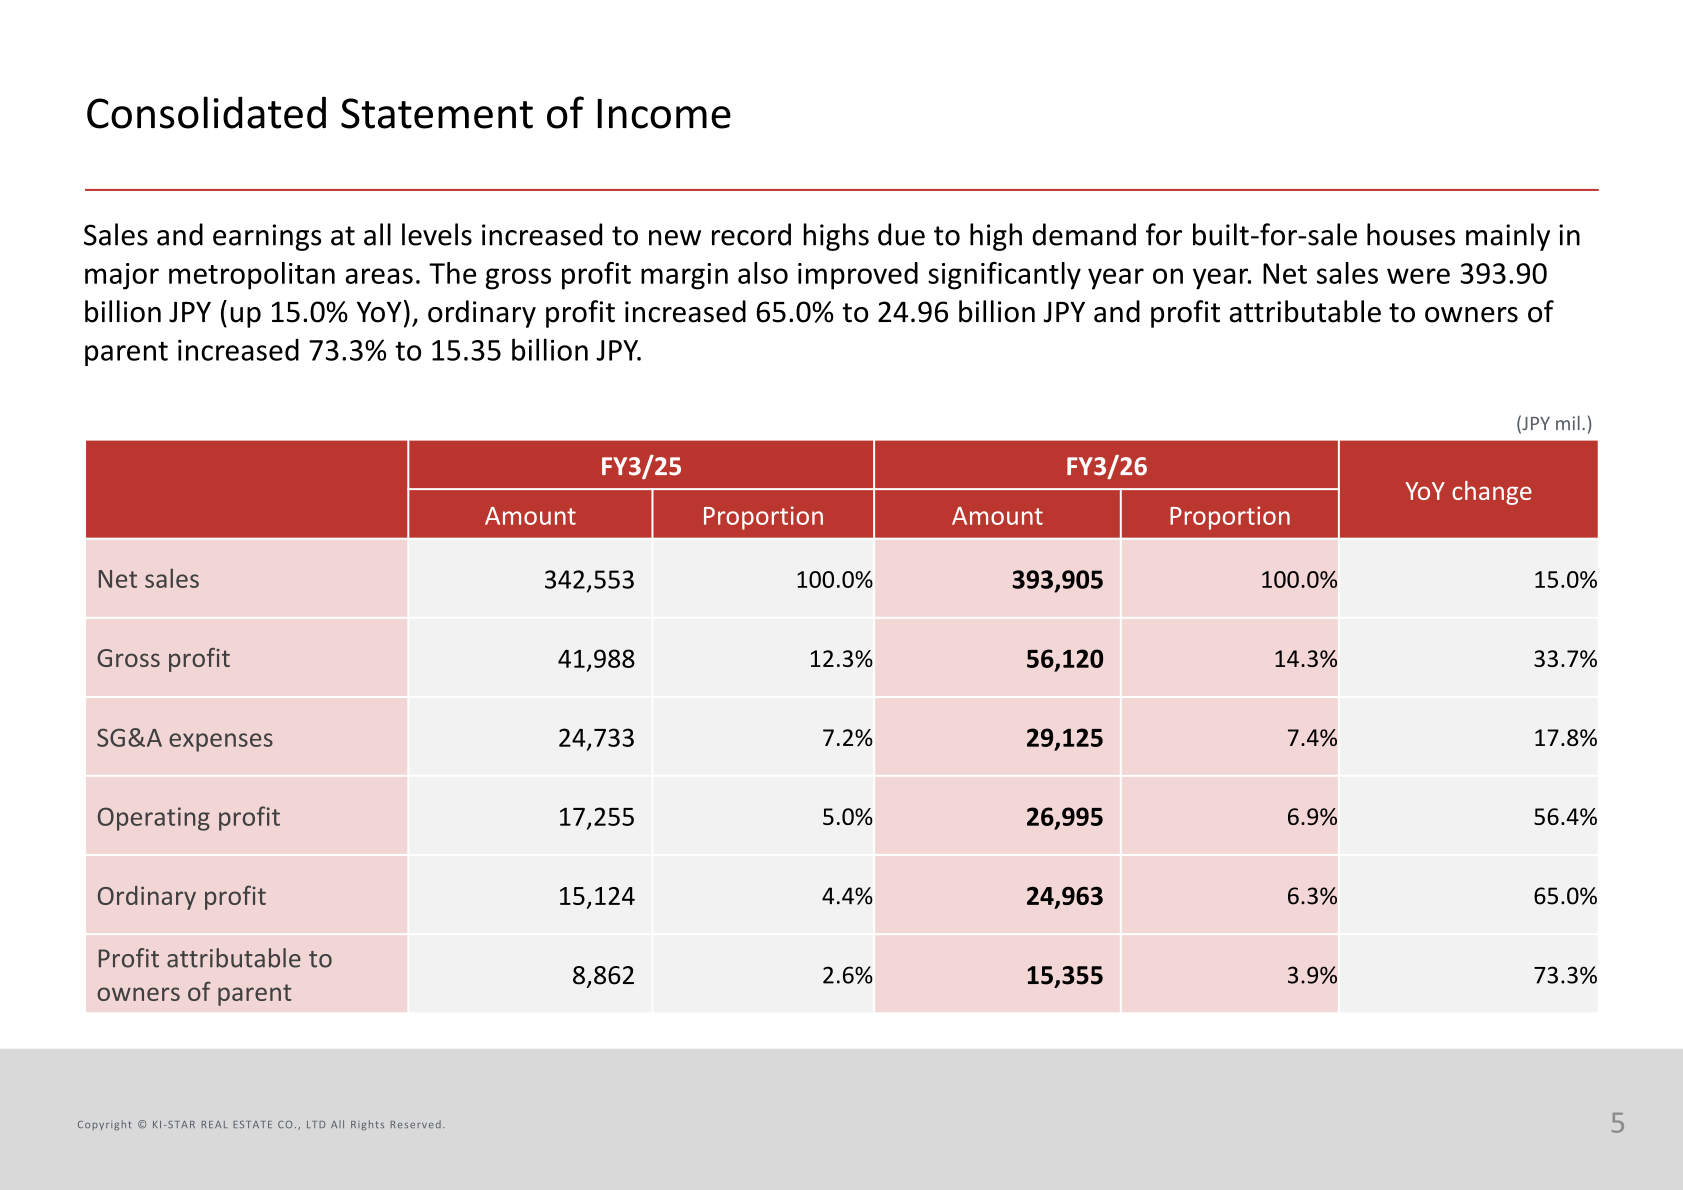
Sales and earnings at all levels increased to new record highs due to high demand for built-for-sale houses mainly in major metropolitan areas. Gross profit rose 33.7% to 56,120 million yen, lifting the gross profit margin to 14.3% from 12.3%, an improvement the company describes as about 2 percentage points year on year. SG&A expenses increased 17.8% to 29,125 million yen, and the ratio of SG&A expenses to sales remained flat at 7.4% compared to the previous year, according to the company. Operating profit margin rose to 6.9% from 5.0%.
| Item (JPY mil.) | FY3/26 | Proportion | FY3/25 | Proportion | YoY change |
|---|---|---|---|---|---|
| Net sales | 393,905 | 100.0% | 342,553 | 100.0% | 15.0% |
| Gross profit | 56,120 | 14.3% | 41,988 | 12.3% | 33.7% |
| SG&A expenses | 29,125 | 7.4% | 24,733 | 7.2% | 17.8% |
| Operating profit | 26,995 | 6.9% | 17,255 | 5.0% | 56.4% |
| Ordinary profit | 24,963 | 6.3% | 15,124 | 4.4% | 65.0% |
| Profit attributable to owners of parent | 15,355 | 3.9% | 8,862 | 2.6% | 73.3% |
Results exceeded the upward-revised full-year forecast: net sales reached 102.8% of the revised plan of 383,000 million yen, operating profit 103.8% of the 26,000 million yen plan, ordinary profit 104.0% of the 24,000 million yen plan, and profit attributable to owners of parent 107.4% of the 14,300 million yen plan. Fourth-quarter sales exceeded 110 billion JPY (117,031 million yen) due to increased sales activities; the company notes a slight decline in the gross profit margin in 4Q, but says performance remained strong, including improved inventory turnover, for growth in FY3/27.
At March 31, 2026, total assets were 355,621 million yen (up 61,068 million yen from a year earlier) and net assets were 82,983 million yen (up 14,181 million yen). Inventories increased by 48,545 million yen to 244,606 million yen, including real estate for sale of 115,222 million yen and real estate for sale in process of 126,893 million yen. The company states that the total inventory of land under contract for new houses surpassed 11,000 and remained stable, and that it will continue to purchase a large number of existing houses and other properties, mainly land for new houses.
Segment Results
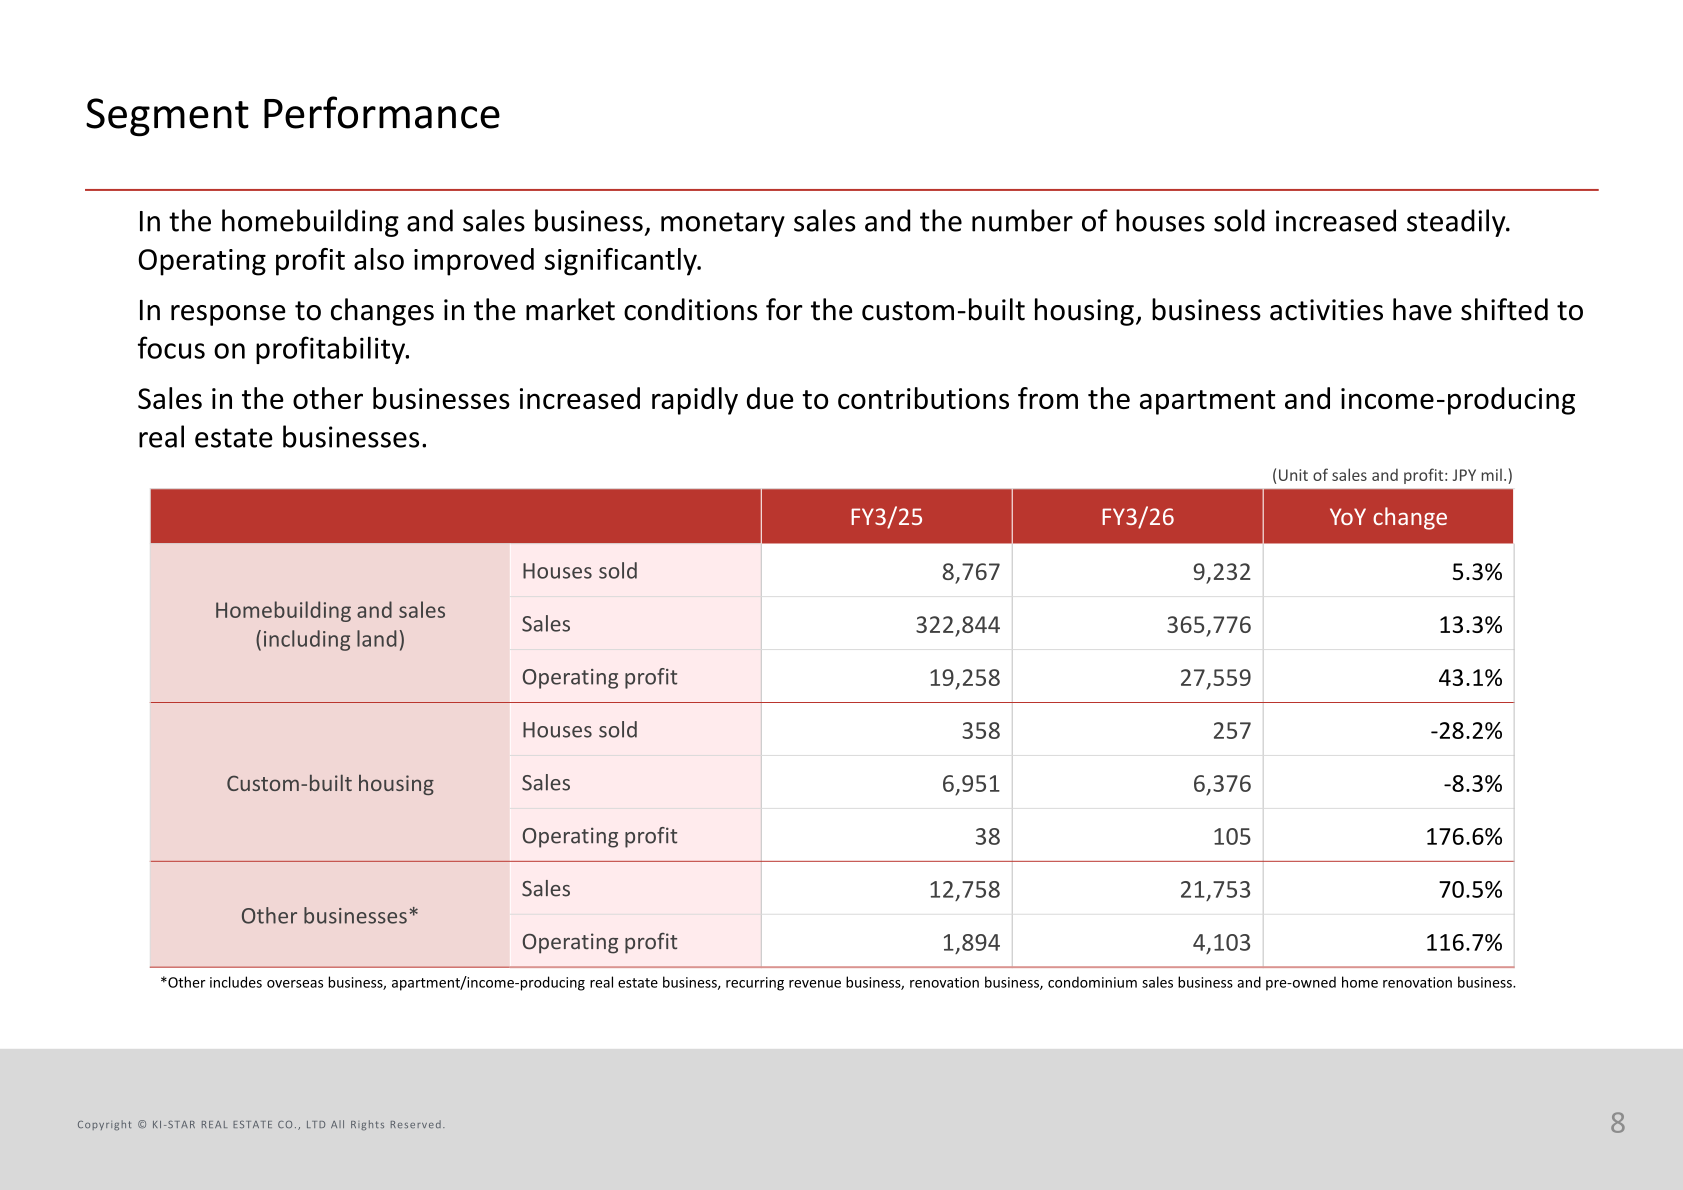
In the homebuilding and sales business (including land), monetary sales and the number of houses sold increased steadily and operating profit improved significantly: houses sold rose 5.3% to 9,232, sales rose 13.3% to 365,776 million yen and operating profit rose 43.1% to 27,559 million yen. The company says prices of houses sold are climbing slowly because of strong sales primarily in large metropolitan areas nationwide, and that its market share in the Kansai area is increasing. In custom-built housing, business activities have shifted to focus on profitability in response to changes in market conditions; houses sold fell 28.2% to 257 and sales fell 8.3% to 6,376 million yen, while operating profit rose to 105 million yen from 38 million yen. Sales in the other businesses increased 70.5% to 21,753 million yen, and operating profit rose 116.7% to 4,103 million yen, due to contributions from the apartment and income-producing real estate businesses.
| Segment | Metric | FY3/26 | FY3/25 | YoY change |
|---|---|---|---|---|
| Homebuilding and sales (including land) | Houses sold | 9,232 | 8,767 | 5.3% |
| Homebuilding and sales (including land) | Sales (JPY mil.) | 365,776 | 322,844 | 13.3% |
| Homebuilding and sales (including land) | Operating profit (JPY mil.) | 27,559 | 19,258 | 43.1% |
| Custom-built housing | Houses sold | 257 | 358 | -28.2% |
| Custom-built housing | Sales (JPY mil.) | 6,376 | 6,951 | -8.3% |
| Custom-built housing | Operating profit (JPY mil.) | 105 | 38 | 176.6% |
| Other businesses | Sales (JPY mil.) | 21,753 | 12,758 | 70.5% |
| Other businesses | Operating profit (JPY mil.) | 4,103 | 1,894 | 116.7% |
Other businesses include the overseas business, apartment/income-producing real estate business, recurring revenue business, renovation business, condominium sales business and pre-owned home renovation business.
FY3/27 Forecast
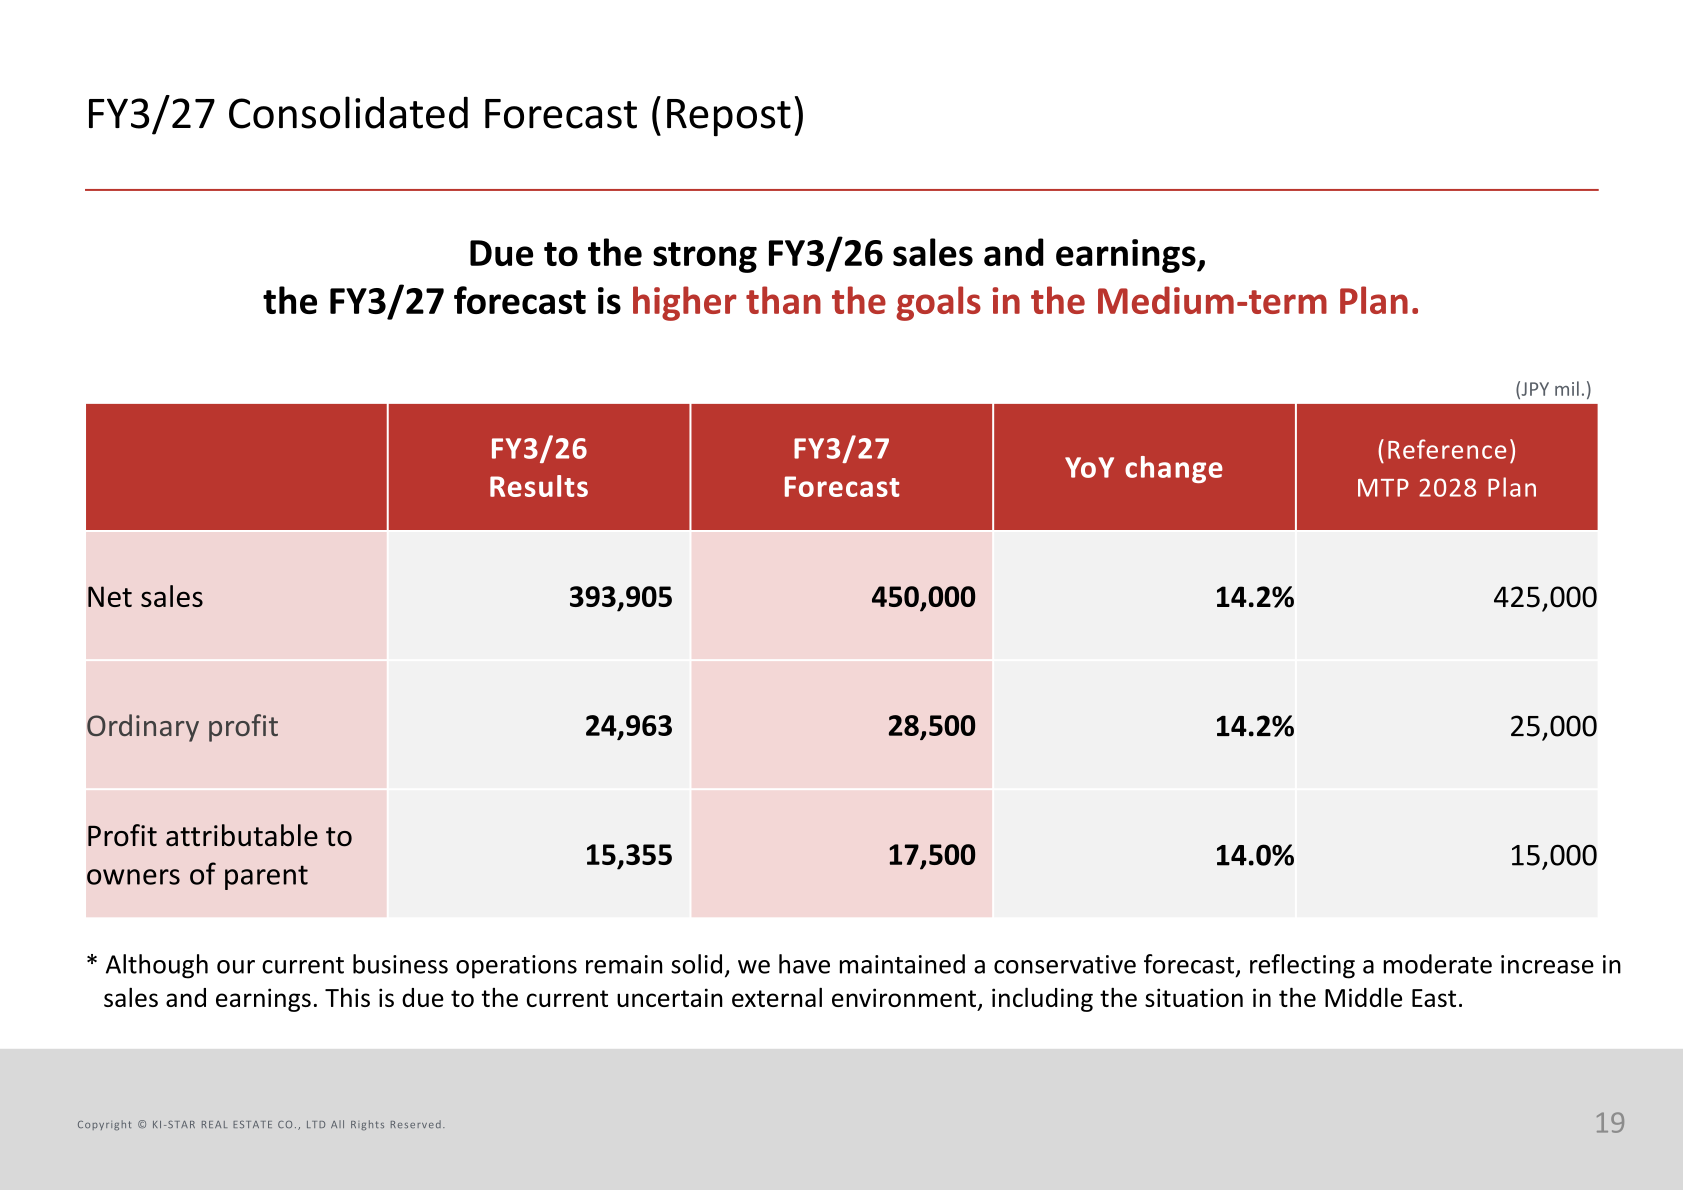
For FY3/27, KI-Star Real Estate forecasts net sales of 450,000 million yen (up 14.2%), ordinary profit of 28,500 million yen (up 14.2%) and profit attributable to owners of parent of 17,500 million yen (up 14.0%). Due to the strong FY3/26 sales and earnings, the forecast is higher than the reference figures in the Medium-term Plan 2028. The company notes that although current business operations remain solid, it has maintained a conservative forecast reflecting a moderate increase in sales and earnings, due to the current uncertain external environment, including the situation in the Middle East. An operating profit forecast is not shown in the forecast table; this cannot be confirmed from the materials.
| Item (JPY mil.) | FY3/27 Forecast | FY3/26 Results | YoY change | (Reference) MTP 2028 Plan |
|---|---|---|---|---|
| Net sales | 450,000 | 393,905 | 14.2% | 425,000 |
| Ordinary profit | 28,500 | 24,963 | 14.2% | 25,000 |
| Profit attributable to owners of parent | 17,500 | 15,355 | 14.0% | 15,000 |
Shareholder Returns
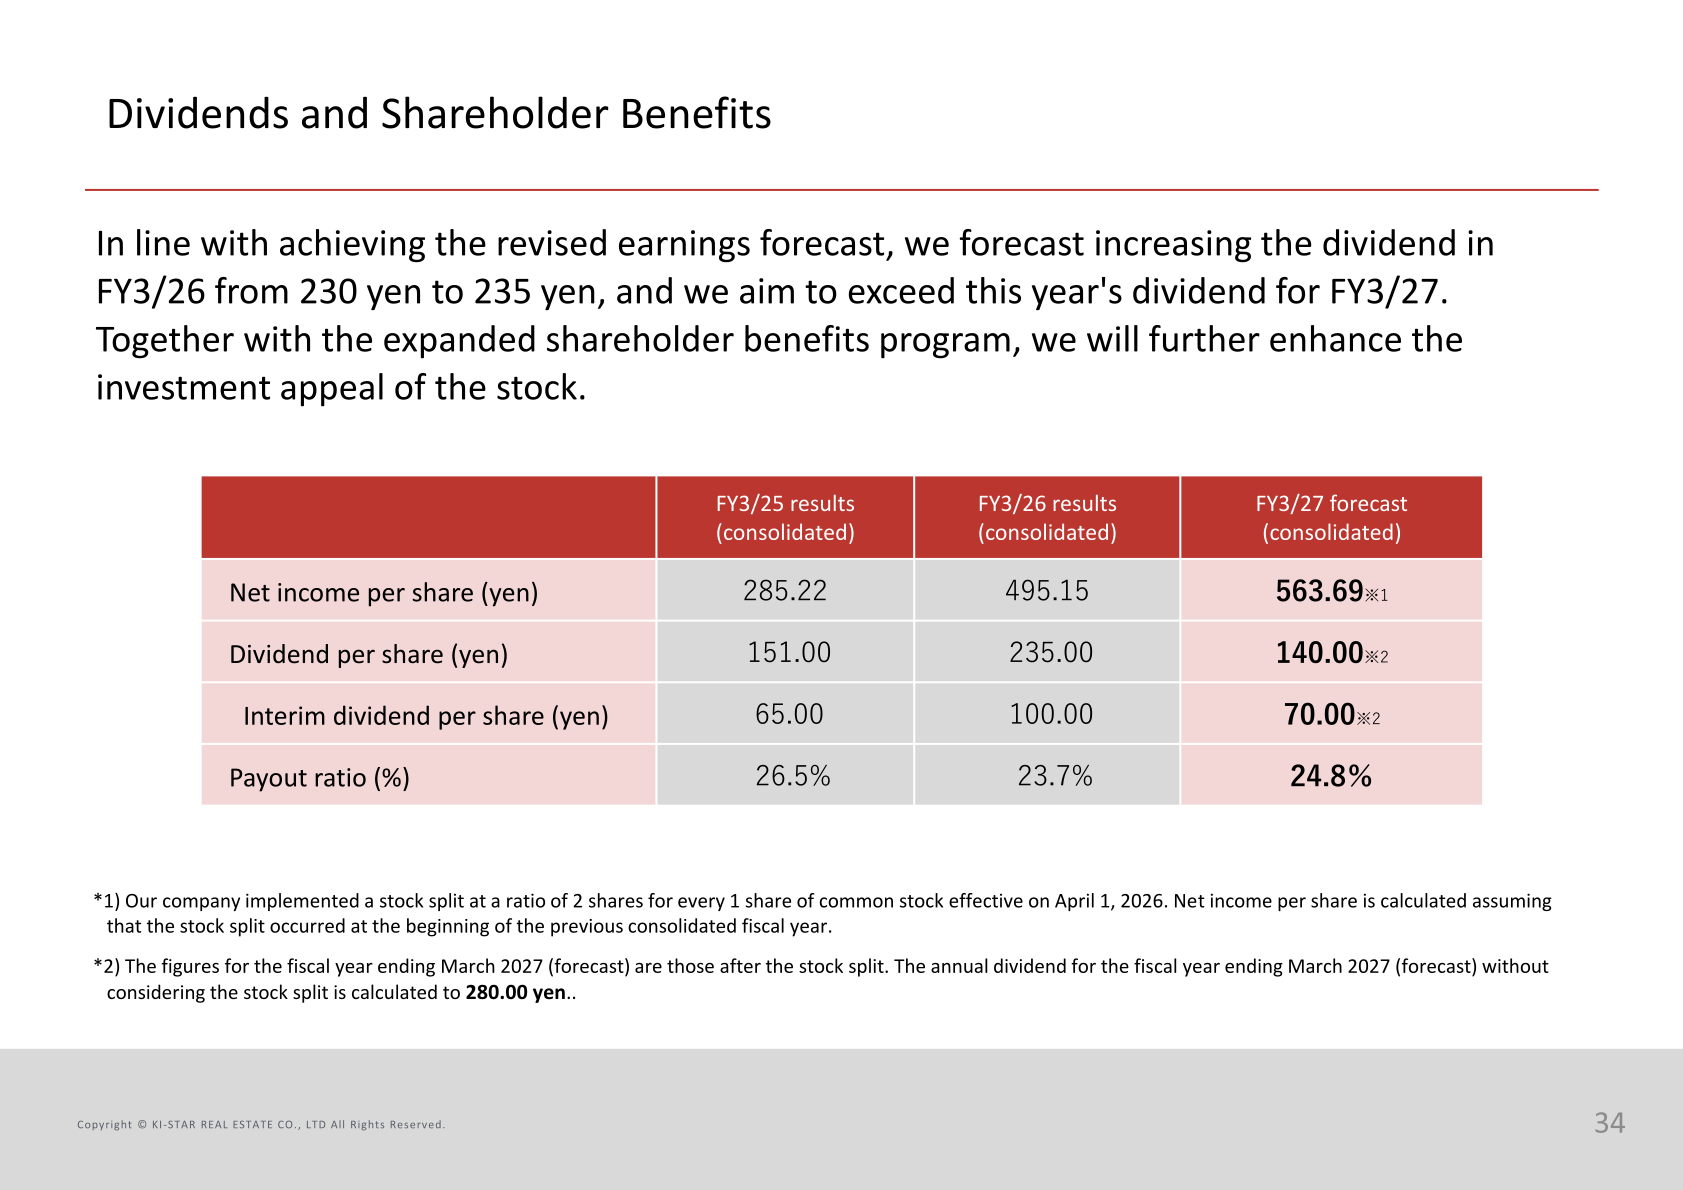
In line with achieving the revised earnings forecast, the company increased the FY3/26 dividend forecast from 230 yen to 235 yen per share (including an interim dividend of 100 yen), up from 151.00 yen in FY3/25, for a payout ratio of 23.7%. KEIAI executed a two-for-one common stock split on April 1, 2026; the FY3/27 forecast dividend is 140.00 yen per share after the split (interim 70.00 yen), which the company says would be 280.00 yen without considering the split, and it aims to exceed this year’s dividend. Going forward, in principle, the company will pay a minimum dividend of 130 yen (65 yen after the stock split) per share in conjunction with stock repurchases, depending on business performance and financial conditions. It also expanded its shareholder benefits program in February 2026, offering electronic money and similar gifts of 2,000 yen to 10,000 yen depending on the number of shares held (200 shares or more, with a continuous holding period of one year or more).
| Indicator | FY3/27 forecast | FY3/26 results | FY3/25 results |
|---|---|---|---|
| Net income per share (yen) | 563.69 | 495.15 | 285.22 |
| Dividend per share (yen) | 140.00 | 235.00 | 151.00 |
| Interim dividend per share (yen) | 70.00 | 100.00 | 65.00 |
| Payout ratio | 24.8% | 23.7% | 26.5% |
Net income per share is calculated assuming that the stock split occurred at the beginning of the previous consolidated fiscal year. The FY3/27 dividend figures are after the stock split. Under its capital policy, the company targets ROE of at least 15% by maintaining high inventory turnover and using financial leverage, and an equity ratio of at least 20%, aiming to raise the equity ratio to 25%-30% by properly structuring the business portfolio and retaining a suitable amount of earnings.
Business Strategies and Topics
The company’s FY3/27 strategy centers on growth of the core homebuilding and sales business, with more stores in urban areas mainly in the Tokyo, Nagoya and Osaka regions, alongside pre-owned home renovation, the overseas business and other new businesses. Homebuilding and sales business sales have almost doubled over the past five years, from 177,444 million yen in FY3/22 to 365,776 million yen in FY3/26, as many stores were opened nationwide and M&A further contributed to growth.
The pre-owned home renovation business, launched in February 2025, had 23 offices (11 fully operational locations) and had purchased about 500 houses, with operations starting in Hyogo and Aichi prefectures in April 2026. The company targets 100 offices as quickly as possible and a gross profit margin of at least 20%, aiming for the largest share of the market for revitalizing and selling existing homes. It also plans new products with an ASP of 17-18 million yen to target customers who need more affordable housing.
In Australia, land lots under contract have increased to more than 1,400 and orders received exceed 500 since the business started. KINTEGRA LIVING PTY LTD, a construction company in Melbourne established on January 16, 2026 with capital of 1,000,000 AUD (65.01% owned by KI-STAR REAL ESTATE AUSTRALIA PTY LTD), will perform construction work previously done by local companies, and the company aims for it to receive construction contracts for 30% of all lots. In other businesses, KEIAI ranks 12th in Japan in apartment building construction starts only four years after starting the apartment business; cumulative sales of the income-producing real estate business exceed 10 billion JPY about two years after its start; sales have started at two condominium buildings (K HOUSE Yokohama Nakamachidai and K HOUSE Omiya); paying members of the KEIAI House Support program surpassed 5,000 in November 2025; and the IKI.net franchising business had agreements with 54 companies at the end of March 2026.
This article is an analysis based on publicly available information and is not a recommendation to buy or sell any specific securities. Investment decisions are your own responsibility.
















