
This article is based on publicly available IR materials and is not a recommendation to buy or sell any specific securities.
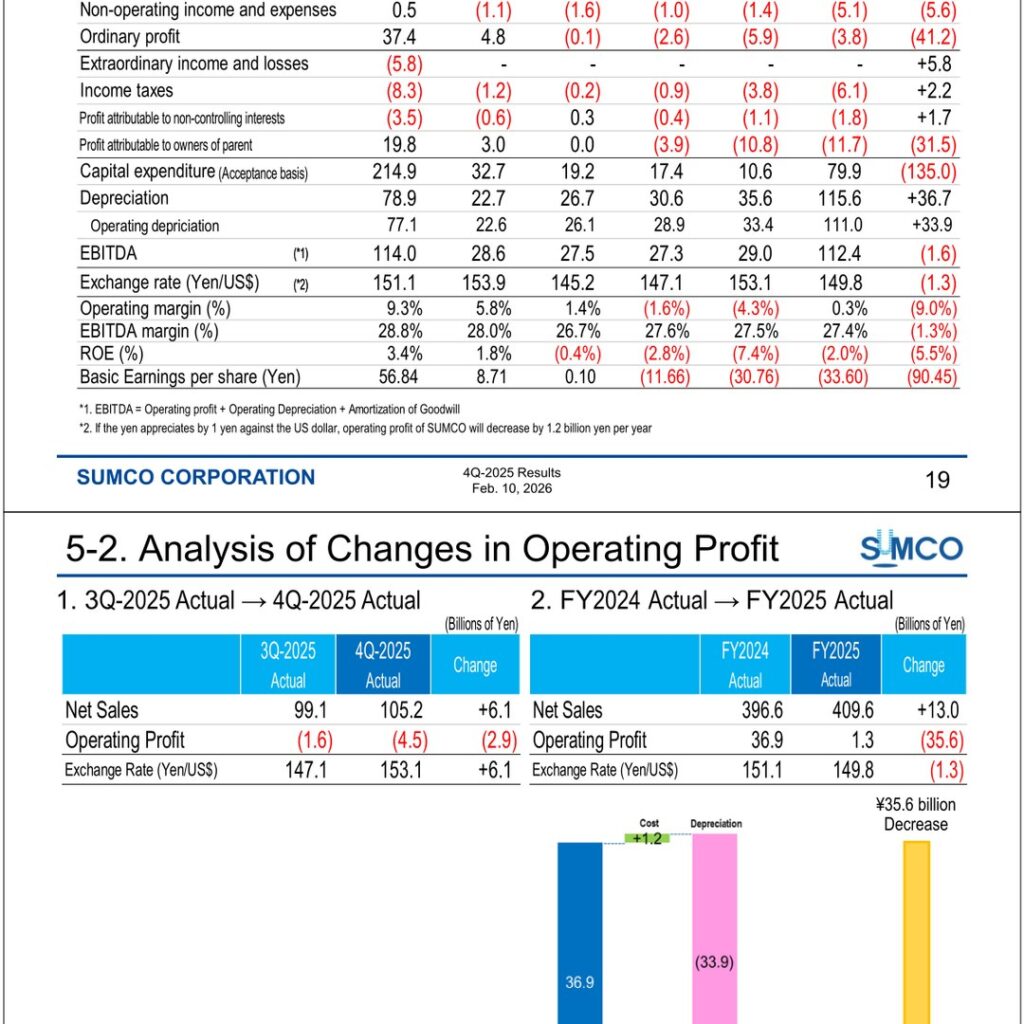
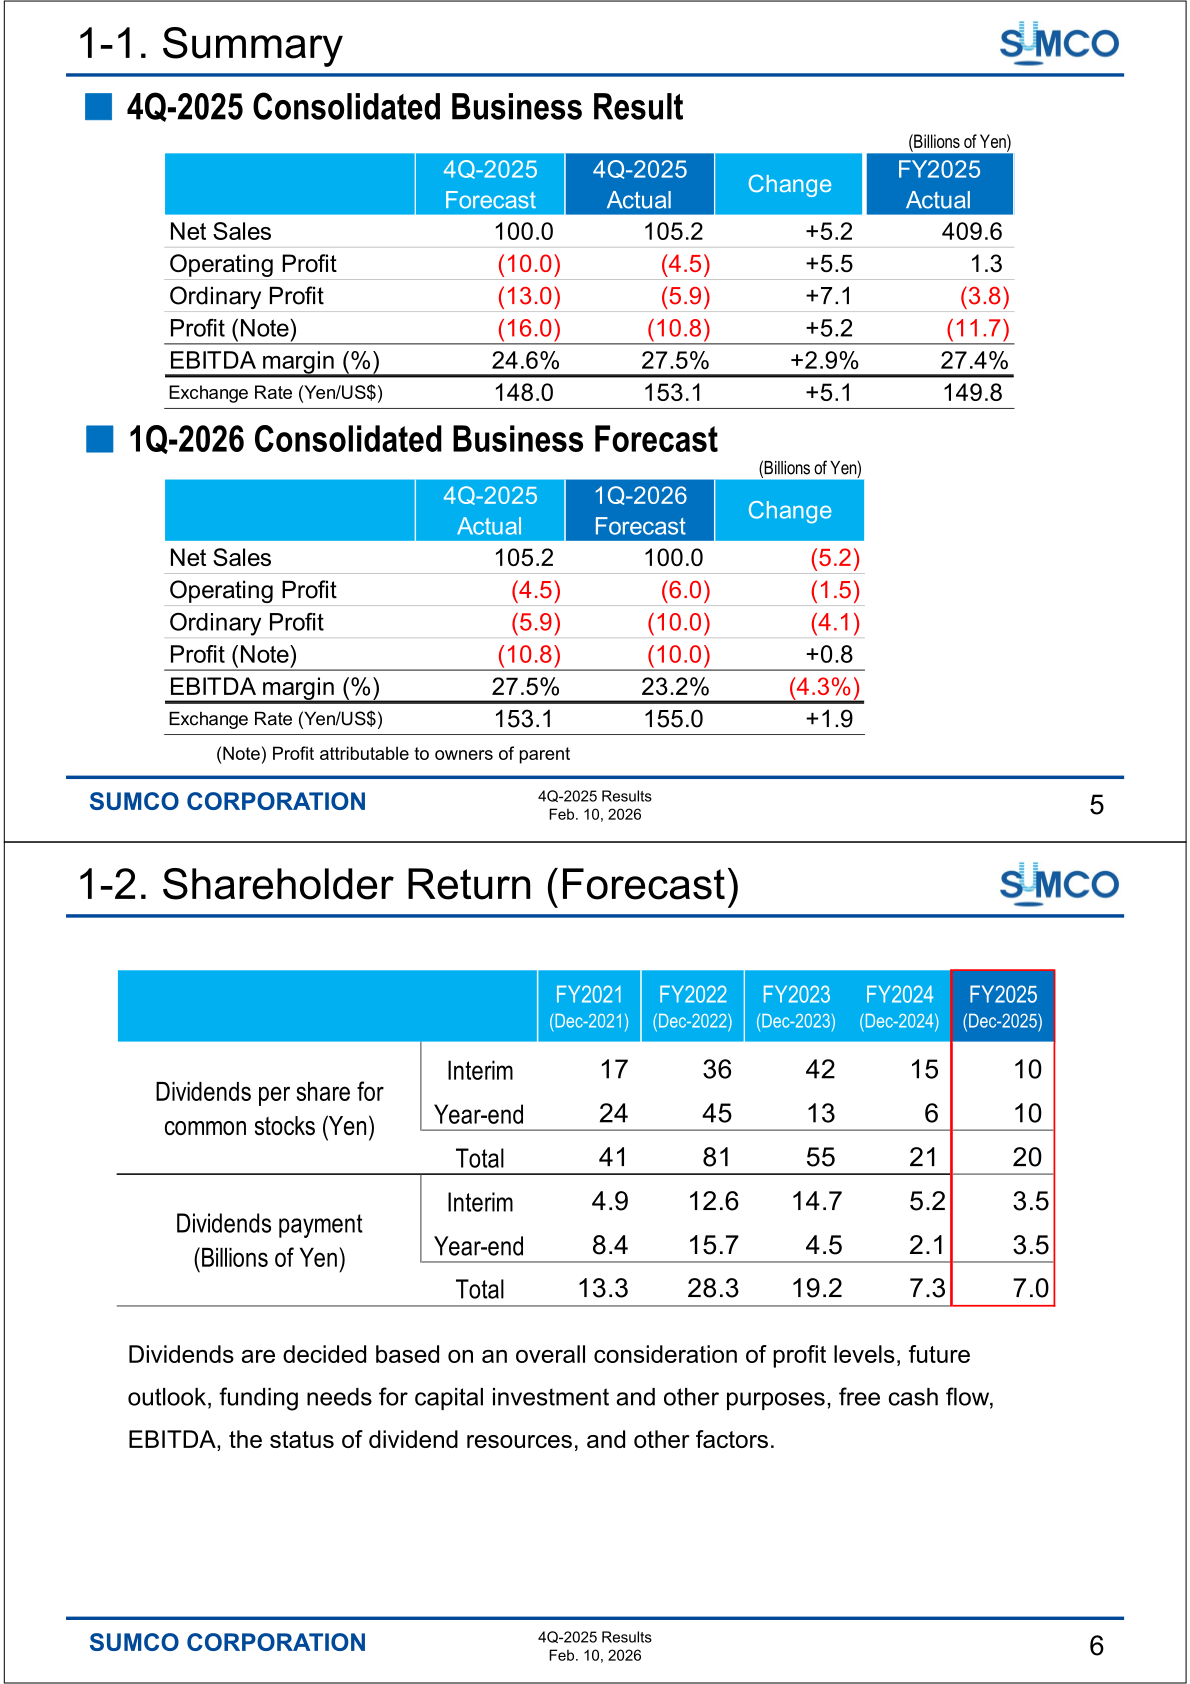
SUMCO Corporation (3436) released its “Results for Fiscal Year 2025 (Ended December 31, 2025)” presentation on February 10, 2026. For FY2025, consolidated net sales rose to 409.6 billion yen from 396.6 billion yen in FY2024 (+13.0 billion yen), while operating profit fell sharply to 1.3 billion yen from 36.9 billion yen. The company posted an ordinary loss of 3.8 billion yen and a loss attributable to owners of parent of 11.7 billion yen, versus a profit of 19.8 billion yen in FY2024. EBITDA was 112.4 billion yen, with an EBITDA margin of 27.4%.
Consolidated Results (Full-Year Actual)
The full-year operating margin declined to 0.3% from 9.3% in FY2024, and ROE was (2.0%) versus 3.4%. Depreciation increased to 115.6 billion yen from 78.9 billion yen (+36.7 billion yen), while capital expenditure (acceptance basis) decreased to 79.9 billion yen from 214.9 billion yen. The average exchange rate was 149.8 yen per US dollar, versus 151.1 yen in FY2024. In the presentation, EBITDA is defined as operating profit plus operating depreciation and amortization of goodwill, and the company notes that if the yen appreciates by 1 yen against the US dollar, its operating profit decreases by 1.2 billion yen per year.
| Item (Billions of Yen) | FY2024 Actual | FY2025 Actual | Change |
|---|---|---|---|
| Net sales | 396.6 | 409.6 | +13.0 |
| Operating profit | 36.9 | 1.3 | (35.6) |
| Ordinary profit | 37.4 | (3.8) | (41.2) |
| Profit attributable to owners of parent | 19.8 | (11.7) | (31.5) |
| EBITDA | 114.0 | 112.4 | (1.6) |
| EBITDA margin (%) | 28.8% | 27.4% | (1.3%) |
| Capital expenditure (acceptance basis) | 214.9 | 79.9 | (135.0) |
| Depreciation | 78.9 | 115.6 | +36.7 |
| Operating margin (%) | 9.3% | 0.3% | (9.0%) |
| ROE (%) | 3.4% | (2.0%) | (5.5%) |
| Basic earnings per share (Yen) | 56.84 | (33.60) | (90.45) |
| Exchange rate (Yen/US$) | 151.1 | 149.8 | (1.3) |
The fourth quarter came in ahead of the company’s own forecast: 4Q-2025 net sales were 105.2 billion yen against a forecast of 100.0 billion yen (+5.2 billion yen), and the operating loss of 4.5 billion yen was smaller than the forecast loss of 10.0 billion yen (+5.5 billion yen). The 4Q ordinary loss was 5.9 billion yen versus a forecast of (13.0), and the 4Q loss attributable to owners of parent was 10.8 billion yen versus a forecast of (16.0). The 4Q-2025 EBITDA margin was 27.5%, against a forecast of 24.6%.
Market Environment
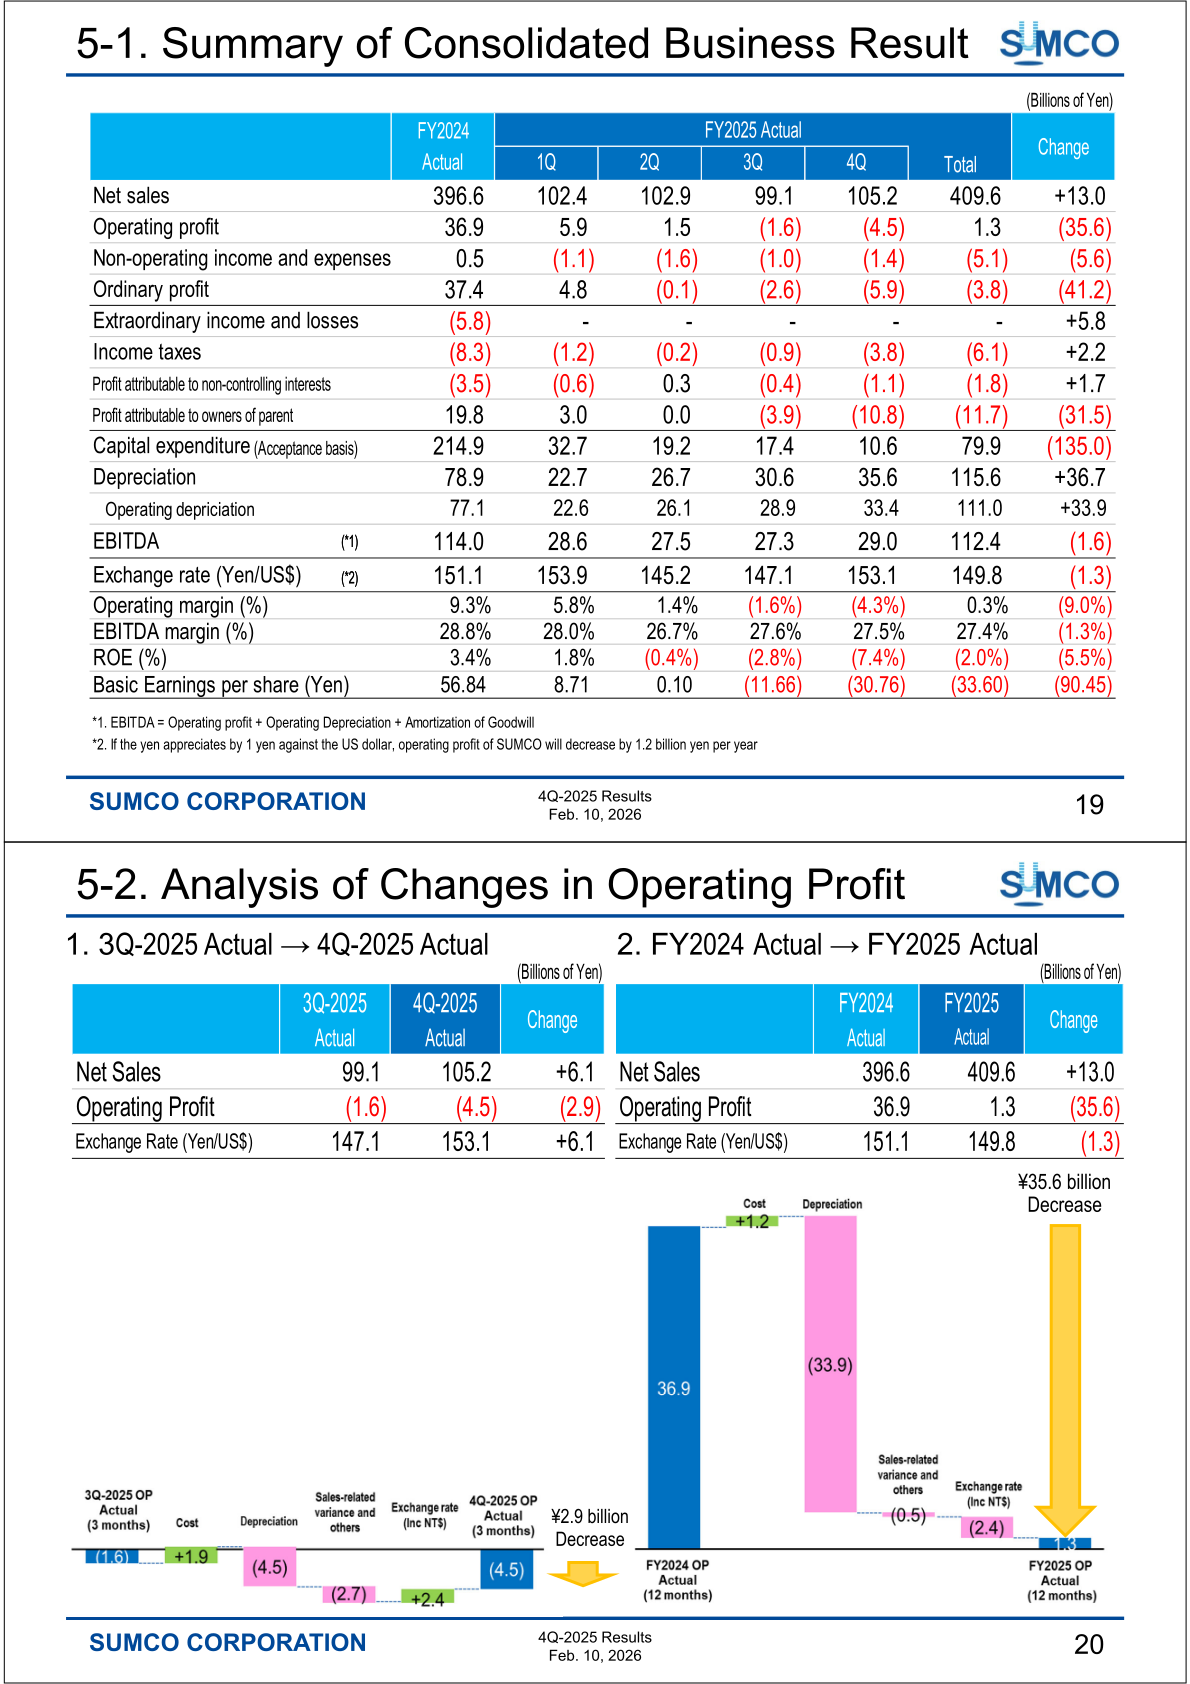
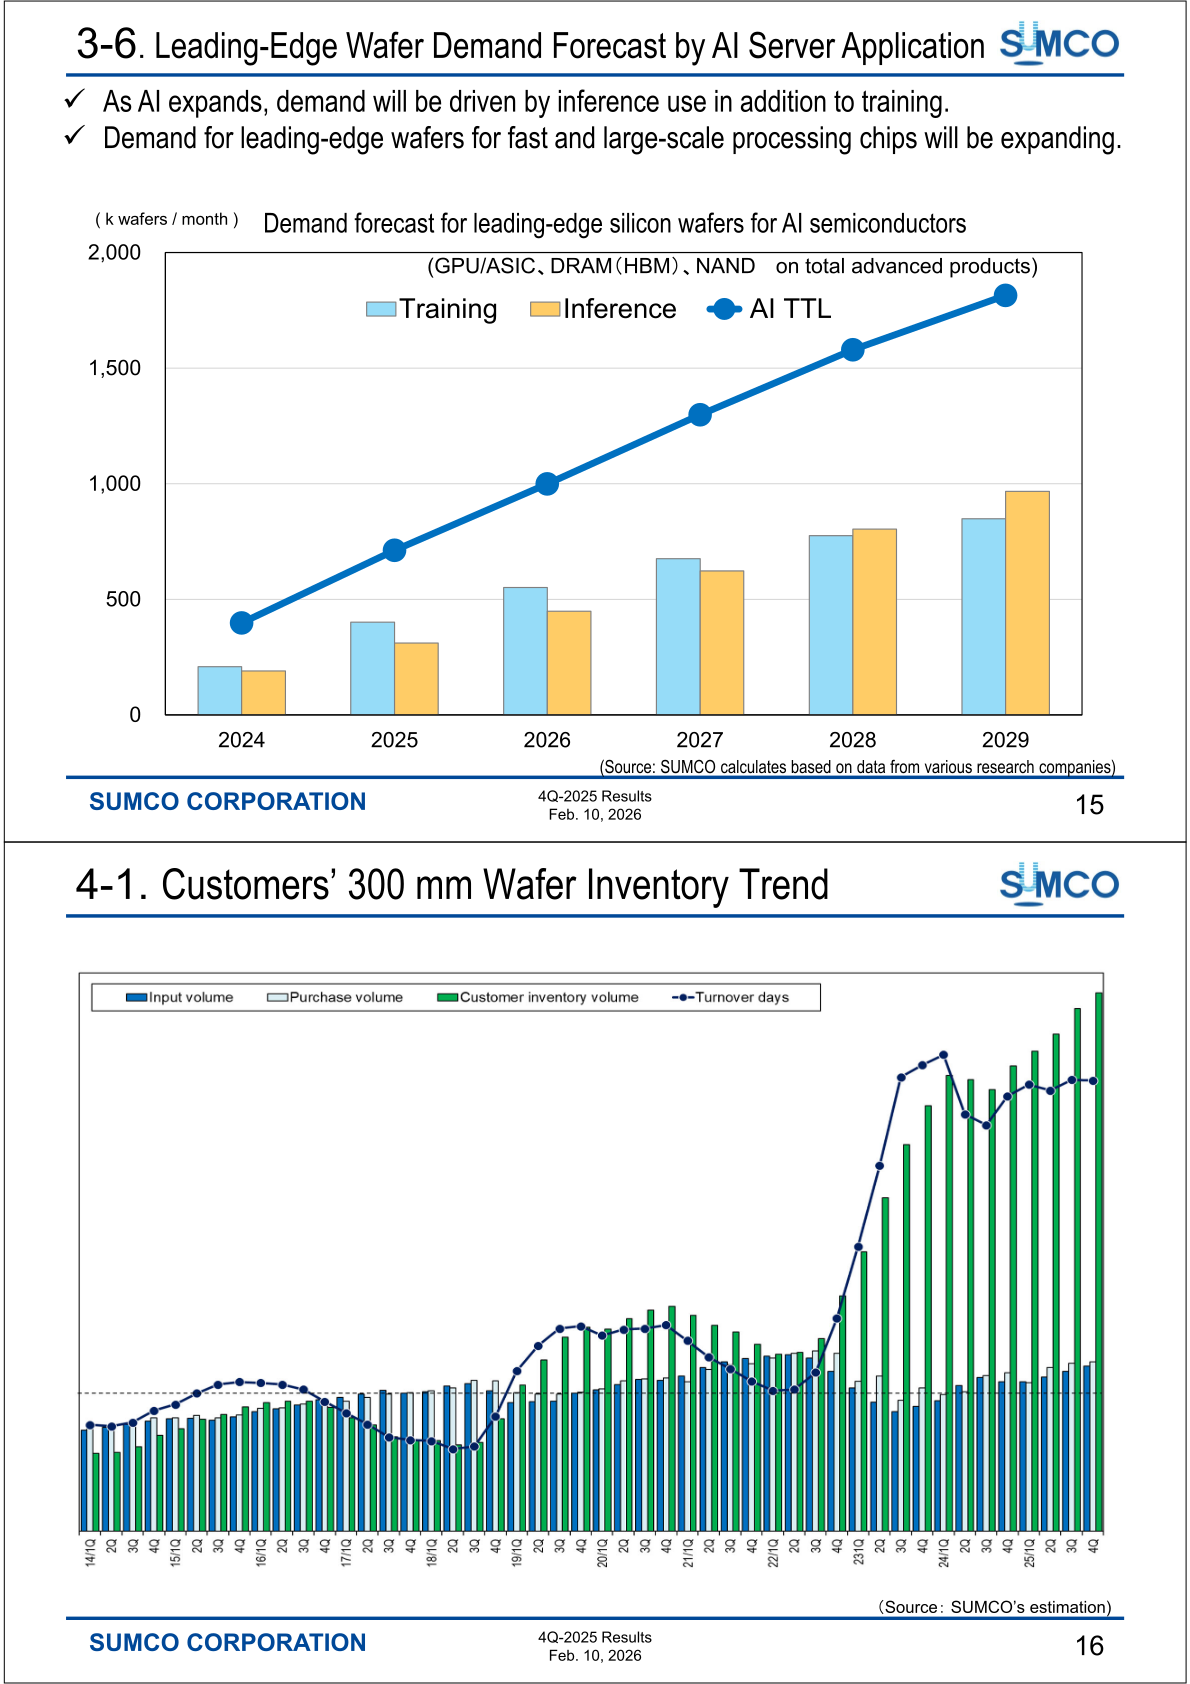
The presentation does not provide a business-segment breakdown; results are presented on a consolidated basis, with commentary on the silicon wafer market. For 4Q-2025, the company states that the recovery trend for 300 mm wafers continued throughout the year, while shipments remained slow for 200 mm wafers, and that long-term contract prices were honored for both 300 mm and 200 mm wafers.
On the outlook, the company expects the semiconductor market to see continued strong growth for AI use and gradual recovery elsewhere. In the silicon wafer market, it expects strong demand for 300 mm products for leading-edge logic and DRAM in AI data centers, with an uptick in demand for NAND projected ahead; for legacy products, it anticipates that customers will conduct full-scale inventory drawdown and adjust purchase volumes. For wafers of 200 mm and smaller, some demand growth is seen in the AI data center field, but the current demand scale is expected to continue due to the shift to 300 mm and geopolitical impacts. The presentation also highlights the expanding AI user base — citing 800 million users of ChatGPT and 650 million Gemini users — and forecasts that wafer demand growth for leading-edge DRAM and NAND will be driven by AI servers for inference use in addition to training.
Balance Sheet and Cash Flow
Total assets stood at 1,127.9 billion yen at the end of December 2025, down 44.7 billion yen from 1,172.6 billion yen a year earlier. Interest-bearing debt was 353.7 billion yen, and the equity-to-asset ratio improved to 51.3% from 50.5%. For FY2025, net cash provided by operating activities was 100.0 billion yen, net cash used in investing activities was (111.4), and free cash flow was (11.4). Dividends paid were (7.5), and cash and cash equivalents decreased by 20.4 billion yen over the year.
| Item (Billions of Yen) | End of Dec-2024 | End of Dec-2025 | Change |
|---|---|---|---|
| Total assets | 1,172.6 | 1,127.9 | (44.7) |
| Interest-bearing debt | 353.9 | 353.7 | (0.2) |
| Total net assets | 657.2 | 647.7 | (9.5) |
| Equity-to-asset ratio (%) | 50.5% | 51.3% | +0.8% |
| Net assets per share (Yen) | 1,693.2 | 1,653.9 | (39.3) |
1Q-2026 Forecast
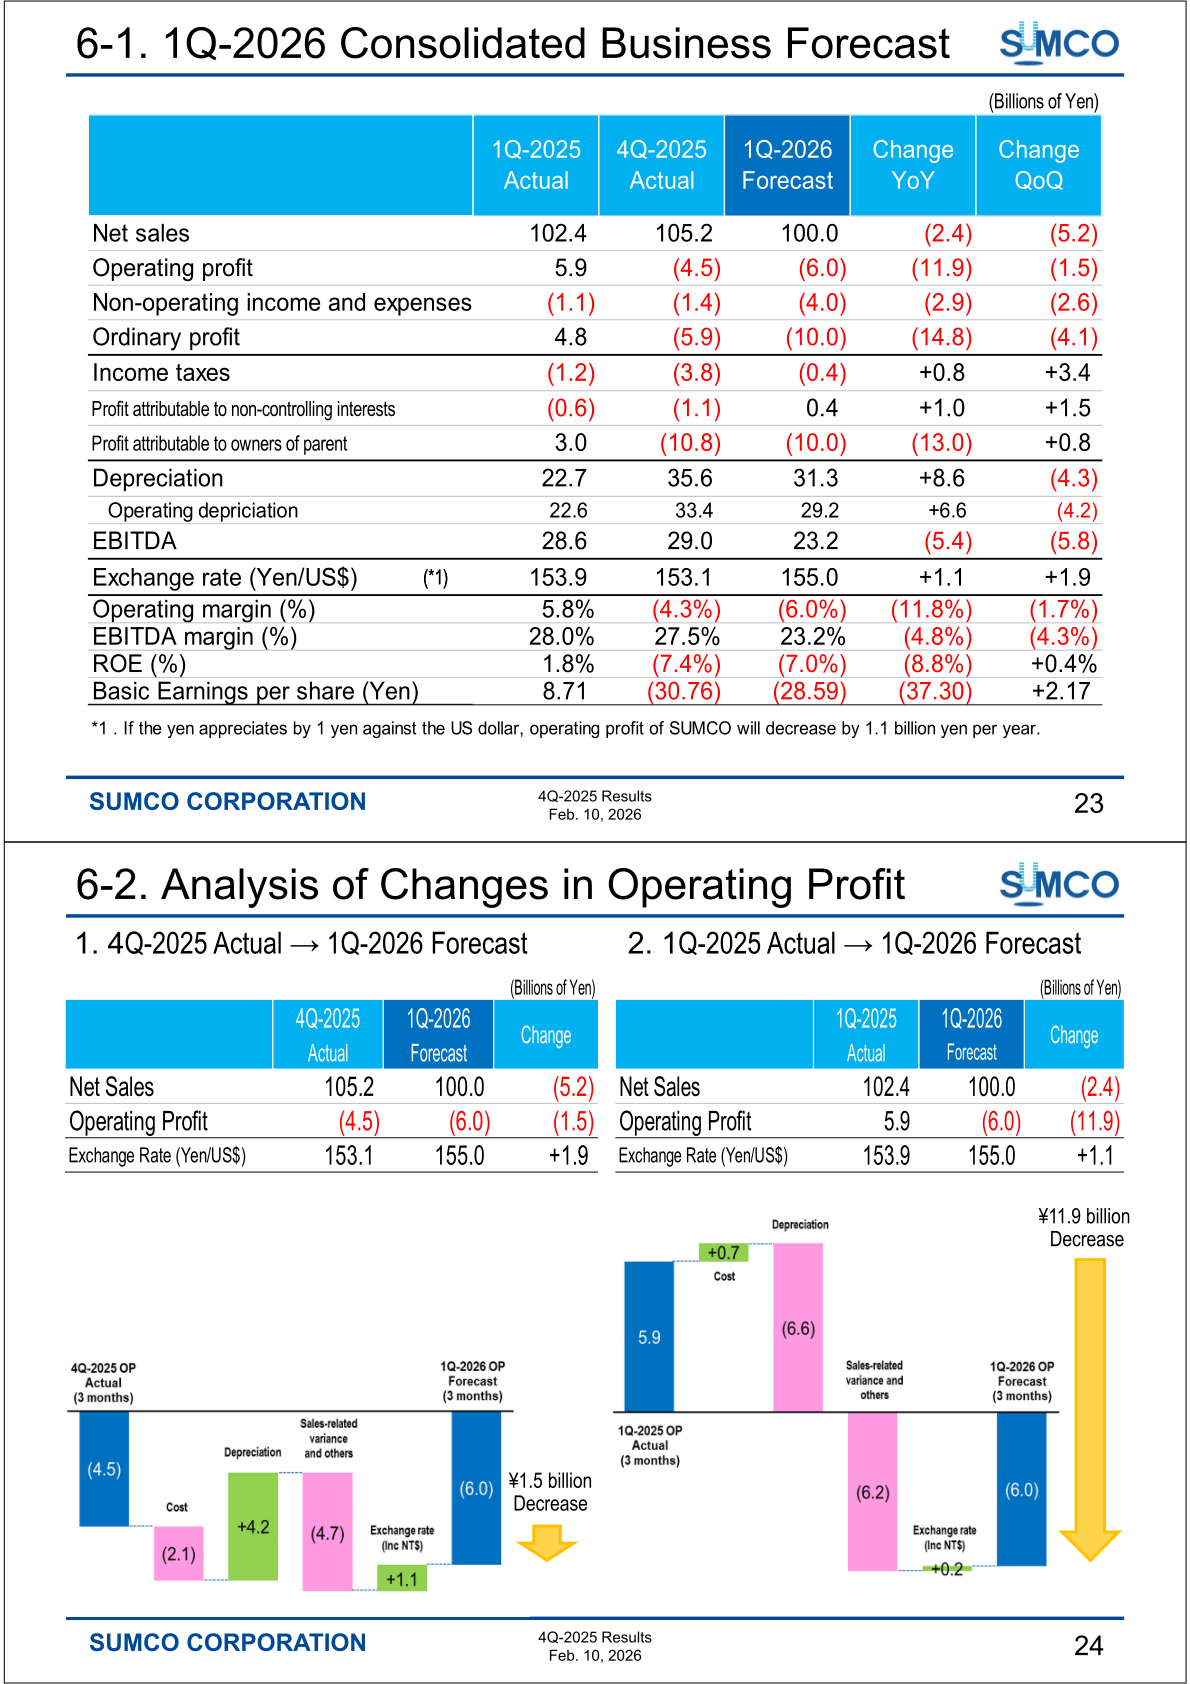
The presentation provides a consolidated business forecast for 1Q-2026 (it does not include a full-year FY2026 forecast). For 1Q-2026, SUMCO forecasts net sales of 100.0 billion yen, an operating loss of 6.0 billion yen, an ordinary loss of 10.0 billion yen, and a loss attributable to owners of parent of 10.0 billion yen, at an assumed exchange rate of 155.0 yen per US dollar. EBITDA is forecast at 23.2 billion yen with an EBITDA margin of 23.2%. For 1Q-2026 volume, the company sees the 300 mm wafer outlook remaining favorable for leading-edge products, driven by AI, with customers moving to speed up inventory drawdown of legacy products, and demand growth related to AI data centers for 200 mm wafers; long-term contract prices are being maintained for both 300 mm and 200 mm wafers.
| Item (Billions of Yen) | 1Q-2025 Actual | 4Q-2025 Actual | 1Q-2026 Forecast |
|---|---|---|---|
| Net sales | 102.4 | 105.2 | 100.0 |
| Operating profit | 5.9 | (4.5) | (6.0) |
| Ordinary profit | 4.8 | (5.9) | (10.0) |
| Profit attributable to owners of parent | 3.0 | (10.8) | (10.0) |
| EBITDA | 28.6 | 29.0 | 23.2 |
| EBITDA margin (%) | 28.0% | 27.5% | 23.2% |
| Basic earnings per share (Yen) | 8.71 | (30.76) | (28.59) |
| Exchange rate (Yen/US$) | 153.9 | 153.1 | 155.0 |
Shareholder Returns
The company states that dividends are decided based on an overall consideration of profit levels, future outlook, funding needs for capital investment and other purposes, free cash flow, EBITDA, the status of dividend resources, and other factors. On the “Shareholder Return (Forecast)” slide, dividends per share for FY2025 are shown as 10 yen interim and 10 yen year-end, for a total of 20 yen (FY2024: 15 yen interim, 6 yen year-end, 21 yen total). Total dividend payments for FY2025 are shown as 7.0 billion yen (3.5 billion yen interim and 3.5 billion yen year-end), versus 7.3 billion yen for FY2024.
| Item | FY2021 | FY2022 | FY2023 | FY2024 | FY2025 |
|---|---|---|---|---|---|
| Dividends per share — interim (Yen) | 17 | 36 | 42 | 15 | 10 |
| Dividends per share — year-end (Yen) | 24 | 45 | 13 | 6 | 10 |
| Dividends per share — total (Yen) | 41 | 81 | 55 | 21 | 20 |
| Dividends payment — total (Billions of Yen) | 13.3 | 28.3 | 19.2 | 7.3 | 7.0 |
This article is an analysis based on publicly available information and is not a recommendation to buy or sell any specific securities. Investment decisions are your own responsibility.
![[Obayashi] Investors’ Guide 2026 — The Complete 24-Article Breakdown](https://japan-equity.com/wp-content/uploads/2026/07/hub_cover-1024x1024.png)
![[Obayashi] IR & SR Policy — Feeding Dialogue Back into Management](https://japan-equity.com/wp-content/uploads/2026/07/p32_sq-1024x1024.jpg)
![[Obayashi] Real Estate Development — 18.7% Margin, ¥287.7bn Unrealized Gains](https://japan-equity.com/wp-content/uploads/2026/07/p20_sq-1024x1024.jpg)
![[Obayashi] Domestic Civil Engineering — Resilience Spending Supports 9.6% Margin](https://japan-equity.com/wp-content/uploads/2026/07/p11_sq-1024x1024.jpg)
![[Obayashi] Share Price & External Ratings — vs TOPIX, ESG Index Inclusion](https://japan-equity.com/wp-content/uploads/2026/07/p40_sq-1024x1024.jpg)
![[Construction] ¥75.5tn Investment, Shrinking Workforce — Big-5 Market Share](https://japan-equity.com/wp-content/uploads/2026/07/p12_sq-1024x1024.jpg)



![[Obayashi] Capital Policy & Shareholder Returns — ROE 10%+, DOE ~5%, ¥100bn Buyback](https://japan-equity.com/wp-content/uploads/2026/07/p27_sq-1024x1024.jpg)
![[Obayashi] Reducing Cross-Shareholdings — ¥285.2bn Sold in Five Years](https://japan-equity.com/wp-content/uploads/2026/07/p29_sq-1024x1024.jpg)
![[Obayashi] ¥750bn Investment Plan — ¥300bn to Development, ¥190bn to Tech/DX](https://japan-equity.com/wp-content/uploads/2026/07/p30_sq-1024x1024.jpg)
![[Obayashi] MTP2022 KPIs — Operating Profit ~2x Target, ROE 14.4%](https://japan-equity.com/wp-content/uploads/2026/07/p25_sq-1024x1024.jpg)
![[Obayashi] Cash Allocation — ¥420bn Investment CF Over Five Years](https://japan-equity.com/wp-content/uploads/2026/07/p26_sq-1024x1024.jpg)
![[Obayashi] Green Energy — 44 Plants, 344MW, and the Green Hydrogen Challenge](https://japan-equity.com/wp-content/uploads/2026/07/p21_sq-1024x1024.jpg)
![[Obayashi] Tackling the Labor Shortage — Robotics Construction®](https://japan-equity.com/wp-content/uploads/2026/07/p14_sq-1024x1024.jpg)
