
This article is based on publicly available IR materials and is not a recommendation to buy or sell any specific securities.
Note: Hoosiers Holdings labels the fiscal year covered here as “FY3/26” (the fiscal year ended March 31, 2026); on this site the most recently completed fiscal year is classified as FY2025, and the labels used in the text, tables and segment data below follow the company’s own materials.
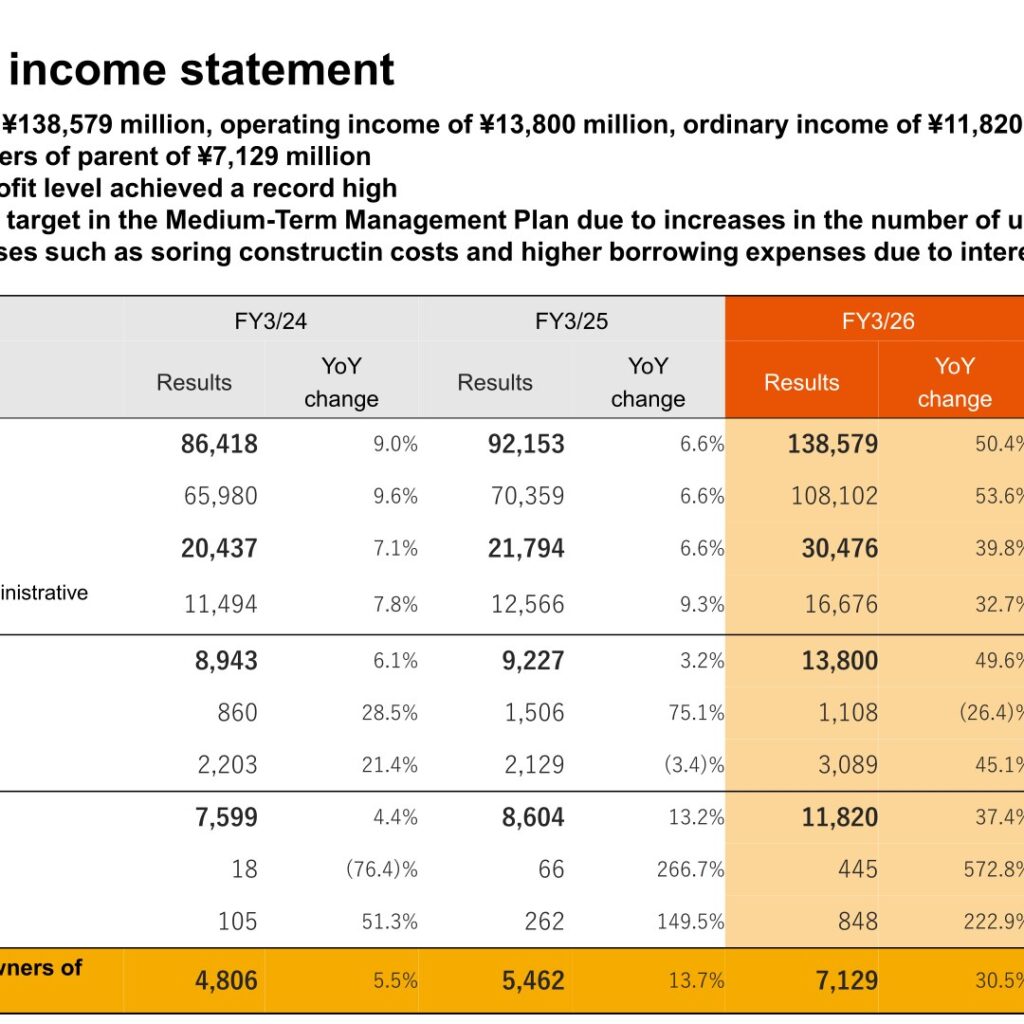
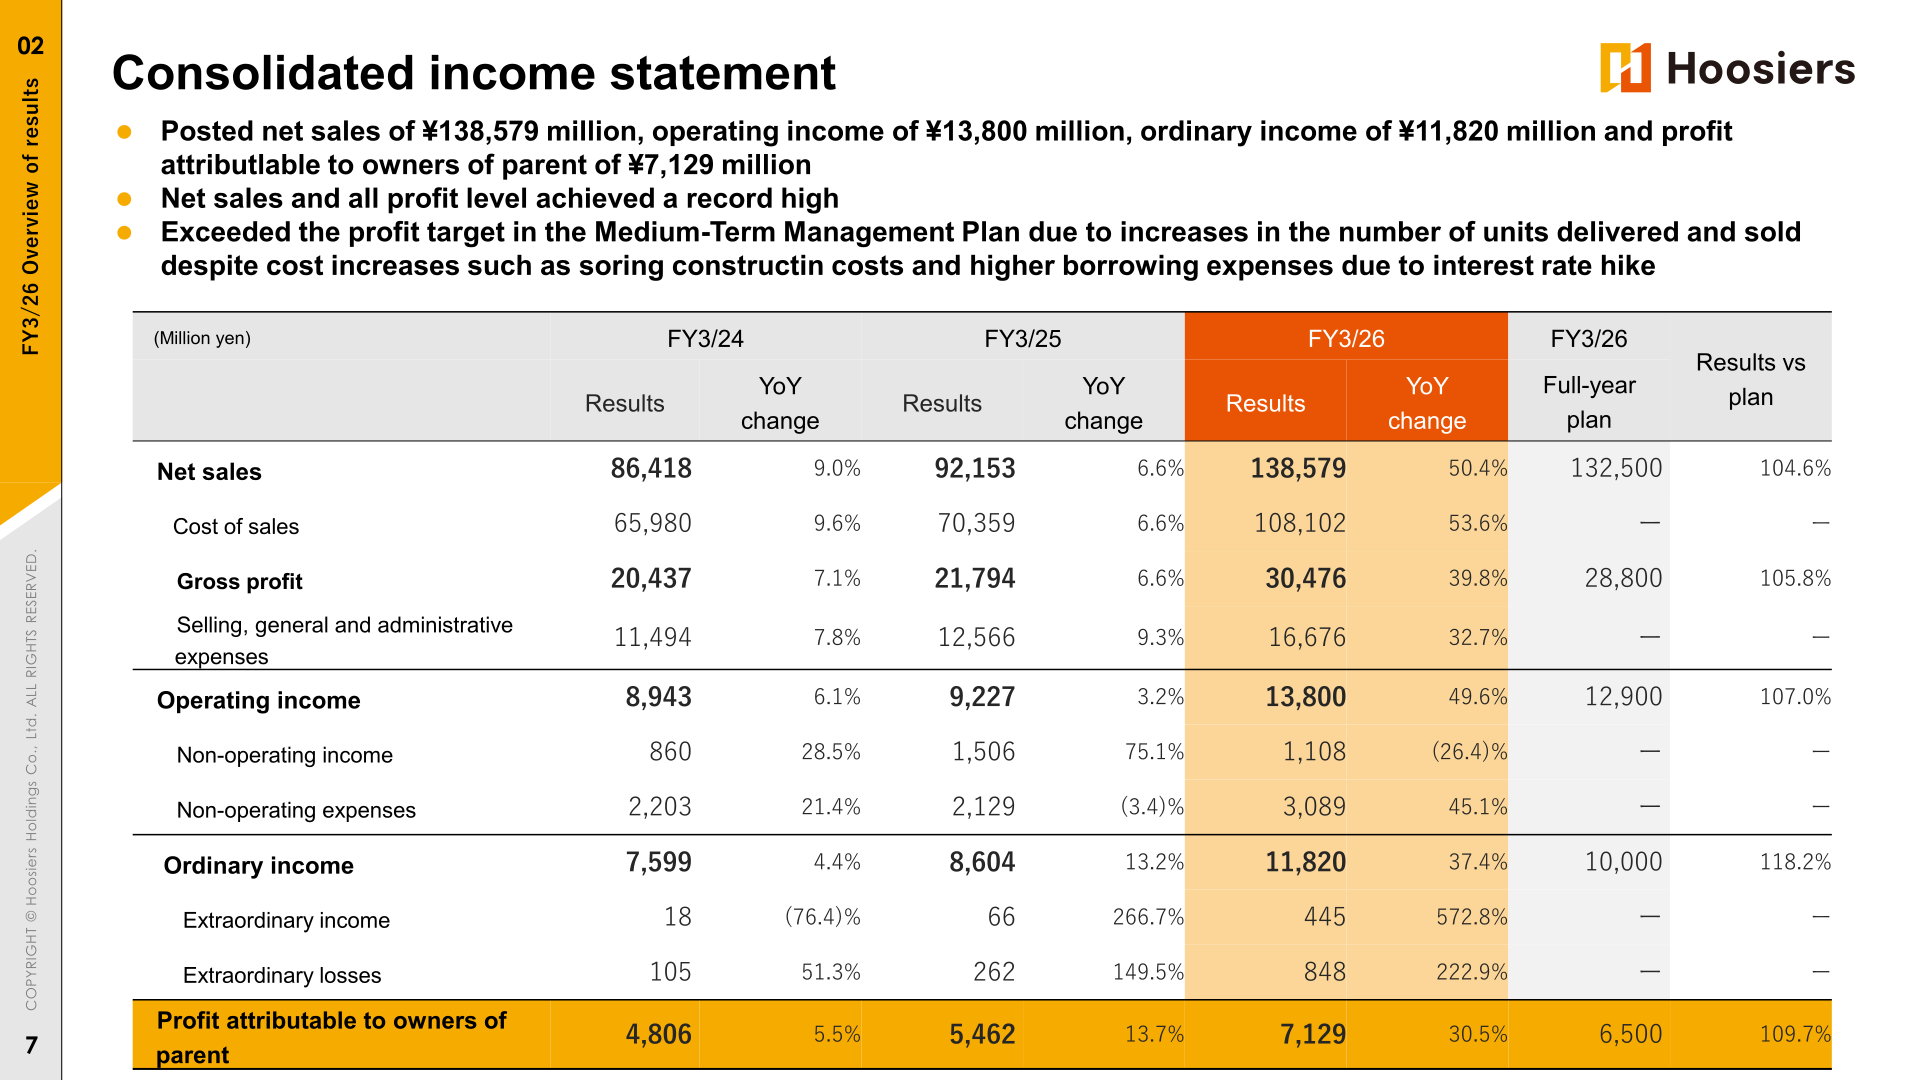
Hoosiers Holdings Co., Ltd. posted net sales of ¥138,579 million (up 50.4% YoY), operating income of ¥13,800 million (up 49.6%), ordinary income of ¥11,820 million (up 37.4%) and profit attributable to owners of parent of ¥7,129 million (up 30.5%) for FY3/26. According to the company, net sales and all profit levels achieved a record high, and every profit line exceeded the full-year plan. The annual dividend was raised to ¥74 per share (up ¥12 YoY), and for FY3/27 the company forecasts lower net sales but higher profit, with a dividend of ¥75 per share.
Consolidated Results (Full-Year Actual)
The company states that it exceeded the profit target in the Medium-Term Management Plan due to increases in the number of units delivered and sold, despite cost increases such as soaring construction costs and higher borrowing expenses due to interest rate hikes. Gross profit rose 39.8% to ¥30,476 million, while selling, general and administrative expenses increased 32.7% to ¥16,676 million. Non-operating expenses rose 45.1% to ¥3,089 million. Against the full-year plan, ordinary income reached 118.2% and profit attributable to owners of parent 109.7%.
| Item (Million yen) | FY3/26 Results | FY3/25 Results | YoY change | FY3/26 Full-year plan | Results vs plan |
|---|---|---|---|---|---|
| Net sales | 138,579 | 92,153 | 50.4% | 132,500 | 104.6% |
| Gross profit | 30,476 | 21,794 | 39.8% | 28,800 | 105.8% |
| Selling, general and administrative expenses | 16,676 | 12,566 | 32.7% | ー | ー |
| Operating income | 13,800 | 9,227 | 49.6% | 12,900 | 107.0% |
| Ordinary income | 11,820 | 8,604 | 37.4% | 10,000 | 118.2% |
| Profit attributable to owners of parent | 7,129 | 5,462 | 30.5% | 6,500 | 109.7% |
On the balance sheet, total assets stood at ¥189,192 million and net assets at ¥55,321 million as of March 31, 2026; net assets increased due to a capital increase in September 2025. Total interest-bearing debt was ¥106,104 million. The equity ratio was 28.0% and the D/E ratio 1.9 times, which the company describes as appropriate levels. ROE was 15.0%. Operating cash flow was ¥10,628 million, compared with ¥(14,122) million in FY3/25. Completion of condominiums was concentrated in 4Q, and real estate for sale increased to ¥41,008 million; the finished inventory of property for sale was 479 units as of March 31, 2026.
Segment Results
Real Estate Development delivered 1,263 condominium units (+201 units YoY) in line with the initial plan, lifting net sales 18.4% to ¥63,644 million. Its gross profit margin was 18.9%, slightly below the plan but, according to the company, within expectations; with a higher number of completed units, it promoted sales and delivery within a range that does not impact consolidated profits from a balance-sheet control perspective. Segment operating income fell 44.4% to ¥2,695 million.
CCRC (condominiums for seniors) delivered 250 units and posted net sales of ¥14,268 million, in line with the initial plan, as 3 buildings were completed. The number of units under management increased to 2,631 units (up 428 units YoY). The company prioritized unit progress for certain condominiums expected to have a prolonged sales period, resulting in a gross profit margin of 19.5%.
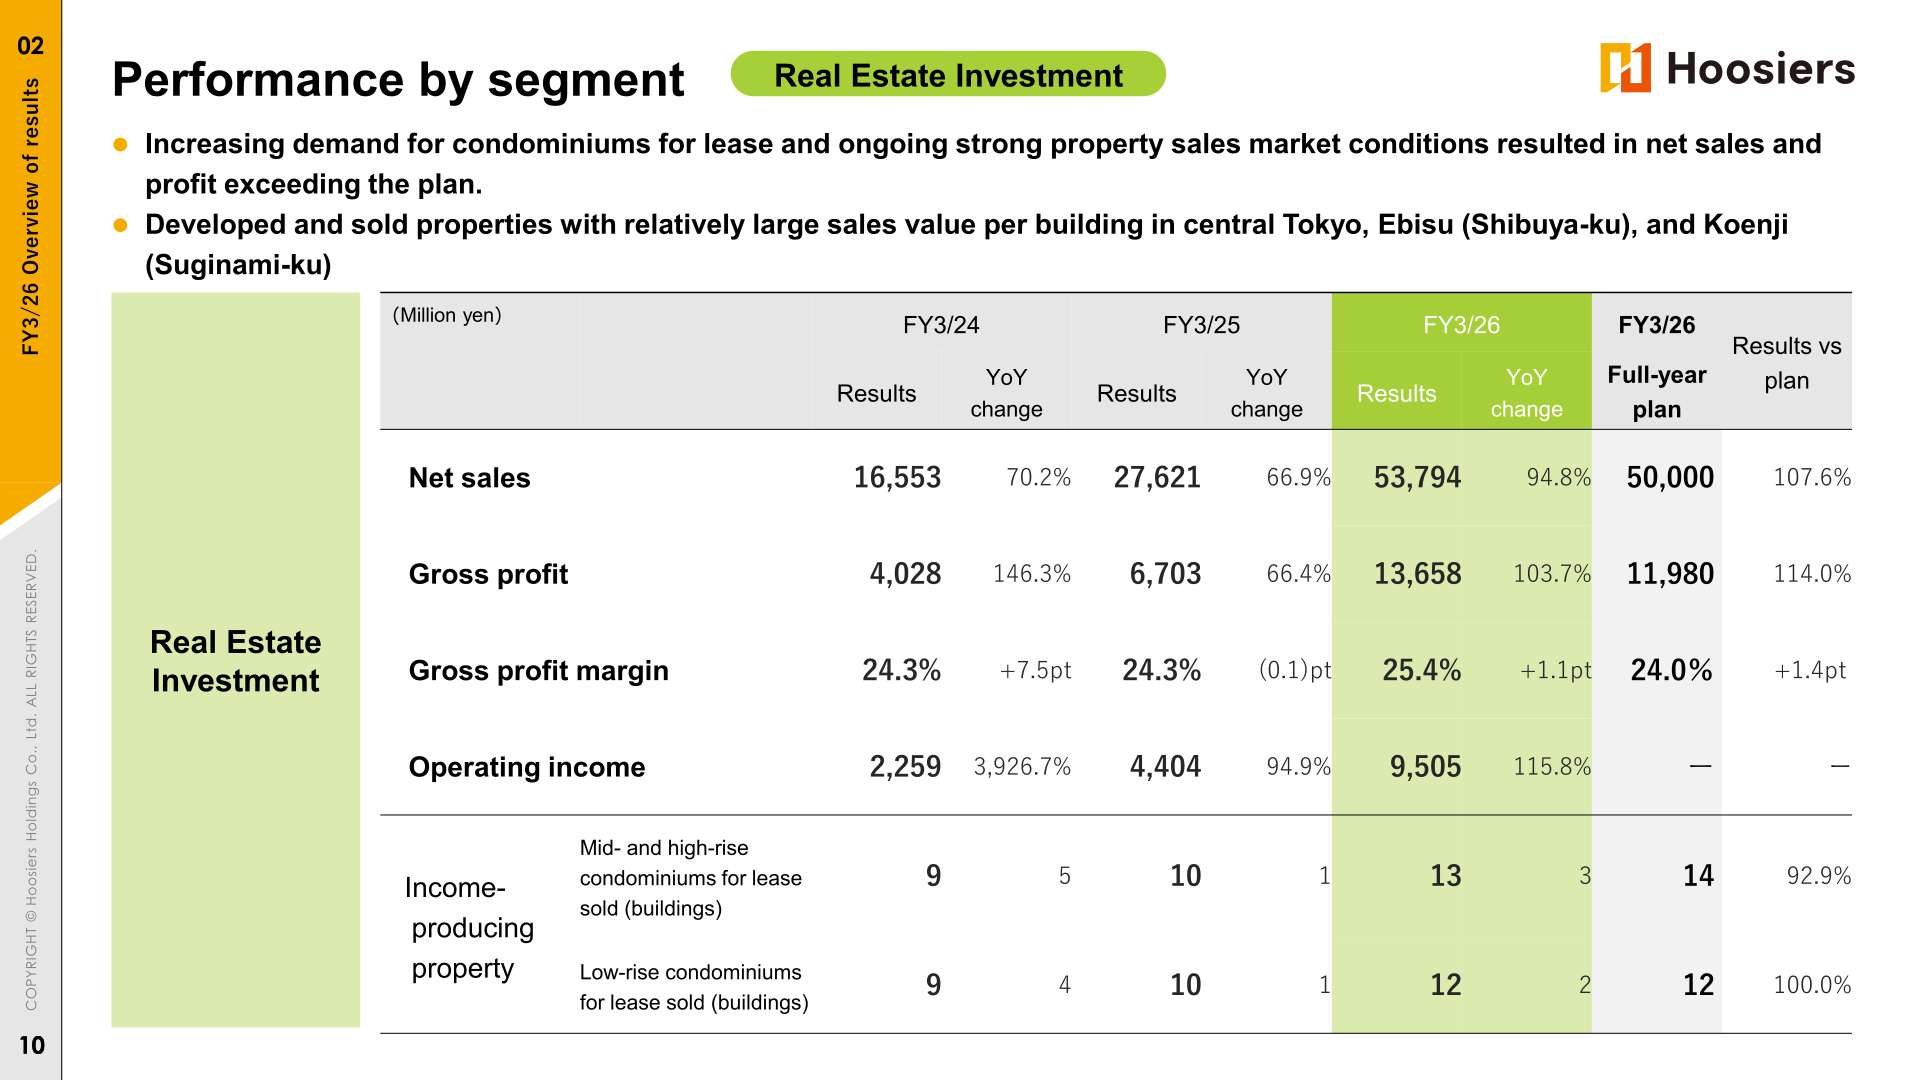
Real Estate Investment was the largest contributor to profit growth. Increasing demand for condominiums for lease and strong property sales market conditions pushed net sales up 94.8% to ¥53,794 million and gross profit up 103.7% to ¥13,658 million, both exceeding the plan. The company sold 13 mid- and high-rise and 12 low-rise condominiums for lease, including properties with relatively large sales value per building in central Tokyo, Ebisu (Shibuya-ku) and Koenji (Suginami-ku). Condominium Management and Related Services increased the number of condominium units under management to 21,860 units, with net sales of ¥8,478 million and operating income of ¥541 million (up 34.1%).
| Segment | Metric | FY3/26 | FY3/25 | YoY change |
|---|---|---|---|---|
| Real Estate Development | Net sales (Million yen) | 63,644 | 53,767 | 18.4% |
| Real Estate Development | Gross profit margin | 18.9% | 23.2% | (4.4)pt |
| Real Estate Development | Operating income (Million yen) | 2,695 | 4,849 | (44.4)% |
| CCRC | Net sales (Million yen) | 14,268 | 3,726 | 282.9% |
| CCRC | Operating income (Million yen) | 706 | (355) | ー |
| Real Estate Investment | Net sales (Million yen) | 53,794 | 27,621 | 94.8% |
| Real Estate Investment | Gross profit margin | 25.4% | 24.3% | +1.1pt |
| Real Estate Investment | Operating income (Million yen) | 9,505 | 4,404 | 115.8% |
| Condominium Management and Related Services | Net sales (Million yen) | 8,478 | 8,465 | 0.2% |
| Condominium Management and Related Services | Operating income (Million yen) | 541 | 403 | 34.1% |
On procurement, the company secured new development sites for condominiums and income-producing properties worth approx. ¥100.0 billion on a total investment (decision-making) basis in FY3/26, and has secured development sites for approx. ¥470.0 billion on an estimated sales basis for properties to be sold after FY3/27 (for about three years).
FY3/27 Forecast
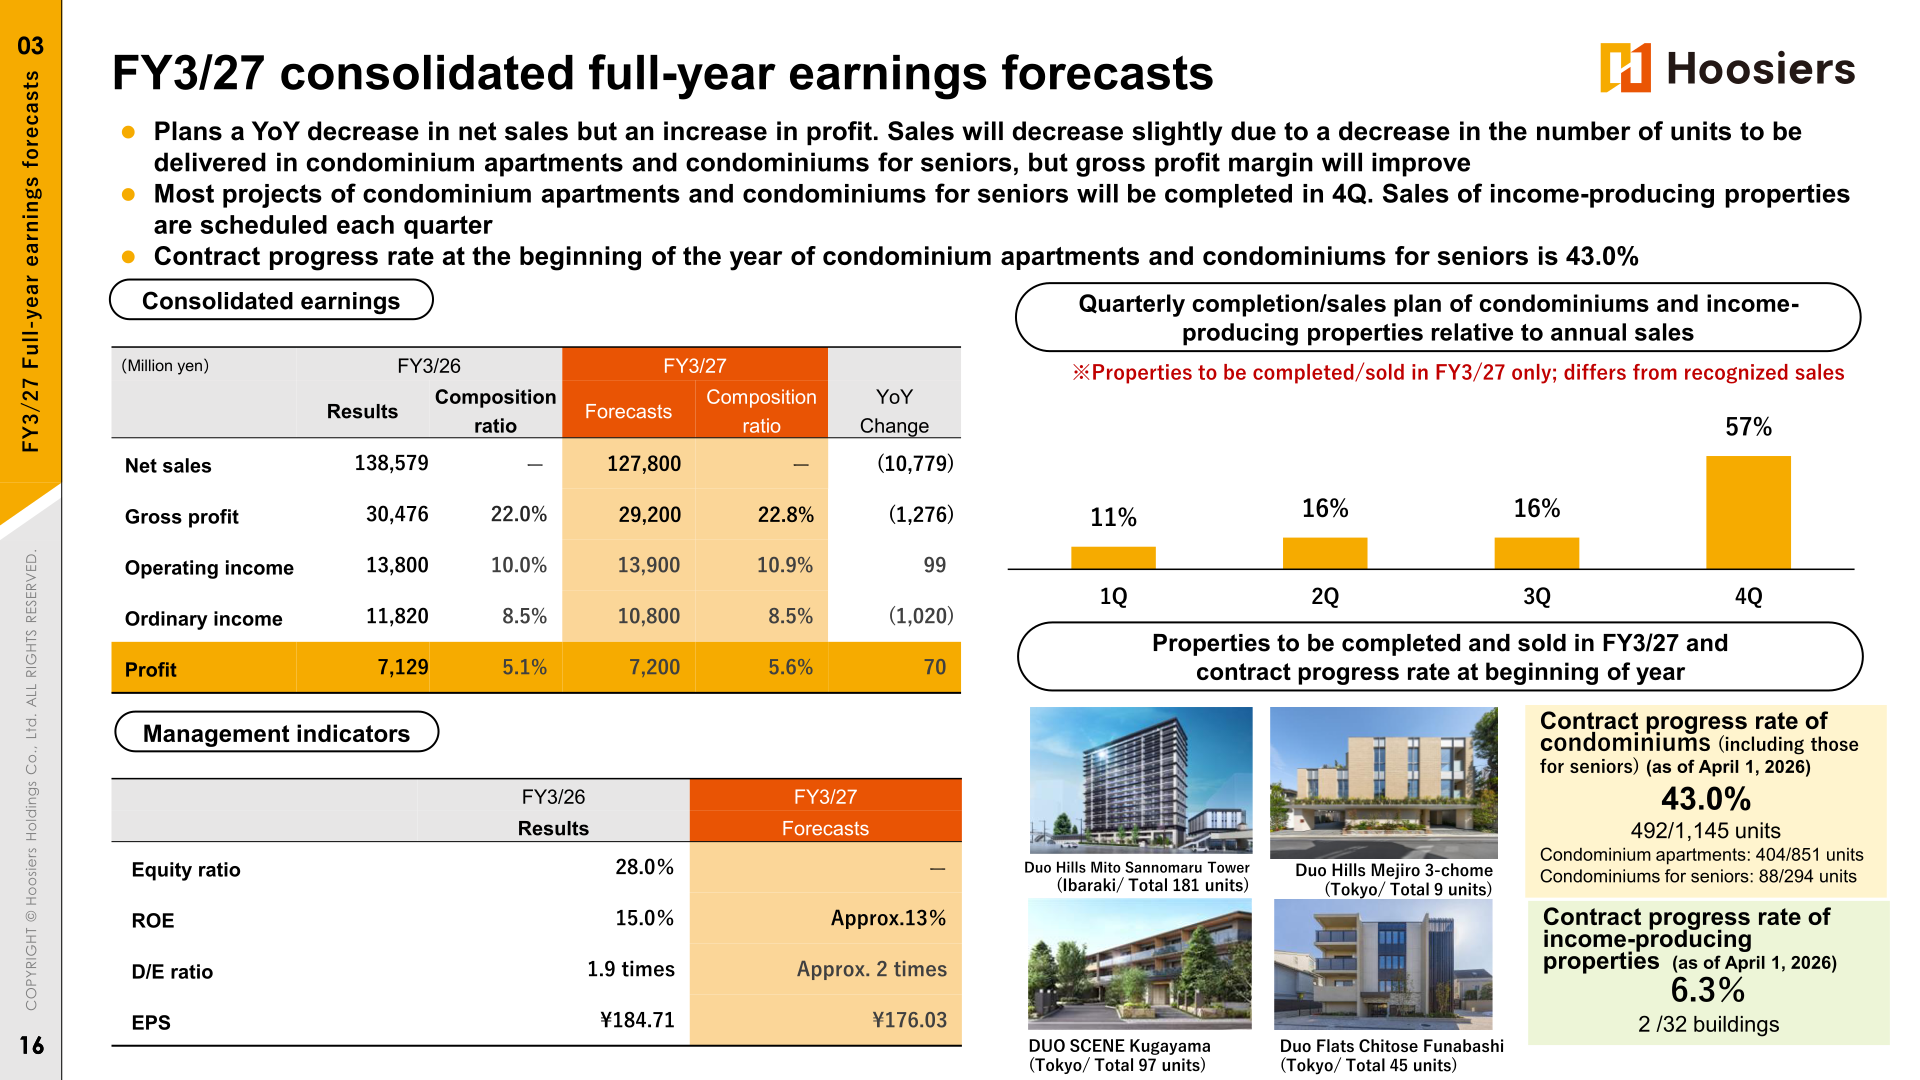
For FY3/27, the company plans a YoY decrease in net sales but an increase in profit. Sales will decrease slightly due to a decrease in the number of units to be delivered in condominium apartments and condominiums for seniors, but the gross profit margin is expected to improve. Most condominium projects will be completed in 4Q, while sales of income-producing properties are scheduled each quarter. The contract progress rate at the beginning of the year for condominium apartments and condominiums for seniors was 43.0% (492/1,145 units). Consolidated SG&A expenses are expected to decrease by ¥1,376 million due to lower selling expenses, while non-operating expenses are expected to increase due to higher borrowing costs.
| Item (Million yen) | FY3/27 Forecasts | FY3/26 Results | YoY change |
|---|---|---|---|
| Net sales | 127,800 | 138,579 | (10,779) |
| Gross profit | 29,200 | 30,476 | (1,276) |
| Operating income | 13,900 | 13,800 | 99 |
| Ordinary income | 10,800 | 11,820 | (1,020) |
| Profit | 7,200 | 7,129 | 70 |
| ROE | Approx.13% | 15.0% | ー |
| D/E ratio | Approx. 2 times | 1.9 times | ー |
| EPS | ¥176.03 | ¥184.71 | ー |
From FY3/27 the company is changing its reportable segments to enhance business portfolio management: the CCRC development function moves into Real Estate Development and the operation function into Condominium Management and Related Services, while overseas real estate development moves from Real Estate Investment to Real Estate Development. Under the former segments, the FY3/27 plan calls for Real Estate Development net sales of ¥49,500 million (gross profit margin 21.4%), CCRC ¥18,850 million (22.8%), Real Estate Investment ¥52,100 million (23.6%) and Condominium Management and Related Services ¥8,250 million (25.5%). Under the new segments, the plan is Real Estate Development ¥68,000 million, Real Estate Investment ¥50,500 million and Condominium Management and Related Services ¥10,200 million.
Shareholder Returns
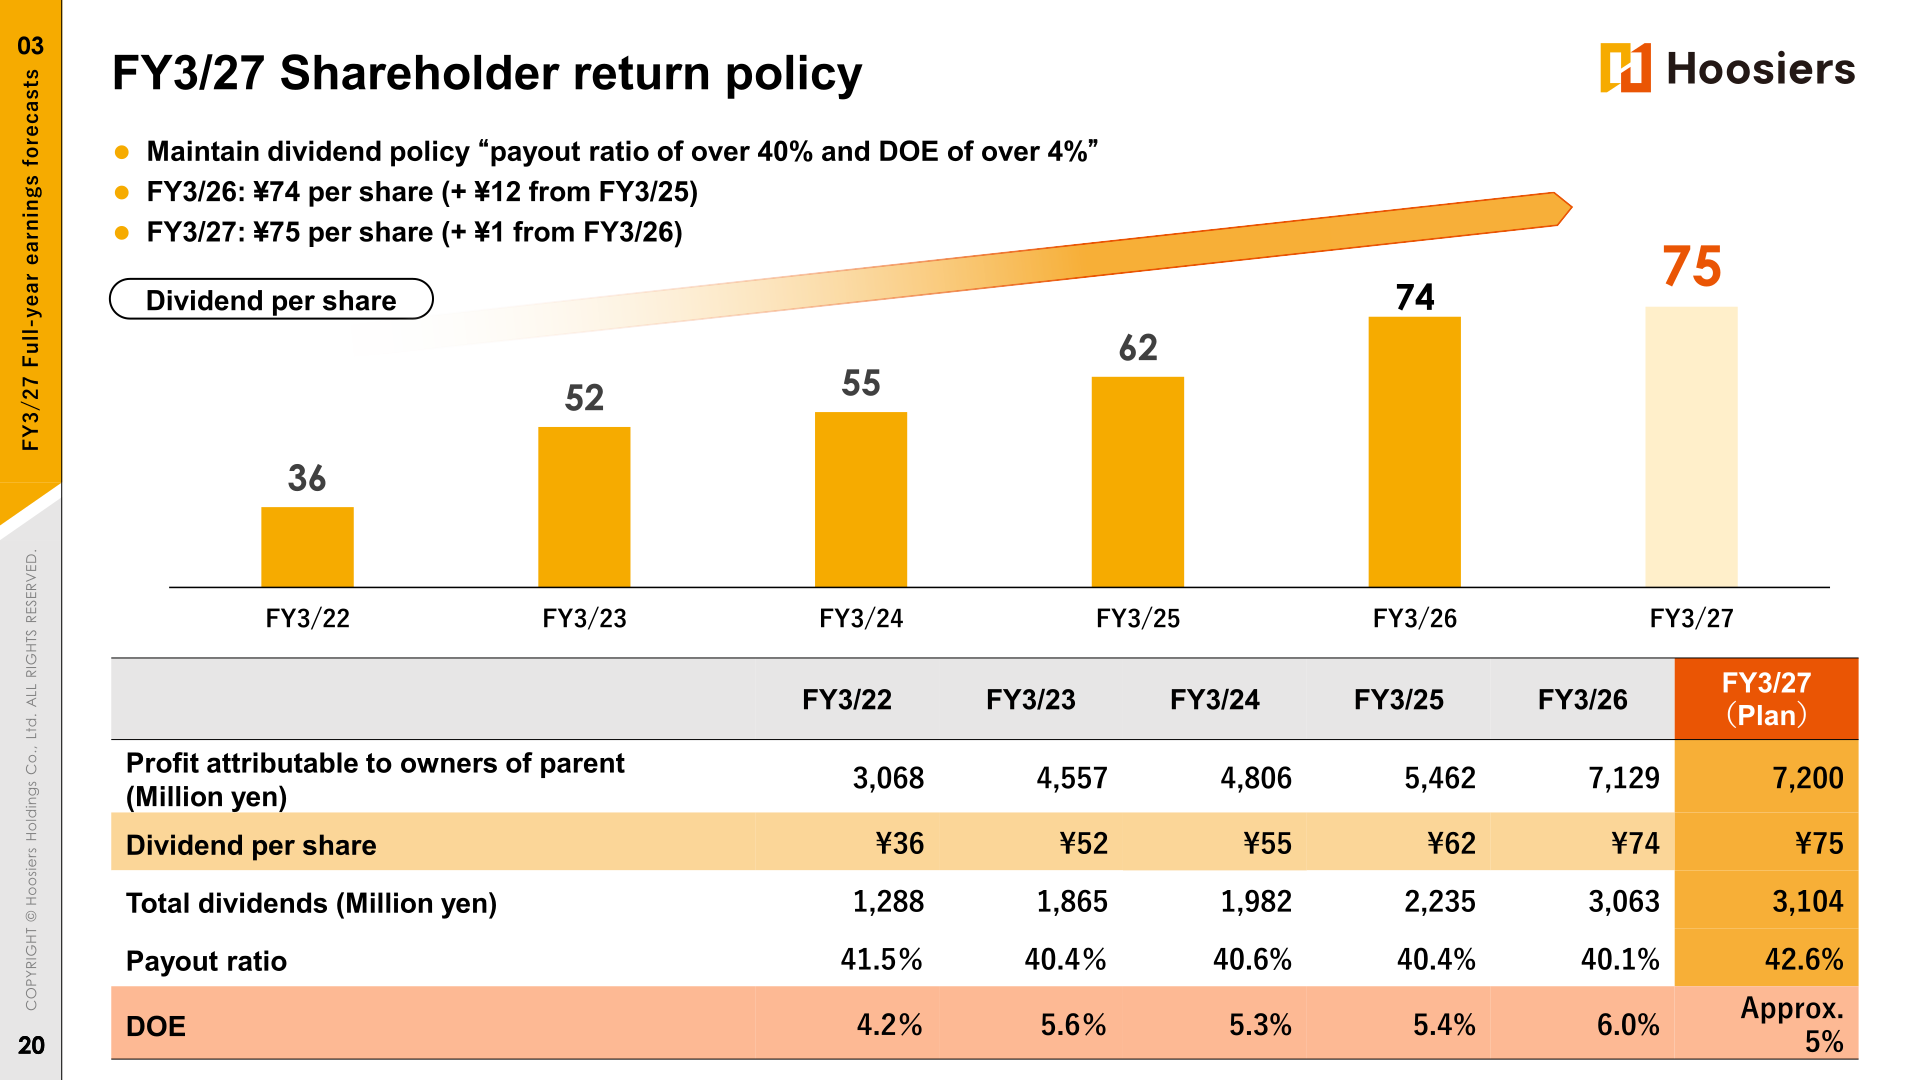
The company maintains its dividend policy of a “payout ratio of over 40% and DOE of over 4%”. The FY3/26 dividend was ¥74 per share (+¥12 from FY3/25), representing a payout ratio of 40.1% and DOE of 6.0%. For FY3/27 the company plans ¥75 per share (+¥1 from FY3/26), with a payout ratio of 42.6% and DOE of approx. 5%.
| Item | FY3/24 | FY3/25 | FY3/26 | FY3/27 (Plan) |
|---|---|---|---|---|
| Profit attributable to owners of parent (Million yen) | 4,806 | 5,462 | 7,129 | 7,200 |
| Dividend per share | ¥55 | ¥62 | ¥74 | ¥75 |
| Total dividends (Million yen) | 1,982 | 2,235 | 3,063 | 3,104 |
| Payout ratio | 40.6% | 40.4% | 40.1% | 42.6% |
| DOE | 5.3% | 5.4% | 6.0% | Approx. 5% |
Medium-Term Management Plan
Reporting on progress of the Second Medium-Term Management Plan (FY3/22 to FY3/26), the company achieved 109% (ordinary income) and 104% (profit attributable to owners of parent) of the 5-year cumulative profit plan, and states that it maintained a balance between business growth and financial soundness through effective control of ROE and the D/E ratio.
This article is an analysis based on publicly available information and is not a recommendation to buy or sell any specific securities. Investment decisions are your own responsibility.
















