
This article is based on publicly available IR materials and is not a recommendation to buy or sell any specific securities.
Note: United Super Markets Holdings does not publish an English results presentation; this article is an English translation of the Japanese-language article on our sister site Investalk, which is based on the company’s Japanese-language IR materials, with figures transcribed as reported. The company’s materials label this period as the fiscal year ended February 2026 (the 11th fiscal term); in line with this site’s convention, the latest completed full year is classified as FY2025, while tables and text retain the fiscal-period labels used in the materials.
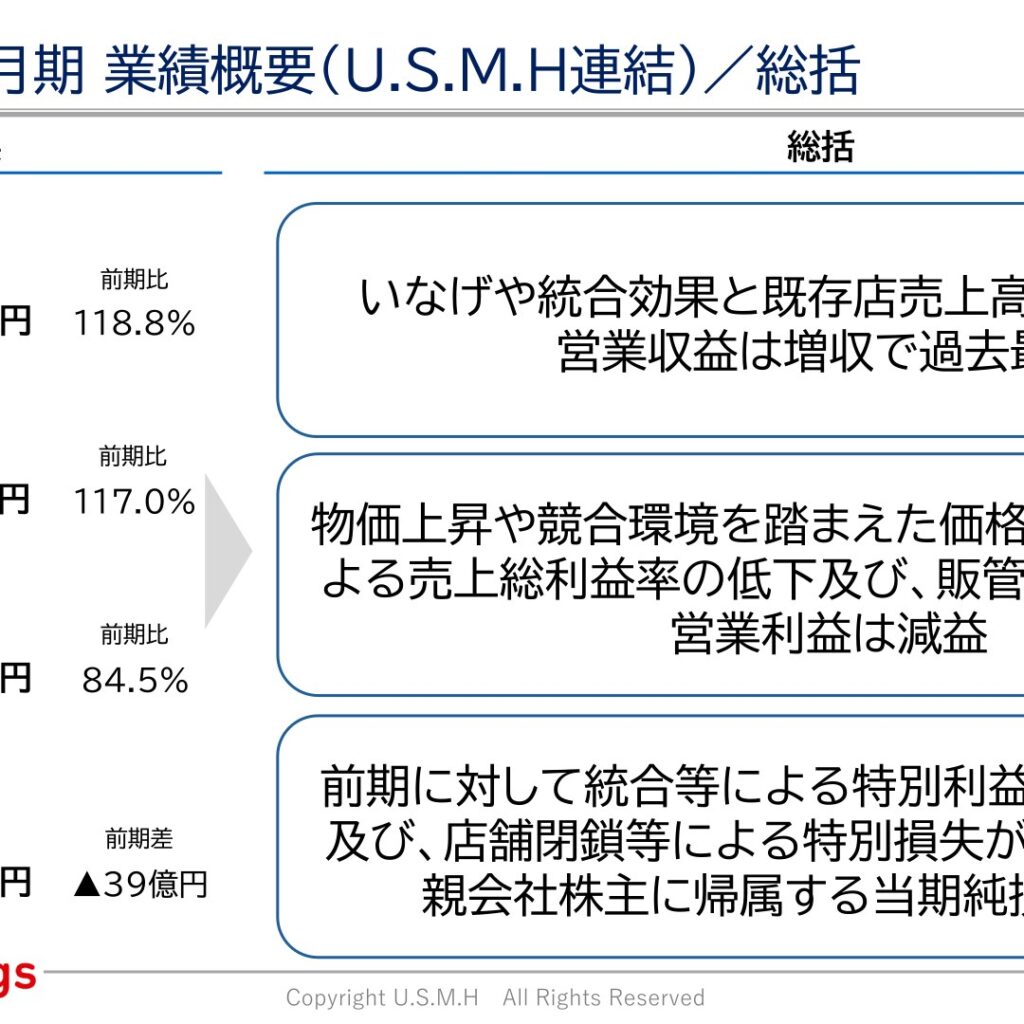
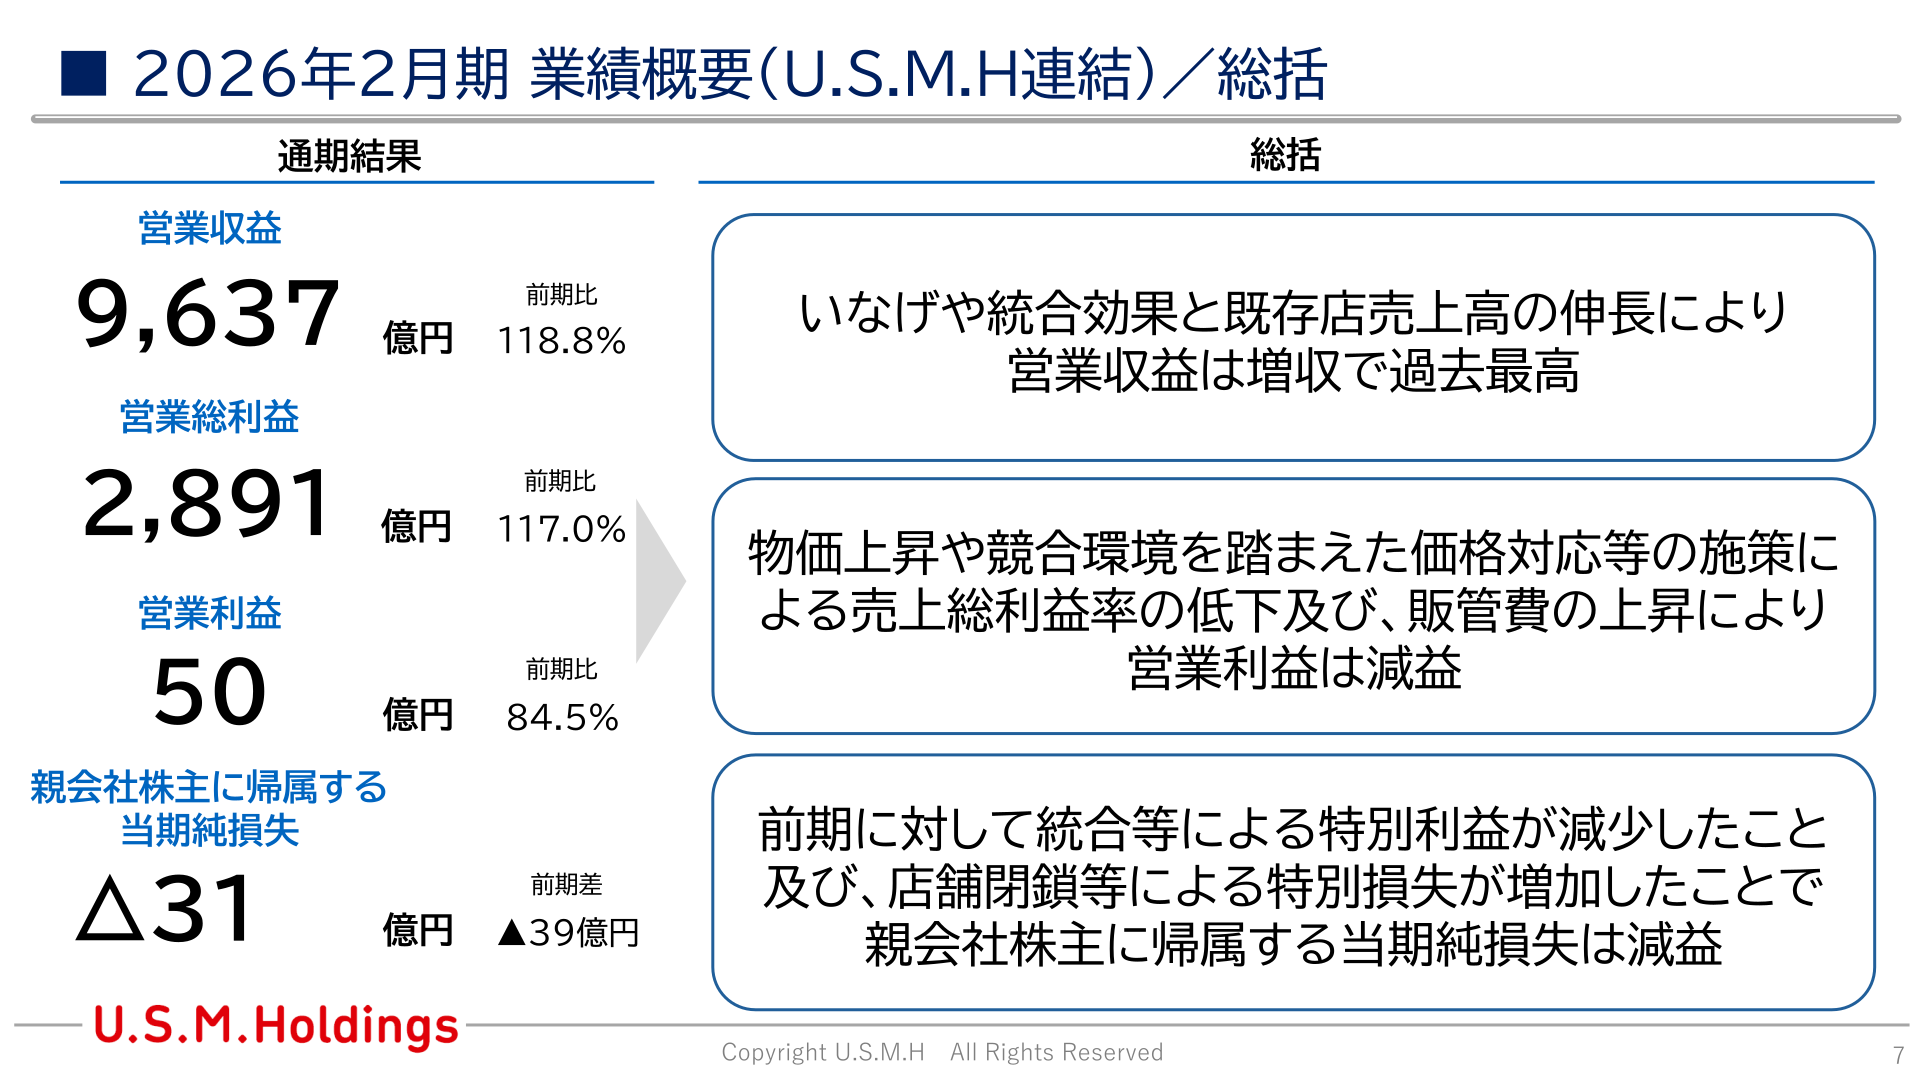
United Super Markets Holdings (U.S.M.H) released its results presentation for the fiscal year ended February 2026 (full-year results). Driven by integration effects from Inageya and growth in existing-store sales, consolidated operating revenue rose to 963,762 million yen (118.8% of the prior year), a record high. Meanwhile, the gross profit margin declined on pricing responses reflecting rising prices and the competitive environment, and SG&A expenses increased, so operating profit fell to 5,050 million yen (84.5% of the prior year). Together with a decrease in extraordinary income and an increase in extraordinary losses from store closures and the like, profit attributable to owners of parent turned to a net loss of 3,185 million yen (a change of 3,995 million yen from the prior year).
Consolidated Results (Full Year)
For the fiscal year ended February 2026, consolidated results were: operating revenue of 963,762 million yen (102.0% of net sales, 118.8% year on year); net sales of 944,425 million yen (100.0% of net sales, 118.9% YoY); gross profit of 269,795 million yen (28.6% of net sales, 117.4% YoY); operating gross profit of 289,131 million yen (30.6% of net sales, 117.0% YoY); SG&A expenses of 284,080 million yen (30.1% of net sales, 117.8% YoY); operating profit of 5,050 million yen (0.5% of net sales, 84.5% YoY); and ordinary profit of 4,911 million yen (0.5% of net sales, 80.0% YoY). Profit attributable to owners of parent was a net loss of 3,185 million yen (△0.3% of net sales, a change of 3,995 million yen from the prior year).
| Item | Actual (mn yen) | % of Net Sales | YoY (%) / YoY Change |
|---|---|---|---|
| Operating revenue | 963,762 | 102.0 | 118.8 |
| Net sales | 944,425 | 100.0 | 118.9 |
| Gross profit | 269,795 | 28.6 | 117.4 |
| Operating gross profit | 289,131 | 30.6 | 117.0 |
| SG&A expenses | 284,080 | 30.1 | 117.8 |
| Operating profit | 5,050 | 0.5 | 84.5 |
| Ordinary profit | 4,911 | 0.5 | 80.0 |
| Profit attributable to owners of parent (net loss) | △3,185 | △0.3 | YoY change -3,995 (mn yen) |
Operating Company Results / Capital Expenditure
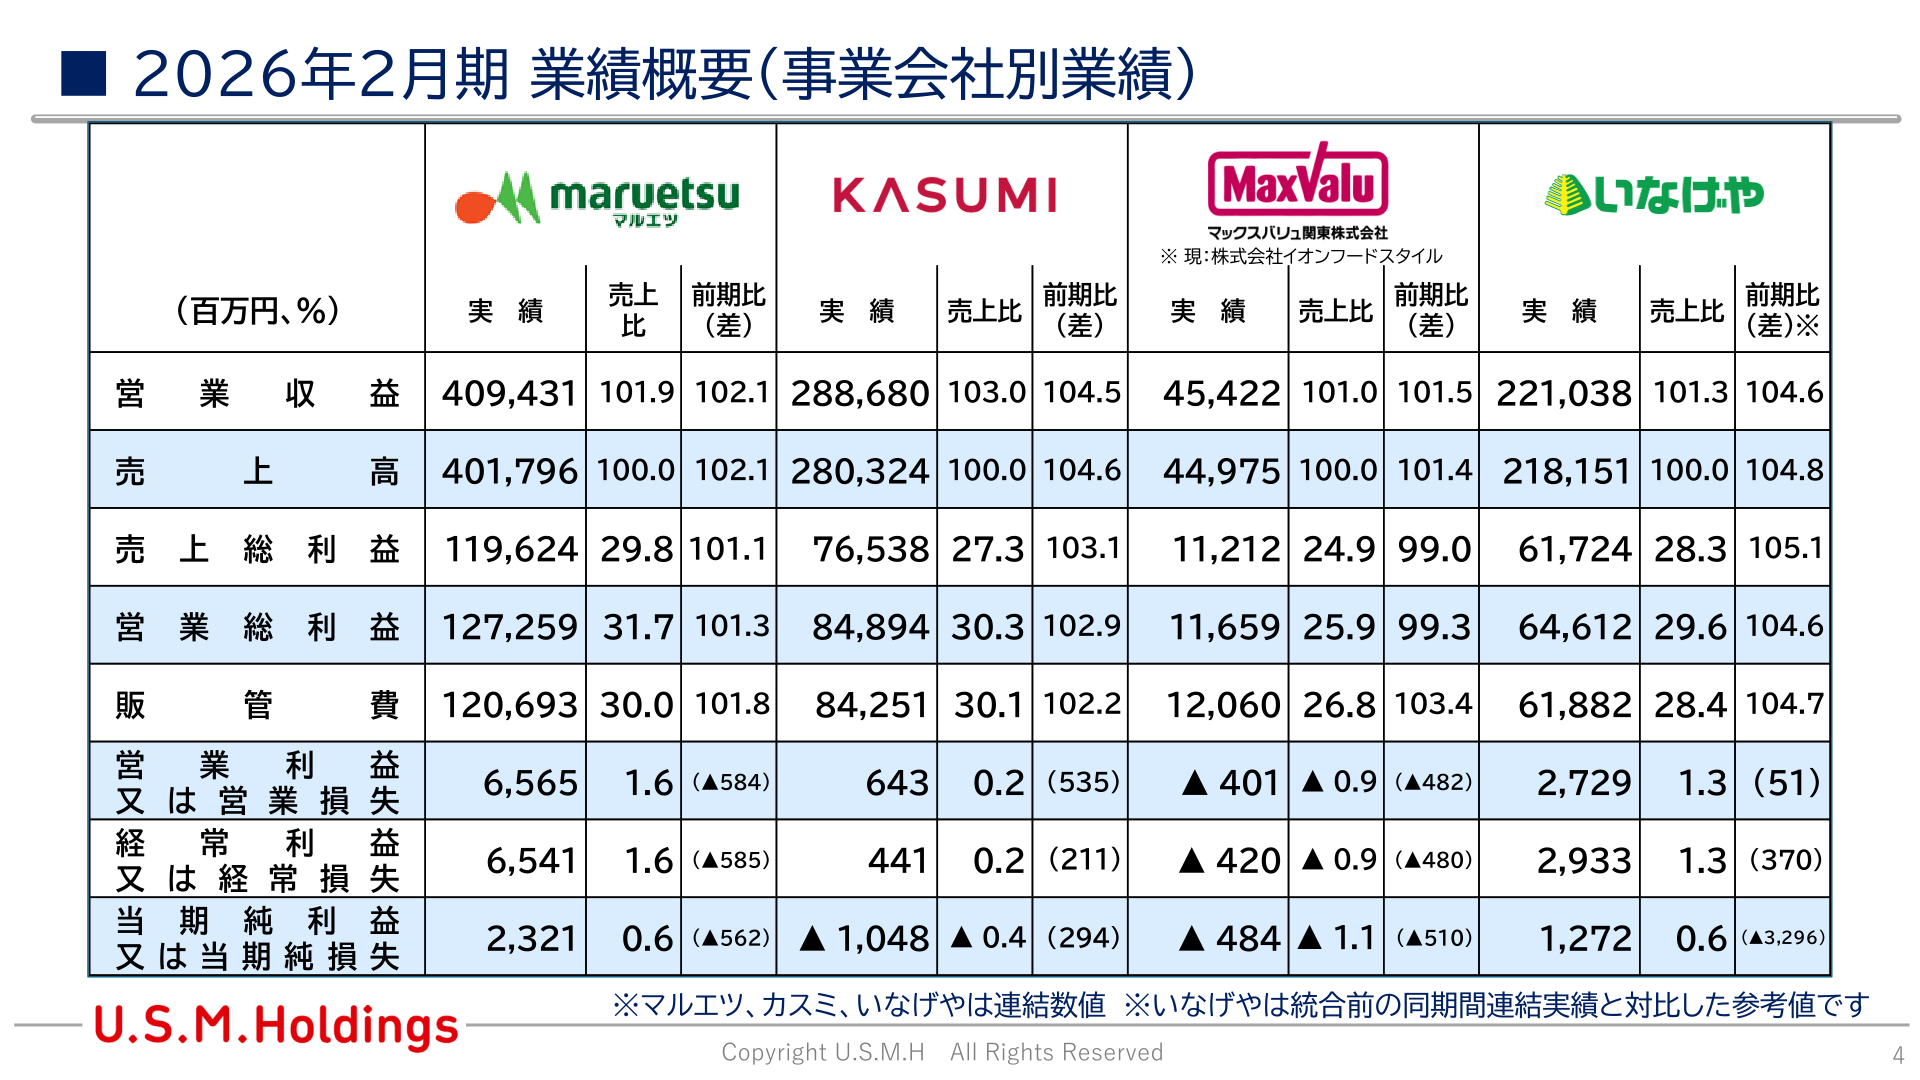
The materials present results by operating company for Maruetsu, Kasumi, Inageya, and Maxvalu Kanto (now AEON FOOD STYLE Co., Ltd.) (see the image on P.4 for details). Capital expenditure (on a recognized basis) totaled 28,063 million yen, including 12 new stores and revitalization of 18 existing stores; the breakdown is shown below. Operating cash flow was 25,613 million yen, interest-bearing debt was 54,228 million yen, and the number of stores at period-end was 665.
| Category | Actual (mn yen) | Composition (%) |
|---|---|---|
| New stores | 8,233 | 29.3 |
| Revitalization | 1,633 | 5.8 |
| Repairs & maintenance | 9,129 | 32.5 |
| Digital | 7,026 | 25.0 |
| Other | 2,042 | 7.3 |
| Total | 28,063 | 100.0 |
Full-Year Forecast (FY ending February 2027)
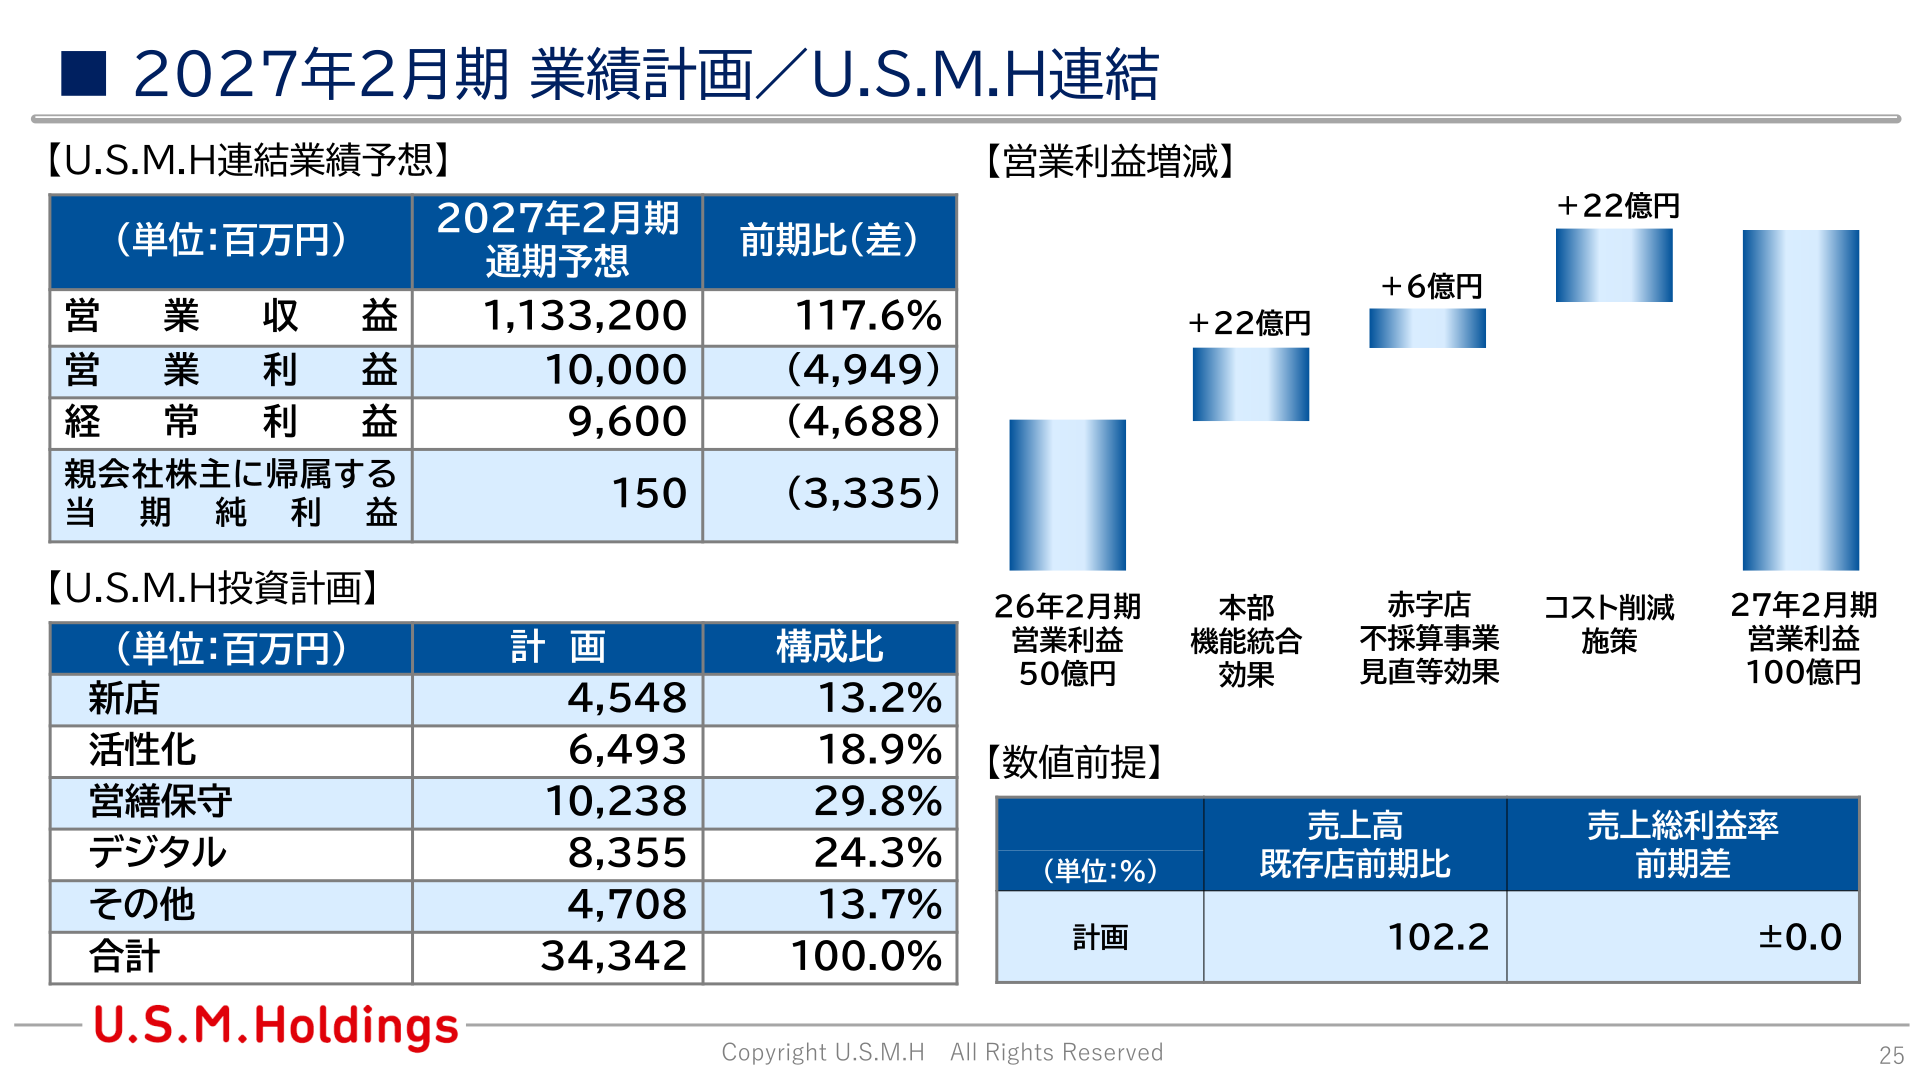
For the fiscal year ending February 2027, the consolidated forecast calls for operating revenue of 1,133,200 million yen (117.6% of the prior year), operating profit of 10,000 million yen (a change of 4,949 million yen from the prior year), ordinary profit of 9,600 million yen (a change of 4,688 million yen), and profit attributable to owners of parent of 150 million yen (a change of 3,335 million yen). Underlying assumptions are existing-store sales of 102.2% of the prior year and a year-on-year change in the gross profit margin of ±0.0%. As drivers of the change in operating profit, the company cites a head-office function integration effect of +2.2 billion yen, cost-reduction measures of +0.6 billion yen, and effects from reviewing loss-making stores and unprofitable businesses of +2.2 billion yen (operating profit rising from 5.0 billion yen in FY ended February 2026 to 10.0 billion yen in FY ending February 2027). The investment plan totals 34,342 million yen, as shown below.
| Item | FY ending Feb 2027 Forecast (mn yen) | YoY (%) / YoY Change |
|---|---|---|
| Operating revenue | 1,133,200 | 117.6 |
| Operating profit | 10,000 | YoY change 4,949 (mn yen) |
| Ordinary profit | 9,600 | YoY change 4,688 (mn yen) |
| Profit attributable to owners of parent | 150 | YoY change 3,335 (mn yen) |
| Category | Plan (mn yen) | Composition (%) |
|---|---|---|
| New stores | 4,548 | 13.2 |
| Revitalization | 6,493 | 18.9 |
| Repairs & maintenance | 10,238 | 29.8 |
| Digital | 8,355 | 24.3 |
| Other | 4,708 | 13.7 |
| Total | 34,342 | 100.0 |
Shareholder Returns
The materials do not contain any statement on shareholder-return policy such as dividends or share buybacks.
Medium-Term Plan / Topics
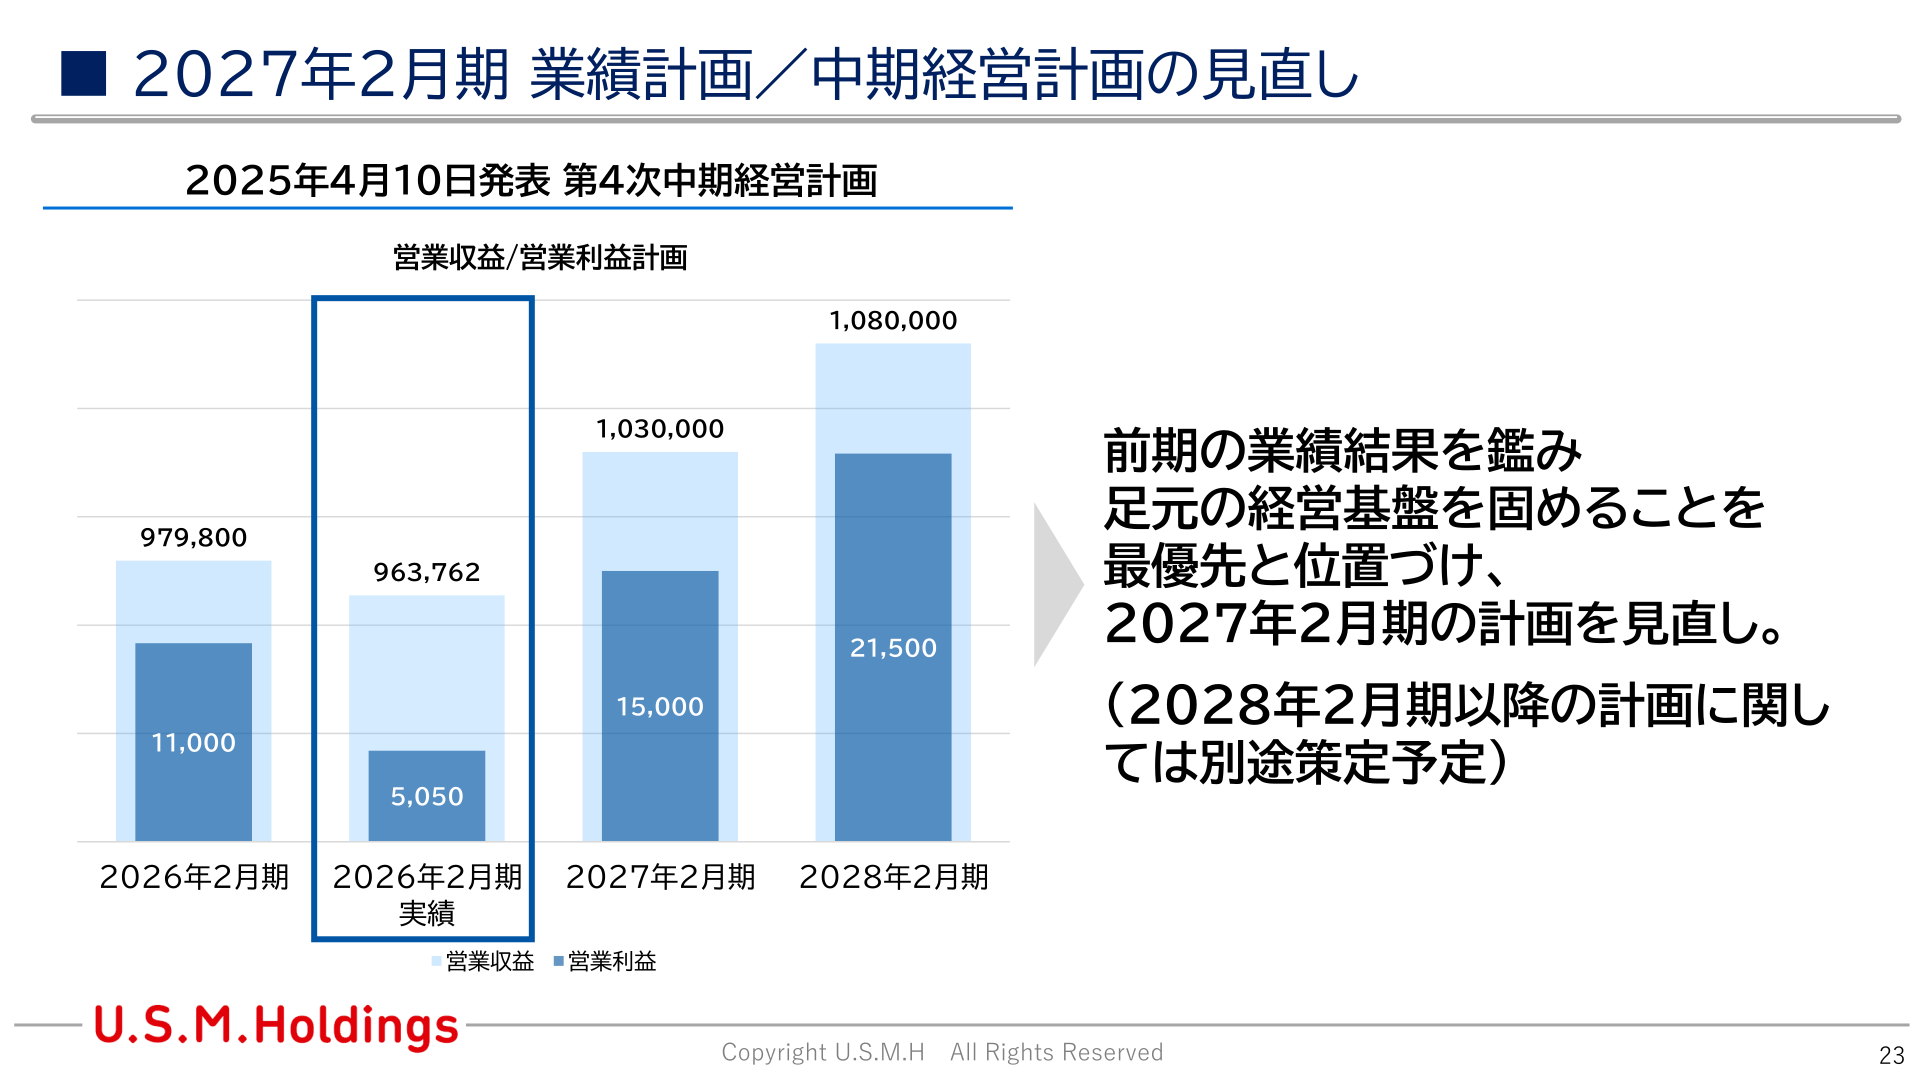
Regarding the 4th Medium-Term Management Plan announced on April 10, 2025, the company indicated that, in light of the prior year’s results, it will prioritize solidifying its current management base and will revise the plan for the fiscal year ending February 2027 (plans for the fiscal year ending February 2028 and beyond are to be formulated separately). The basic policy for the fiscal year ending February 2027 is “from individual-company optimization to group optimization” (group standardization and integrated management), and the company will pursue an area strategy (three areas — urban, downtown, and rural — combined with store models of 100 tsubo / 300 tsubo / over 500 tsubo) and structural reforms (integration of merchandise purchasing and procurement, rollout of group-common services, joint logistics and systems, and full integration of head-office functions into U.S.M.H).
This article is an analysis based on publicly available information and is not a recommendation to buy or sell any specific securities. Investment decisions are your own responsibility.
















