
This article is based on publicly available IR materials and is not a recommendation to buy or sell any specific securities.
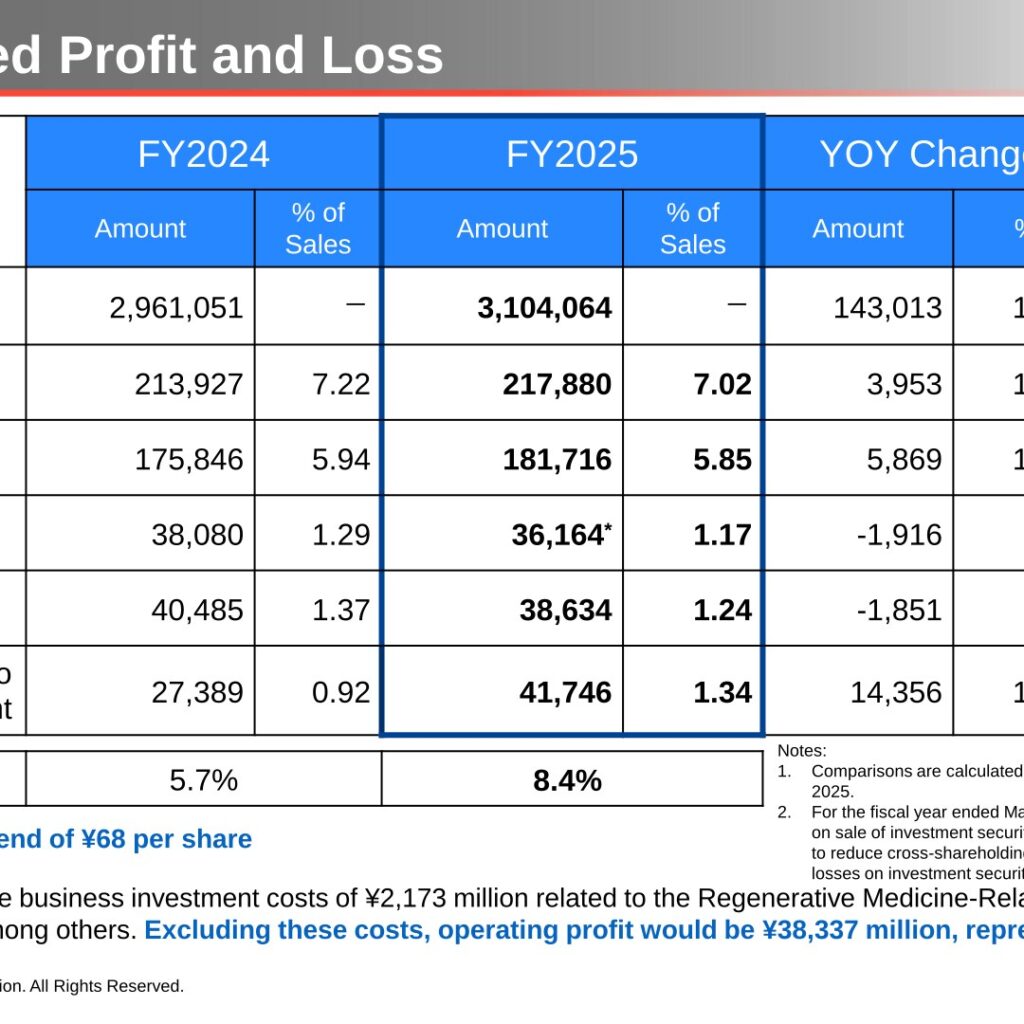
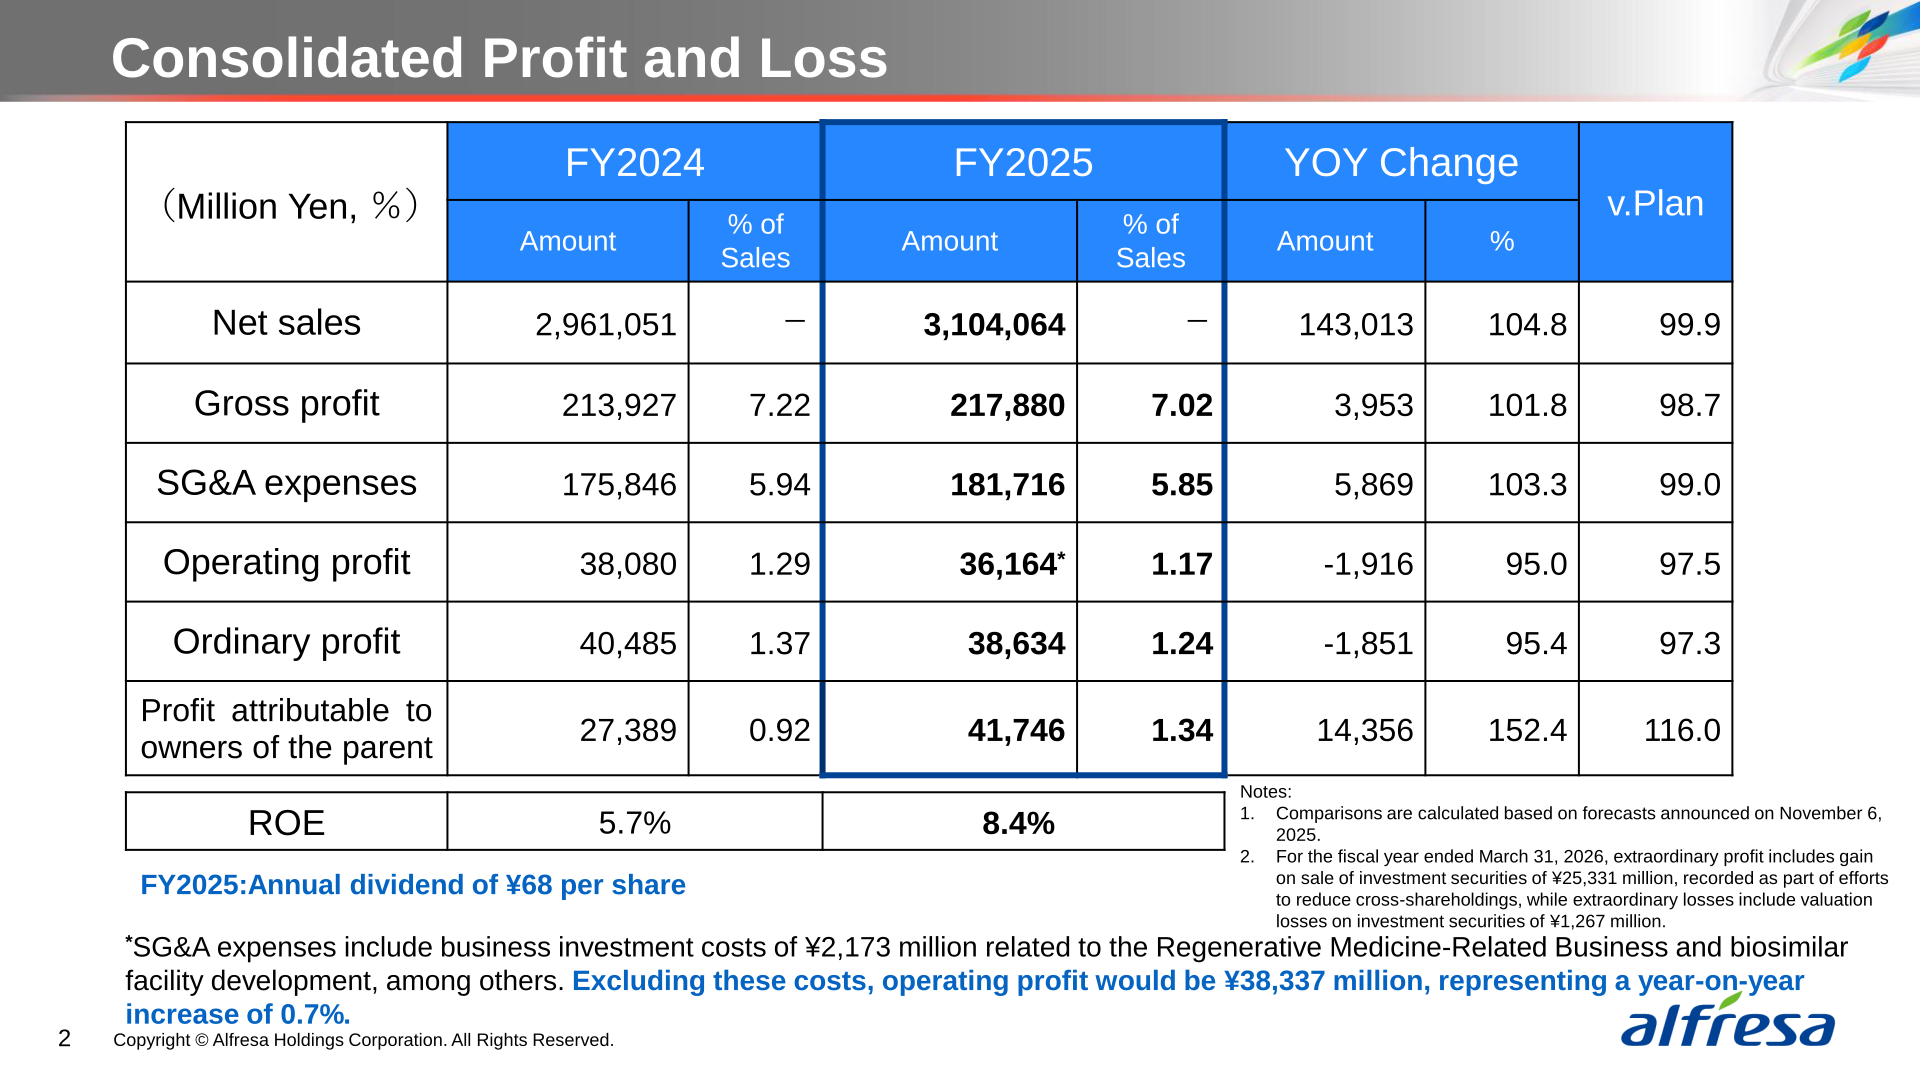
Alfresa Holdings Corporation (securities code 2784), a pharmaceutical wholesaling group, announced its results for the fiscal year ended March 2026 (April 2025–March 2026) on May 15, 2026. In the company’s materials, “FY2025” refers to the fiscal year ended March 31, 2026. Consolidated net sales came to ¥3,104,064 million (104.8% of the prior year), while operating profit was ¥36,164 million (95.0%). Profit attributable to owners of the parent rose sharply to ¥41,746 million (152.4%), and ROE improved from 5.7% to 8.4%. The annual dividend for FY2025 was ¥68 per share.
Consolidated Results (Full-Year Actual)
Net sales increased by ¥143,013 million year on year, reaching 99.9% of the company’s plan. Operating profit declined by ¥1,916 million; the company notes that SG&A expenses include business investment costs of ¥2,173 million related to the Regenerative Medicine-Related Business and biosimilar facility development, among others, and that excluding these costs operating profit would be ¥38,337 million, a year-on-year increase of 0.7%. Extraordinary profit includes a gain on sale of investment securities of ¥25,331 million, recorded as part of efforts to reduce cross-shareholdings, while extraordinary losses include valuation losses on investment securities of ¥1,267 million.
| Item (Million Yen, %) | FY2025 | FY2024 | YOY Change (Amount) | YOY (%) |
|---|---|---|---|---|
| Net sales | 3,104,064 | 2,961,051 | 143,013 | 104.8 |
| Gross profit | 217,880 | 213,927 | 3,953 | 101.8 |
| SG&A expenses | 181,716 | 175,846 | 5,869 | 103.3 |
| Operating profit | 36,164 | 38,080 | -1,916 | 95.0 |
| Ordinary profit | 38,634 | 40,485 | -1,851 | 95.4 |
| Profit attributable to owners of the parent | 41,746 | 27,389 | 14,356 | 152.4 |
| ROE | 8.4% | 5.7% | - | - |
Segment Results
In the Ethical Pharmaceuticals Wholesaling Business, the company reports an ethical pharmaceuticals market growth rate of +3.9% versus company growth of +5.9%, with market share of 24.7% (up 0.4 pp year on year). Despite the negative impact of NHI drug price revisions, net sales exceeded overall market growth, driven by the deployment of neo-primary strategies and an increase in the handling of limited distribution products such as specialty pharmaceuticals. The Self-Medication Products Wholesaling Business posted higher revenue and profit on expanded sales channels and continued cost control. The Manufacturing Business saw revenue and profit decline due to NHI drug price revisions, the introduction of fees for Treatment of Patients’ Choice for long-listed drugs in October 2024, and lower demand for diagnostic reagents. In the Dispensing Pharmacy and Related Businesses (formerly the Medical-Related Business segment; 176 stores as of March 31, 2026, down 1 store year on year), revenue rose but profit declined on NHI drug price revisions and higher procurement costs. The newly established Other Businesses segment (Regenerative Medicine-Related Business) recorded ¥1,099 million of SG&A expenses as upfront business investment, resulting in an operating loss of ¥1,099 million.
| Segment | Metric (Million Yen) | FY2025 | FY2024 |
|---|---|---|---|
| Ethical Pharmaceuticals Wholesaling | Net sales | 2,782,584 | 2,640,048 |
| Ethical Pharmaceuticals Wholesaling | Operating profit | 33,297 | 33,055 |
| Self-Medication Products Wholesaling | Net sales | 267,074 | 265,748 |
| Self-Medication Products Wholesaling | Operating profit | 3,012 | 2,950 |
| Manufacturing | Net sales | 52,179 | 54,065 |
| Manufacturing | Operating profit | 1,203 | 1,294 |
| Dispensing Pharmacy and Related Businesses | Net sales | 37,174 | 37,023 |
| Dispensing Pharmacy and Related Businesses | Operating profit | 499 | 596 |
| Other Businesses (Regenerative Medicine-Related) | Operating profit | -1,099 | - |
FY2026 Forecast
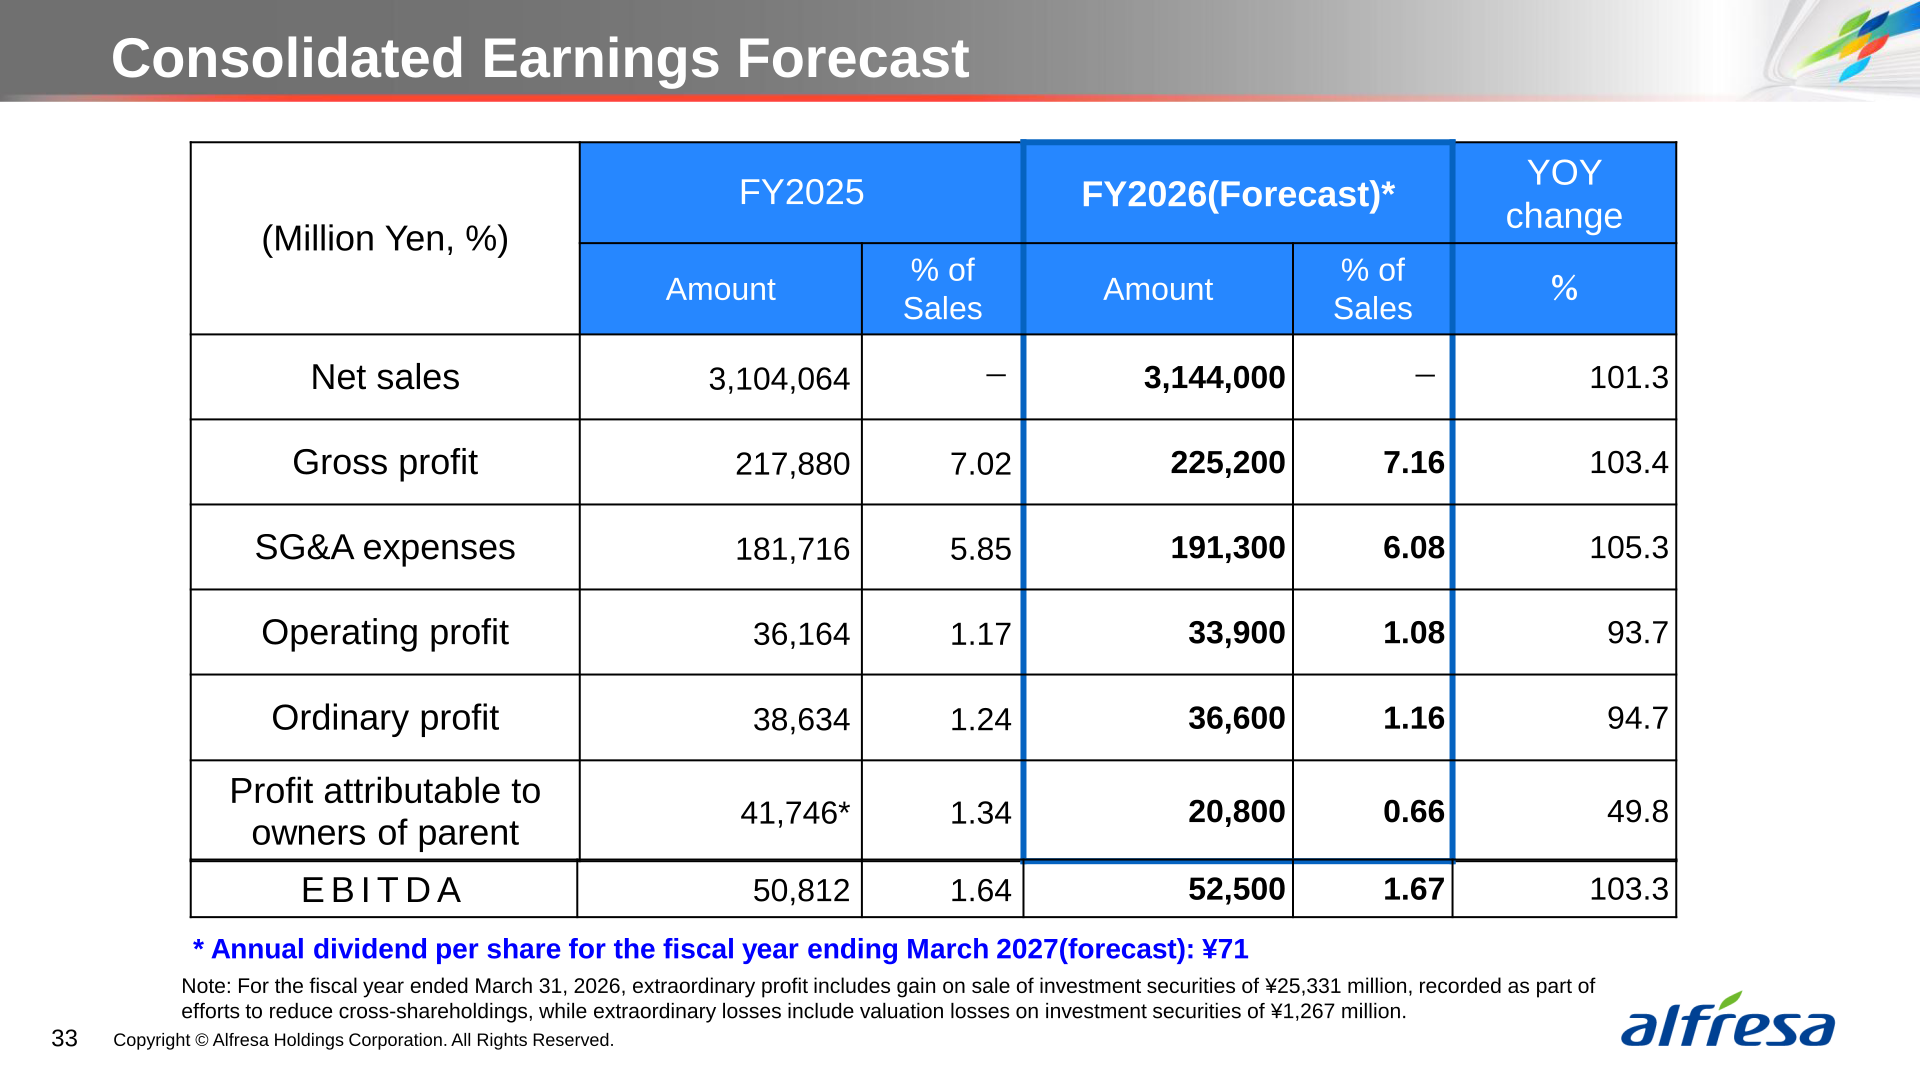
For the fiscal year ending March 31, 2027 (FY2026), the company forecasts net sales of ¥3,144,000 million (101.3% year on year), operating profit of ¥33,900 million (93.7%), ordinary profit of ¥36,600 million (94.7%), and profit attributable to owners of the parent of ¥20,800 million (49.8%). EBITDA is forecast at ¥52,500 million (103.3% of FY2025’s ¥50,812 million). In the Ethical Pharmaceuticals Wholesaling Business, the sales plan incorporates risks such as pharmaceutical companies potentially refraining from launching new products in Japan due to the impact of the U.S. most-favored-nation drug pricing policy. In the Other Businesses segment, the regenerative medicine-related business is expected to generate revenue from the current fiscal year, driven by the commencement of operations at the Haneda PDC, and Ark Medical Solutions Inc., which operates a CRO business, has been newly consolidated into this segment.
| Item (Million Yen, %) | FY2026 (Forecast) | FY2025 (Actual) | YOY (%) |
|---|---|---|---|
| Net sales | 3,144,000 | 3,104,064 | 101.3 |
| Gross profit | 225,200 | 217,880 | 103.4 |
| SG&A expenses | 191,300 | 181,716 | 105.3 |
| Operating profit | 33,900 | 36,164 | 93.7 |
| Ordinary profit | 36,600 | 38,634 | 94.7 |
| Profit attributable to owners of parent | 20,800 | 41,746 | 49.8 |
| EBITDA | 52,500 | 50,812 | 103.3 |
Shareholder Returns
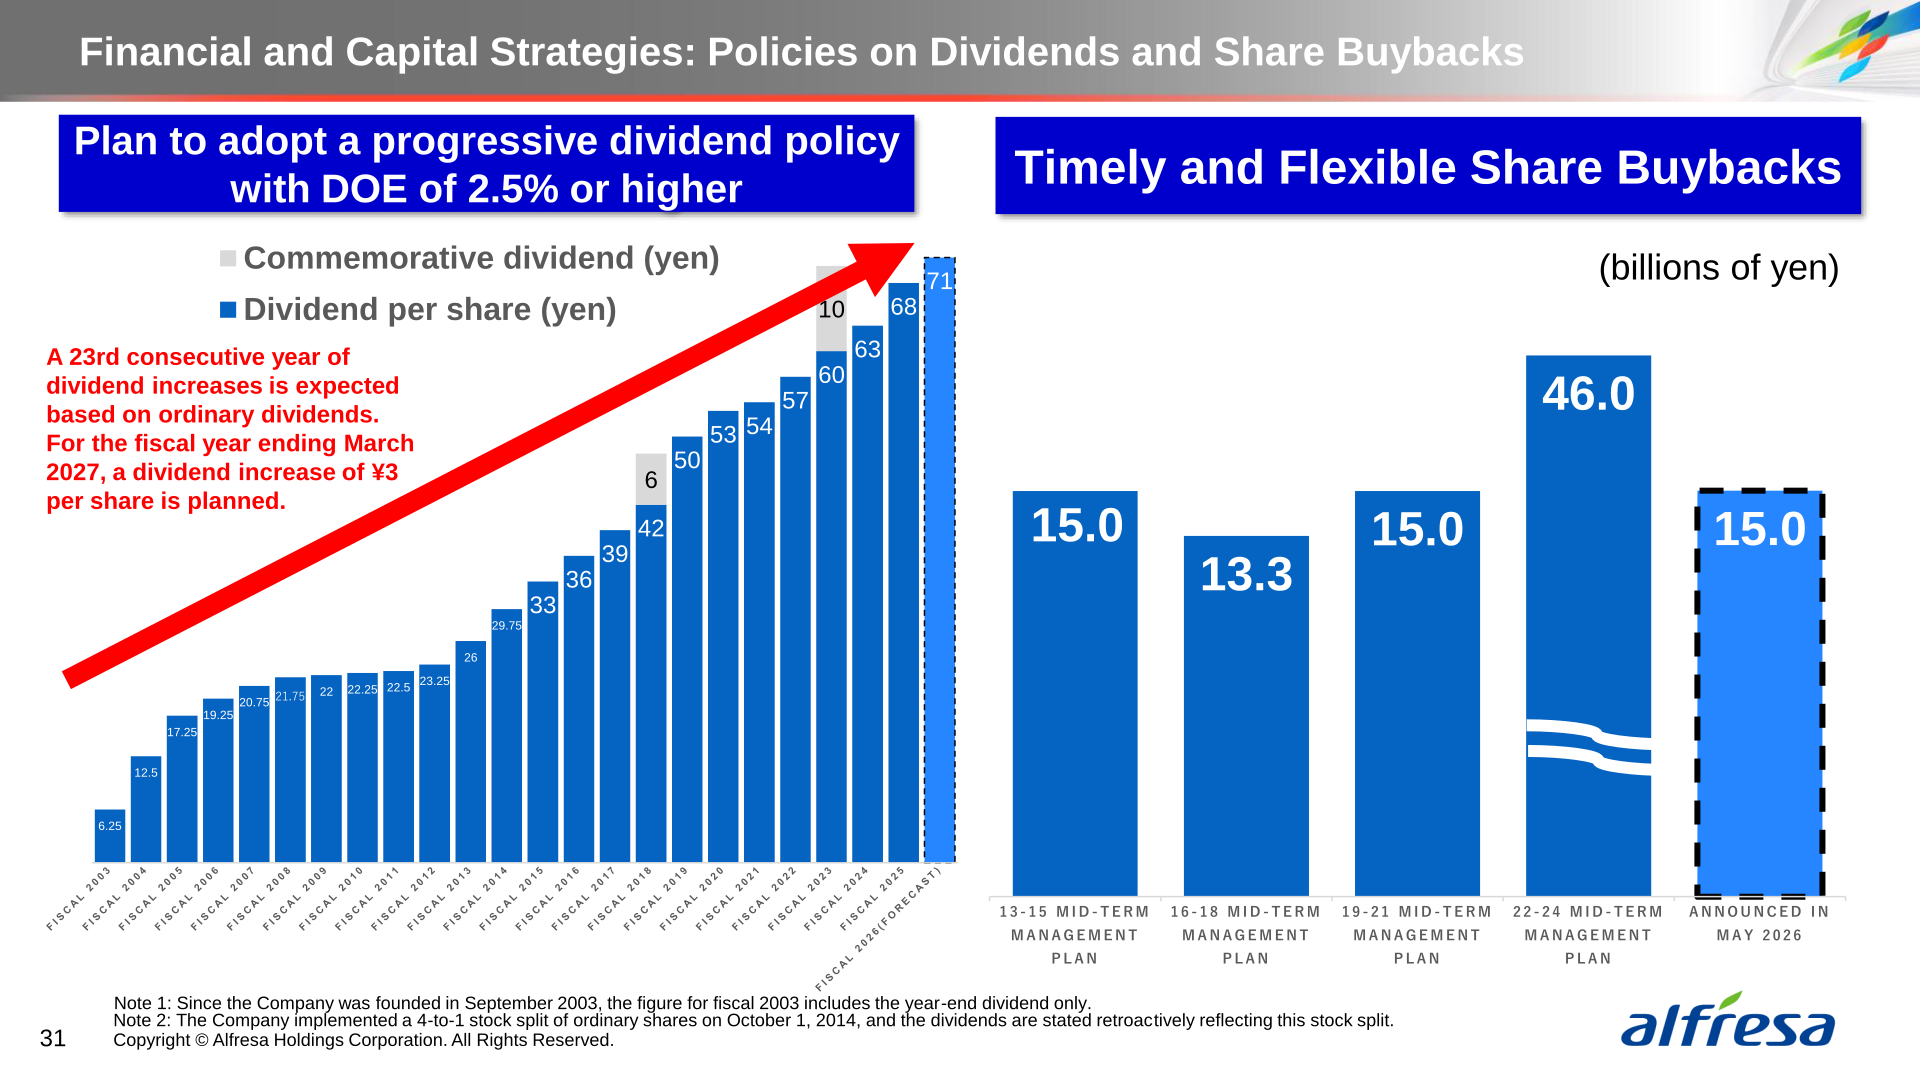
The annual dividend for FY2025 was ¥68 per share. The company plans to adopt a progressive dividend policy with a DOE (dividend on equity) of 2.5% or higher, together with timely, appropriate, and flexible share buybacks; ¥15 billion in buybacks was announced in May 2026. For the fiscal year ending March 2027, a dividend increase of ¥3 per share is planned, with an annual dividend forecast of ¥71 per share, and a 23rd consecutive year of dividend increases is expected based on ordinary dividends.
Medium-Term Plan / Topics
FY2025 is the first year of the 25-27 Mid-term Management Plan, positioned as Vision2032 Stage 2: “Pioneering the Future with Our Collective Strength.” Against the plan’s first-year framework, FY2025 results were net sales of ¥3,104.0 billion and operating profit of ¥36.1 billion; the plan calls for net sales of ¥3,330.0 billion and operating profit of ¥43.5 billion in the fiscal year ended March 31, 2028, and the Medium- to Long-Term Vision targets net sales of ¥4.0 trillion and operating profit of ¥70.0 billion in the fiscal year ending March 31, 2033. On financial and capital strategy, the company aims for an owners’ equity ratio in the low- to mid-30% range (33.7% as of March 31, 2026) and an average ROE of 7% over three years (8.4% in FY2025), and continues to reduce cross-shareholdings, which stood at 9.2% of net assets for the fiscal year ended March 2026. Topics include the commencement of operations of a new pharmaceutical manufacturing building at the Gunma Plant (April 2026), the planned start of operations at the Haneda Process Development Center for the regenerative medicine-related business, construction of a domestic biosimilar manufacturing plant (commenced in March 2026) through the joint venture Alfenax Biologics Corporation, and the launch of the PATH Solution Service, a platform supporting overseas biopharmaceutical companies entering the Japanese market.
This article is an analysis based on publicly available information and is not a recommendation to buy or sell any specific securities. Investment decisions are your own responsibility.
![[Obayashi] Investors’ Guide 2026 — The Complete 24-Article Breakdown](https://japan-equity.com/wp-content/uploads/2026/07/hub_cover-1024x1024.png)
![[Obayashi] IR & SR Policy — Feeding Dialogue Back into Management](https://japan-equity.com/wp-content/uploads/2026/07/p32_sq-1024x1024.jpg)
![[Obayashi] Real Estate Development — 18.7% Margin, ¥287.7bn Unrealized Gains](https://japan-equity.com/wp-content/uploads/2026/07/p20_sq-1024x1024.jpg)
![[Obayashi] Domestic Civil Engineering — Resilience Spending Supports 9.6% Margin](https://japan-equity.com/wp-content/uploads/2026/07/p11_sq-1024x1024.jpg)
![[Obayashi] Share Price & External Ratings — vs TOPIX, ESG Index Inclusion](https://japan-equity.com/wp-content/uploads/2026/07/p40_sq-1024x1024.jpg)
![[Construction] ¥75.5tn Investment, Shrinking Workforce — Big-5 Market Share](https://japan-equity.com/wp-content/uploads/2026/07/p12_sq-1024x1024.jpg)



![[Obayashi] Capital Policy & Shareholder Returns — ROE 10%+, DOE ~5%, ¥100bn Buyback](https://japan-equity.com/wp-content/uploads/2026/07/p27_sq-1024x1024.jpg)
![[Obayashi] Reducing Cross-Shareholdings — ¥285.2bn Sold in Five Years](https://japan-equity.com/wp-content/uploads/2026/07/p29_sq-1024x1024.jpg)
![[Obayashi] ¥750bn Investment Plan — ¥300bn to Development, ¥190bn to Tech/DX](https://japan-equity.com/wp-content/uploads/2026/07/p30_sq-1024x1024.jpg)
![[Obayashi] MTP2022 KPIs — Operating Profit ~2x Target, ROE 14.4%](https://japan-equity.com/wp-content/uploads/2026/07/p25_sq-1024x1024.jpg)
![[Obayashi] Cash Allocation — ¥420bn Investment CF Over Five Years](https://japan-equity.com/wp-content/uploads/2026/07/p26_sq-1024x1024.jpg)
![[Obayashi] Green Energy — 44 Plants, 344MW, and the Green Hydrogen Challenge](https://japan-equity.com/wp-content/uploads/2026/07/p21_sq-1024x1024.jpg)
![[Obayashi] Tackling the Labor Shortage — Robotics Construction®](https://japan-equity.com/wp-content/uploads/2026/07/p14_sq-1024x1024.jpg)
