
This article is based on publicly available IR materials and is not a recommendation to buy or sell any specific securities.
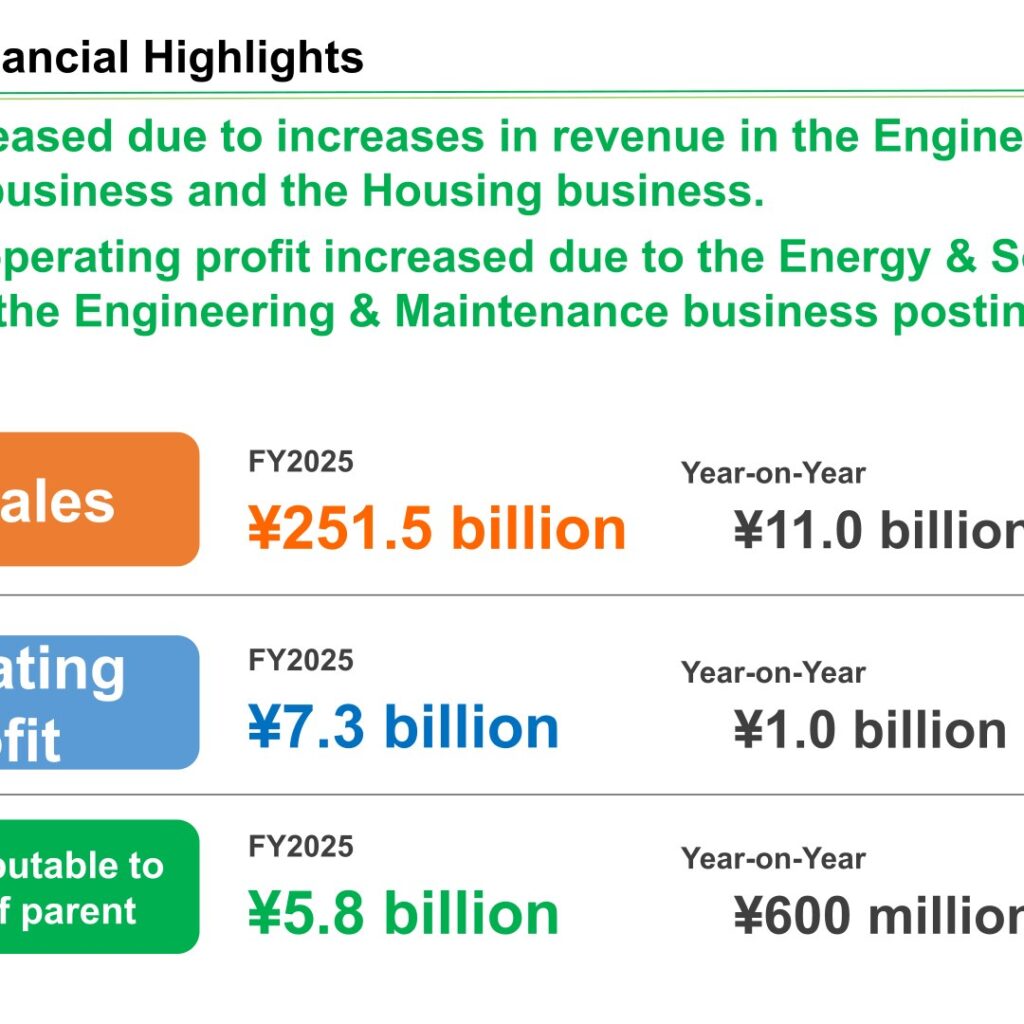
SALA Corporation, the Toyohashi-based living and energy services group serving eastern Aichi and western Shizuoka, posted FY2025 net sales of ¥251.5 billion, up ¥11.0 billion [4.6%] year on year, and operating profit of ¥7.3 billion, up ¥1.0 billion [17.0%]. Profit attributable to owners of parent came to ¥5.8 billion, up ¥600 million [11.8%]. Alongside the results, the company announced its 6th Medium-Term Management Plan, which targets operating profit of ¥12.0 billion and an operating profit margin of 4.0% by 2030.
Note: The company labels the year covered by this briefing “FY2025”; its English results release issued for the same period is titled “Consolidated Financial Results for the Fiscal Year Ended November 30, 2025 (Under Japanese GAAP)”. This article is based on the English briefing deck “FY2025 Financial Results & 6th Medium-Term Management Plan Briefing (Summary Version)”, dated January 15, 2026; all figures are as reported in that deck.
Consolidated Results (Full-Year Actual)
The deck attributes the increase in net sales to higher revenue in the Engineering & Maintenance business and the Housing business. On profit, it states that operating profit increased because the Energy & Solutions business and the Engineering & Maintenance business posted significant profit growth. Figures in brackets are the year-on-year rates of change shown in the deck.
| Item | FY2025 | Year-on-Year change |
|---|---|---|
| Net sales | ¥251.5 billion | ¥11.0 billion [4.6%] |
| Operating profit | ¥7.3 billion | ¥1.0 billion [17.0%] |
| Profit attributable to owners of parent | ¥5.8 billion | ¥600 million [11.8%] |
The deck notes separately that the actual results for 2025 include a gain on valuation of derivatives of ¥1.8 billion, and that the effects of loss (gain) on valuation of derivatives are not included in its plan figures.
Segment Results
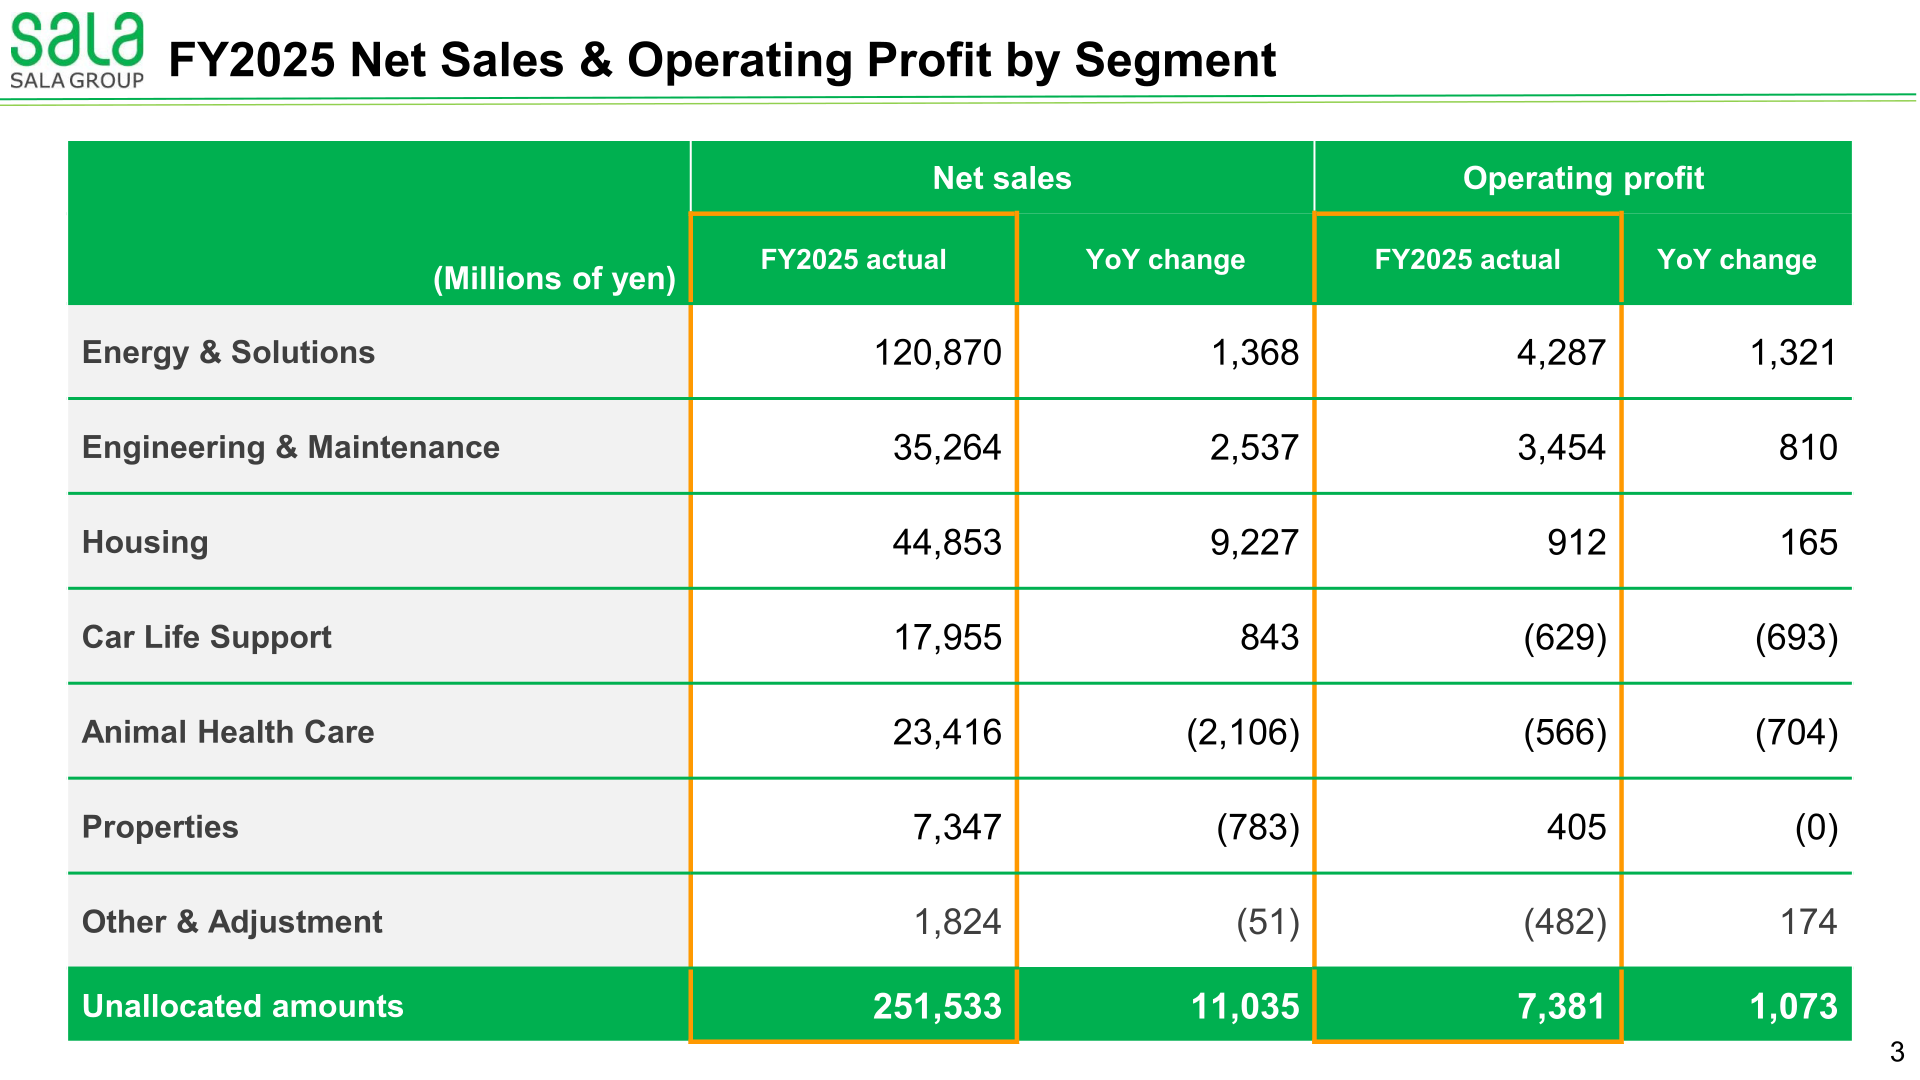
Energy & Solutions remained the largest segment by both net sales and operating profit, while Engineering & Maintenance delivered the second-largest profit contribution. Housing recorded the biggest sales increase of any segment, at ¥9,227 million. Car Life Support and Animal Health Care were the two loss-making segments, each moving further into the red year on year. In the deck’s segment table the bottom (total) row is labelled “Unallocated amounts”; its figures are the consolidated totals, consistent with the ¥251.5 billion of net sales and ¥7.3 billion of operating profit reported on the financial highlights slide, and they are shown as “Total” below.
| Segment (Millions of yen) | Net sales: FY2025 actual | Net sales: YoY change | Operating profit: FY2025 actual | Operating profit: YoY change |
|---|---|---|---|---|
| Energy & Solutions | 120,870 | 1,368 | 4,287 | 1,321 |
| Engineering & Maintenance | 35,264 | 2,537 | 3,454 | 810 |
| Housing | 44,853 | 9,227 | 912 | 165 |
| Car Life Support | 17,955 | 843 | (629) | (693) |
| Animal Health Care | 23,416 | (2,106) | (566) | (704) |
| Properties | 7,347 | (783) | 405 | (0) |
| Other & Adjustment | 1,824 | (51) | (482) | 174 |
| Total | 251,533 | 11,035 | 7,381 | 1,073 |
Multi-Year Track Record
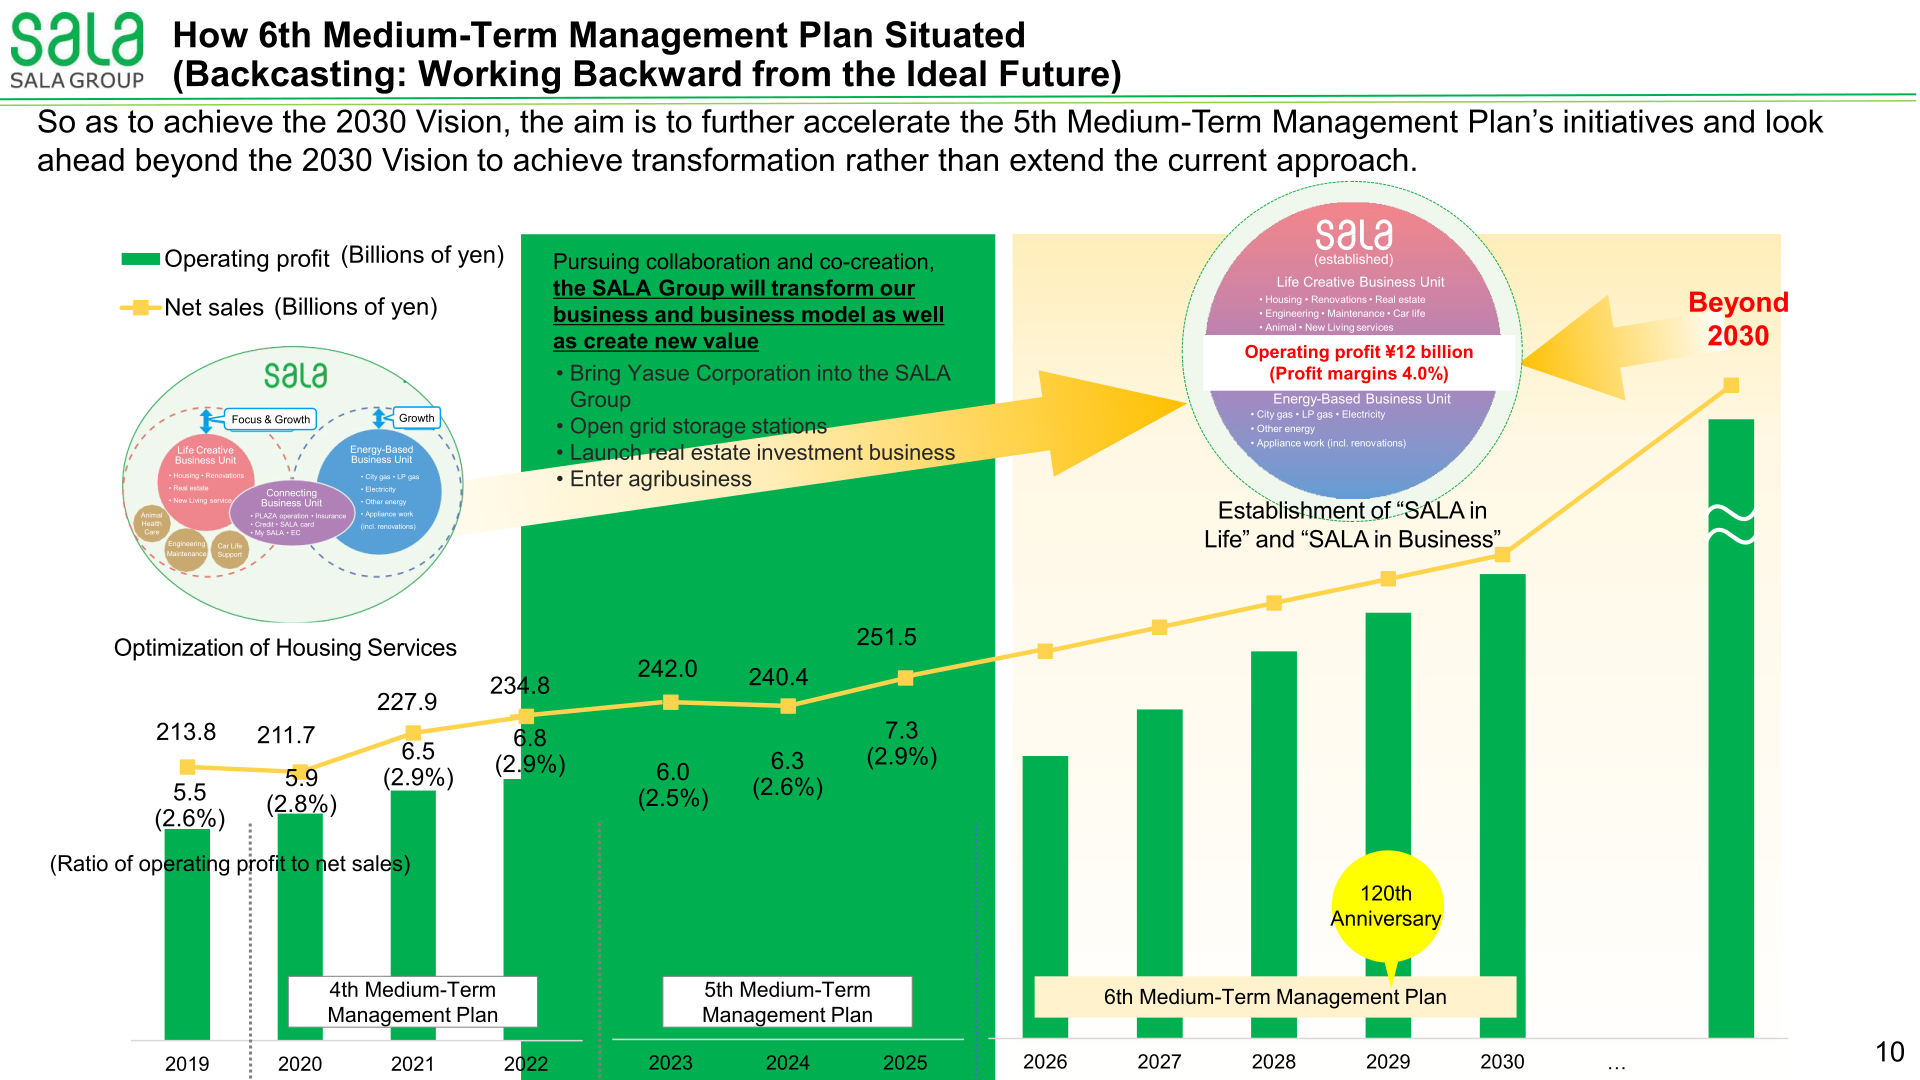
The briefing charts net sales and operating profit from 2019 onward, with the ratio of operating profit to net sales shown in parentheses. FY2025 marks the highest net sales and operating profit on the chart.
| Year | Net sales (Billions of yen) | Operating profit (Billions of yen) | Ratio of operating profit to net sales |
|---|---|---|---|
| 2019 | 213.8 | 5.5 | (2.6%) |
| 2020 | 211.7 | 5.9 | (2.8%) |
| 2021 | 227.9 | 6.5 | (2.9%) |
| 2022 | 234.8 | 6.8 | (2.9%) |
| 2023 | 242.0 | 6.0 | (2.5%) |
| 2024 | 240.4 | 6.3 | (2.6%) |
| 2025 | 251.5 | 7.3 | (2.9%) |
Review of the 5th Medium-Term Management Plan
The deck states that operating profit was expected to come in at 7.3 billion yen, falling short of the initial 8-billion-yen plan, and that the operating profit margin was estimated to remain at 2.9%, also below plan. It describes the plan as having advanced business-model transformation and new value creation — including the capital and business alliance with YASUE CORPORATION, the launch of the agribusiness, grid storage battery and real estate investment businesses, and the establishment of the Institute for Living and Housing Research — while results fell short on the numerical targets, presenting a challenge to enhancing profitability. The ROE figures exclude the effects of loss (gain) on valuation of derivatives.
| Item | Actual | Plan |
|---|---|---|
| Net sales | ¥251.5 billion | ¥270 billion |
| Operating profit | ¥7.3 billion | ¥8 billion |
| Operating profit margin | 2.9% | 3.0% |
| ROE | 6.7% | 8.0% |
6th Medium-Term Management Plan: Numerical Targets
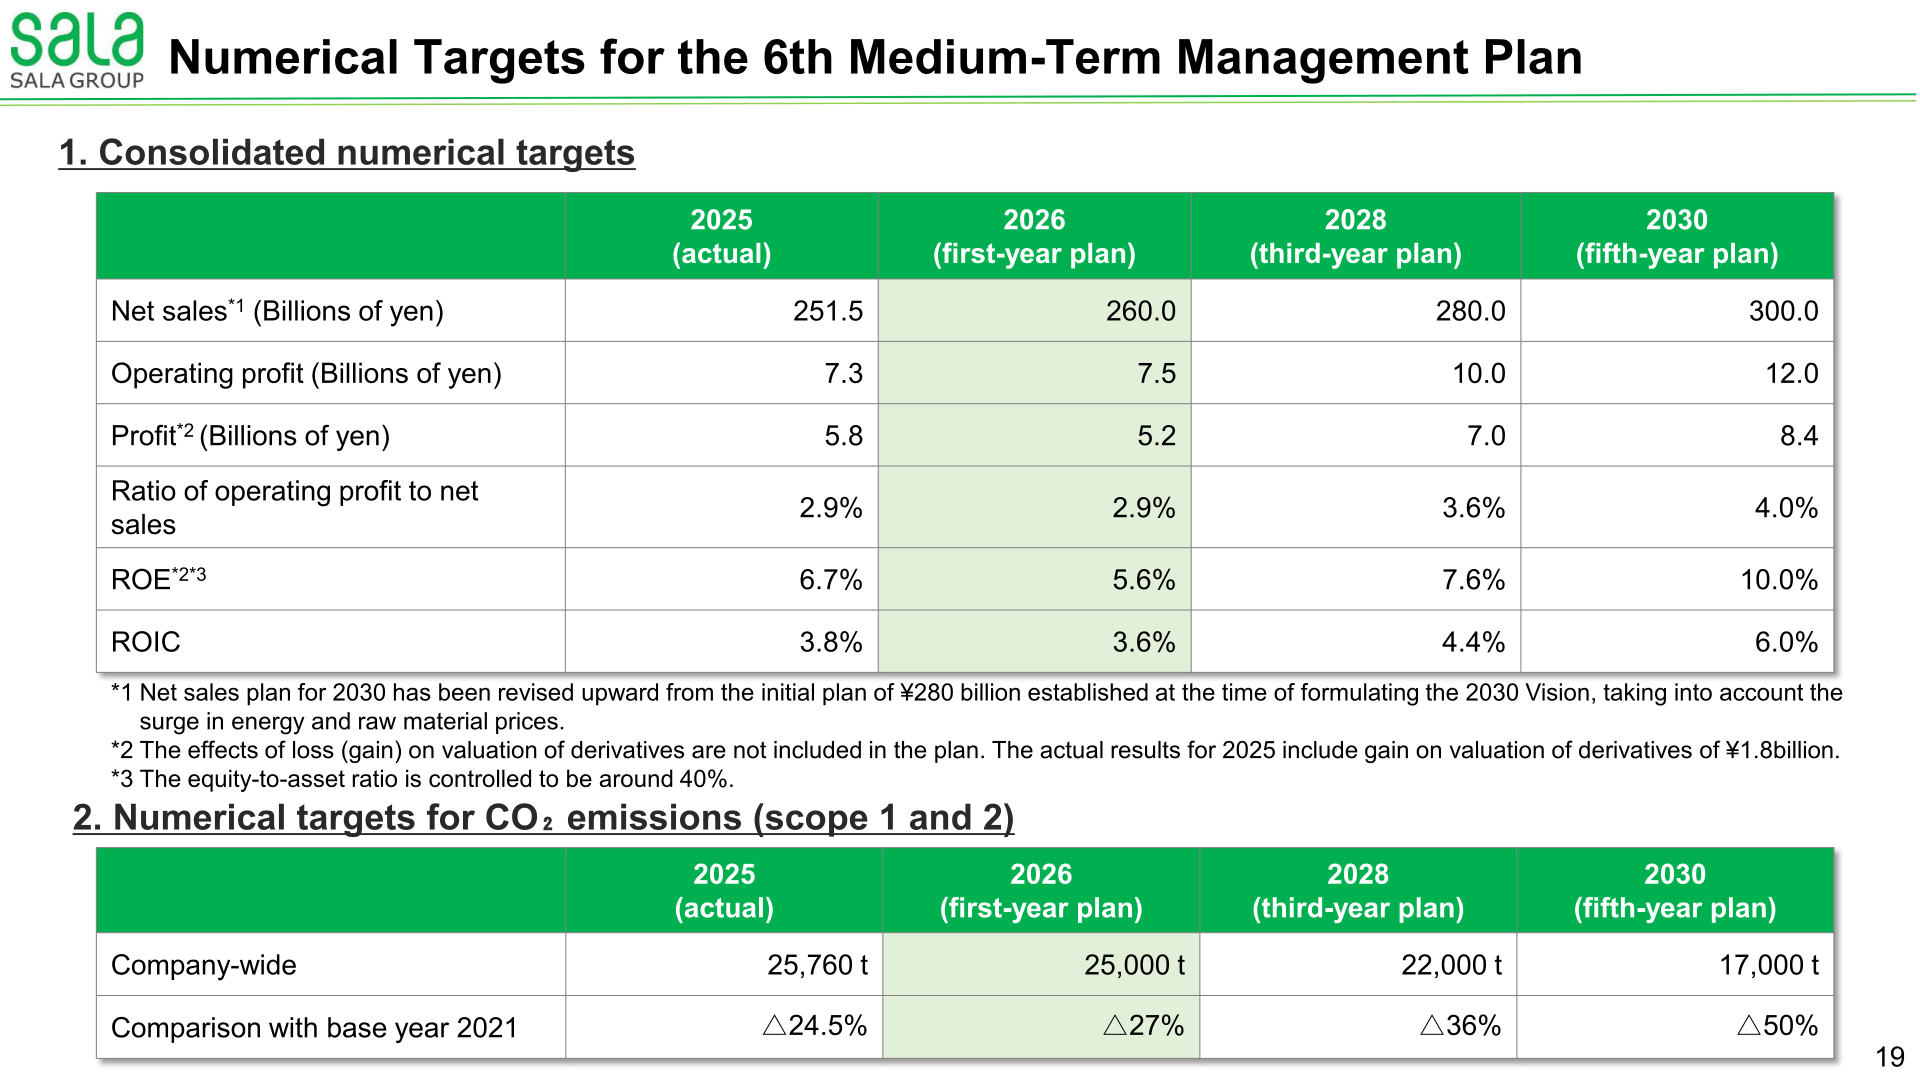
The new plan runs from 2026 and is built around the basic policy “X (Cross) 120”, referring to the group’s 120th anniversary on October 10, 2029 and the 2030 Vision operating profit target of ¥12 billion. The plan sets out five key strategies across business strategy (establishing the “SALA in Life” and “SALA in Business” business models, creating new value to generate business, and improving profitability of current businesses) and the foundation for transformation (human resources and digital transformation). The table below shows the consolidated numerical targets, including the first-year (2026) plan.
| Item | 2025 (actual) | 2026 (first-year plan) | 2028 (third-year plan) | 2030 (fifth-year plan) |
|---|---|---|---|---|
| Net sales (Billions of yen) | 251.5 | 260.0 | 280.0 | 300.0 |
| Operating profit (Billions of yen) | 7.3 | 7.5 | 10.0 | 12.0 |
| Profit (Billions of yen) | 5.8 | 5.2 | 7.0 | 8.4 |
| Ratio of operating profit to net sales | 2.9% | 2.9% | 3.6% | 4.0% |
| ROE | 6.7% | 5.6% | 7.6% | 10.0% |
| ROIC | 3.8% | 3.6% | 4.4% | 6.0% |
The deck notes that the net sales plan for 2030 has been revised upward from the initial plan of ¥280 billion established at the time of formulating the 2030 Vision, taking into account the surge in energy and raw material prices; that the profit and ROE lines exclude the effects of loss (gain) on valuation of derivatives; and that the equity-to-asset ratio is controlled to be around 40%. Separate CO₂ targets (scope 1 and 2) call for company-wide emissions of 25,000 t in 2026, 22,000 t in 2028 and 17,000 t in 2030, against 25,760 t in 2025 — a reduction of △50% from the 2021 base year by 2030, versus △24.5% achieved in 2025.
Growth Scenario to 2030
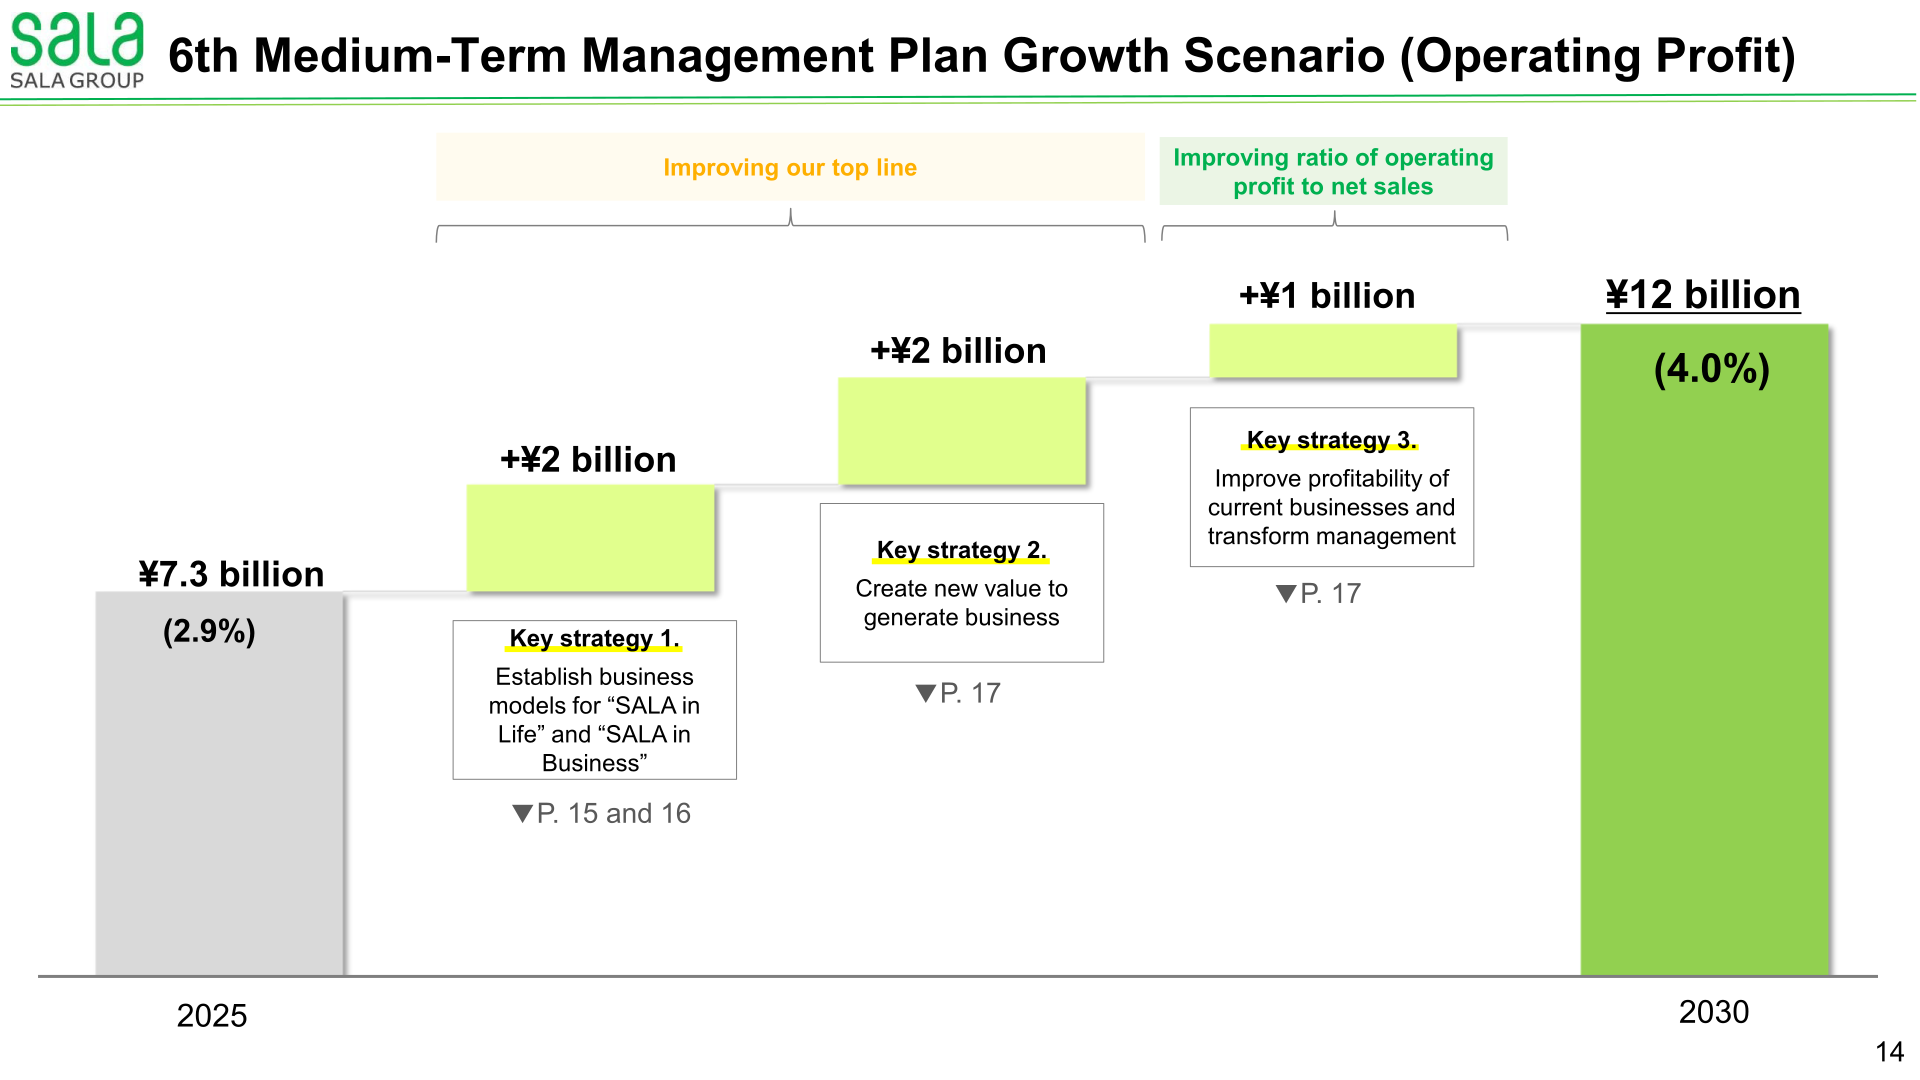
The operating profit bridge from 2025 to 2030 assigns ¥2 billion to Key strategy 1 (establish business models for “SALA in Life” and “SALA in Business”) and ¥2 billion to Key strategy 2 (create new value to generate business), both grouped under “improving our top line”, plus ¥1 billion to Key strategy 3 (improve profitability of current businesses and transform management) under “improving ratio of operating profit to net sales”. Within the top-line initiatives, the renovation-focused stock housing business targets 2030 net sales of ¥30 billion (compared to 2025: +¥14 billion), and the Group BtoB smart energy and facility solutions business also targets 2030 net sales of ¥30 billion (compared to 2025: +¥8.5 billion).
| Step | Operating profit |
|---|---|
| 2025 | ¥7.3 billion (2.9%) |
| Key strategy 1. Establish business models for “SALA in Life” and “SALA in Business” | +¥2 billion |
| Key strategy 2. Create new value to generate business | +¥2 billion |
| Key strategy 3. Improve profitability of current businesses and transform management | +¥1 billion |
| 2030 | ¥12 billion (4.0%) |
Shareholder Returns and Capital Allocation
Under the financial strategy of the 6th Medium-Term Management Plan, the deck sets out capital allocation for growth of ¥45 billion in growth investment — investment in business transformation with an eye towards Beyond 2030, and establishing a foundation for new growth — plus ¥15 billion of investment to maintain and renew equipment, and ¥21.2 billion of shareholder returns. A dividend per share or a specific payout or total return ratio is not disclosed in this briefing material; this cannot be confirmed from the materials.
This article is an analysis based on publicly available information and is not a recommendation to buy or sell any specific securities. Investment decisions are your own responsibility.
















