
This article is based on publicly available IR materials and is not a recommendation to buy or sell any specific securities.
Note: ARATA’s English-language results presentation states on its cover that the slides were produced with a machine automatic translation service, so it is not treated here as an English-language disclosure; this article is an English translation of the Japanese-language article on our sister site Investalk, which is based on the company’s Japanese-language IR materials, with figures transcribed as reported. The source materials label the year ended March 31, 2026 as the fiscal year ended March 2026 (FY26/3); this site classifies that year as FY2025, while the text, tables and segment data below keep the labels used in the source materials. Amounts are in millions of yen unless otherwise noted.
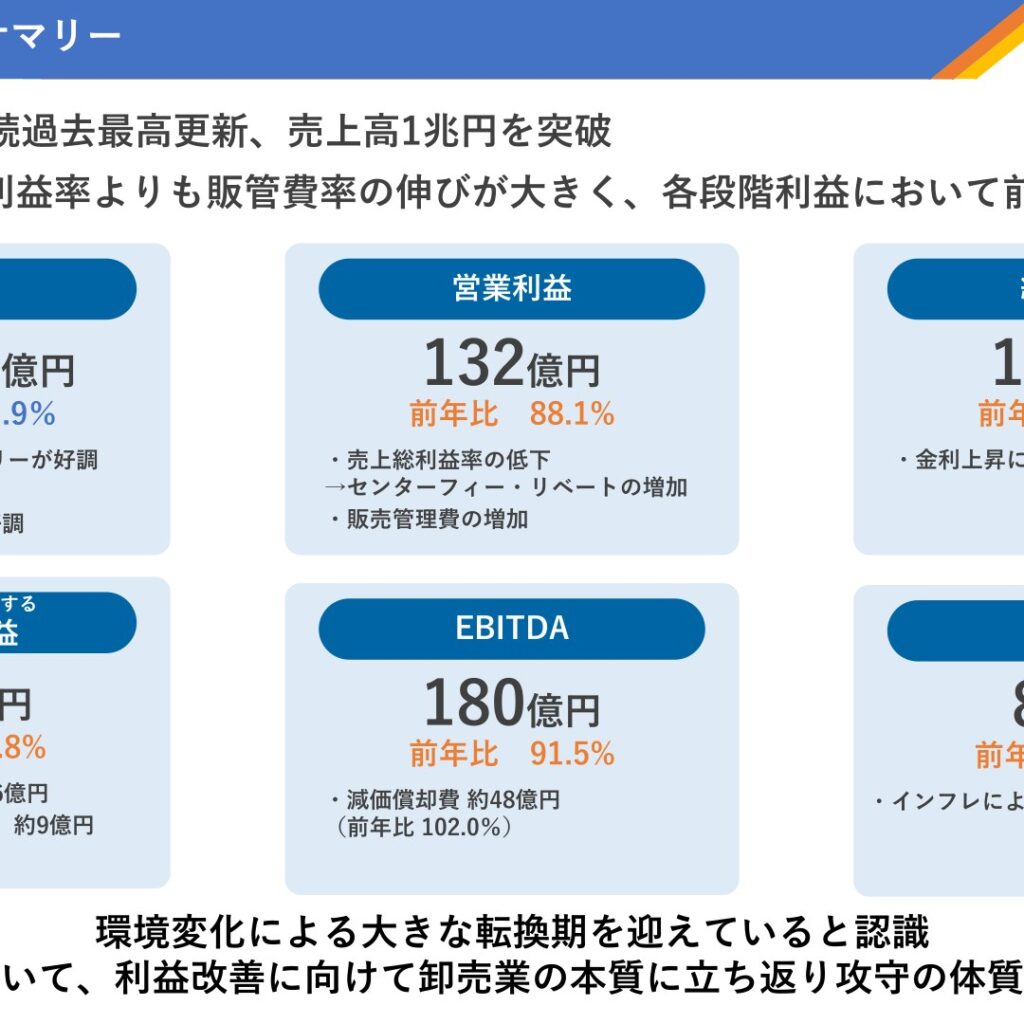
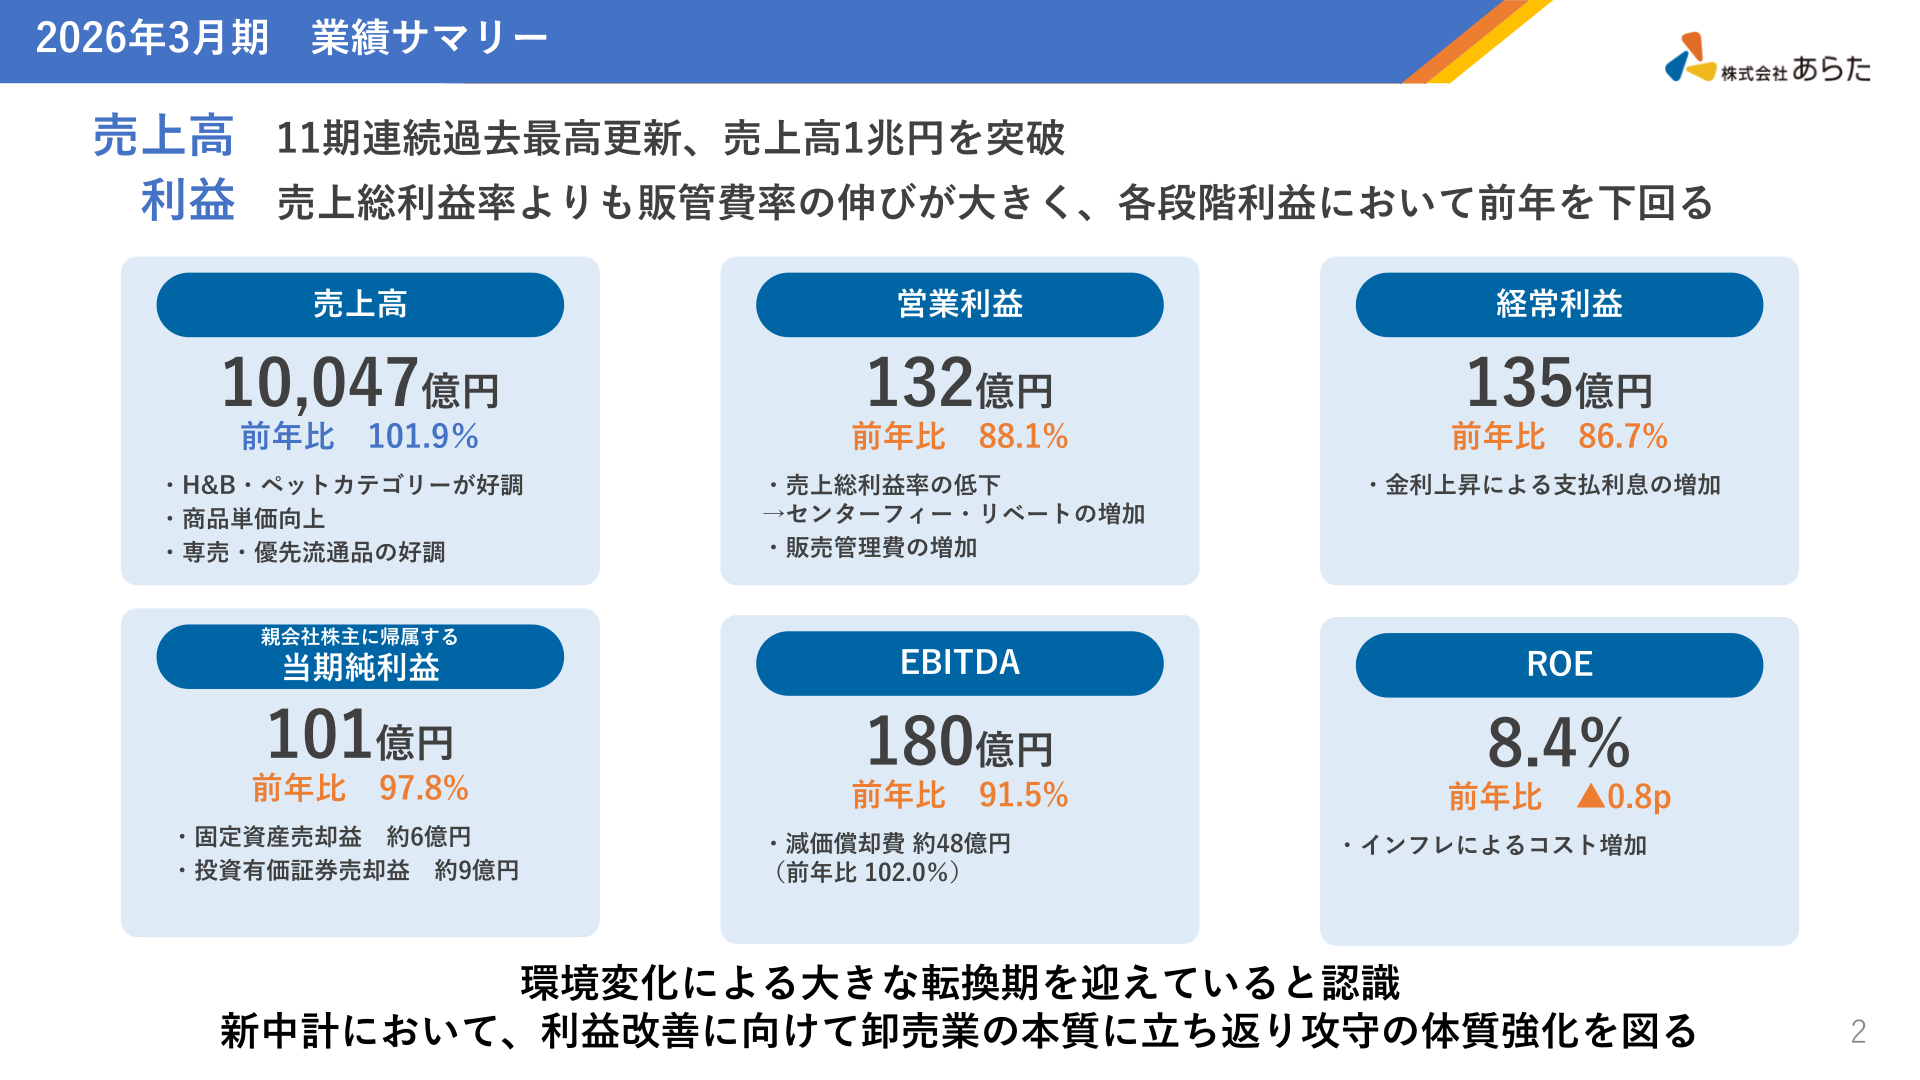
In the fiscal year ended March 2026, ARATA’s net sales set a record high for the 11th consecutive year and surpassed 1 trillion yen. Strong performance in the H&B and pet categories, higher product unit prices and growth in exclusive and priority-distribution items contributed to the top line, while increases in center fees and rebates and higher selling, general and administrative expenses meant the SG&A expense ratio rose more than the gross profit margin, so operating profit, ordinary profit and profit attributable to owners of parent all came in below the previous year. The company says it recognizes that it is facing a major turning point brought about by changes in its operating environment, and that under its new medium-term management plan it will return to the essence of the wholesale business and strengthen both its offensive and defensive footing.
Consolidated Results (Full-Year Actual)
Net sales were 1.0047 trillion yen (101.9% of the previous year), operating profit 13.2 billion yen (88.1%), ordinary profit 13.5 billion yen (86.7%), profit attributable to owners of parent 10.1 billion yen (97.8%) and EBITDA 18.0 billion yen (91.5%), while ROE was 8.4% (down 0.8pt year on year). The decline in operating profit was mainly due to a lower gross profit margin (higher center fees and rebates) and an increase in selling, general and administrative expenses; for ordinary profit, higher interest expense on rising interest rates was an additional factor. For profit attributable to owners of parent, a gain on sales of property, plant and equipment (approximately 600 million yen) and a gain on sales of investment securities (approximately 900 million yen) narrowed the decline, while inflation-driven cost increases also had an impact.
| Item | FY ended March 2025 (Actual) | FY ended March 2026 (Actual) | YoY |
|---|---|---|---|
| Net sales (millions of yen) | 986,212 | 1,004,749 | 101.9% |
| Gross profit (millions of yen) | 96,221 | 97,330 | 101.2% |
| SG&A expenses (millions of yen) | 81,232 | 84,123 | 103.6% |
| Operating profit (millions of yen) | 14,989 | 13,207 | 88.1% |
| Ordinary profit (millions of yen) | 15,617 | 13,534 | 86.7% |
| Profit attributable to owners of parent (millions of yen) | 10,358 | 10,130 | 97.8% |
| EBITDA (millions of yen) | 19,757 | 18,069 | 91.5% |
| ROE | 9.2% | 8.4% | ▲0.8pt |
Results by Category
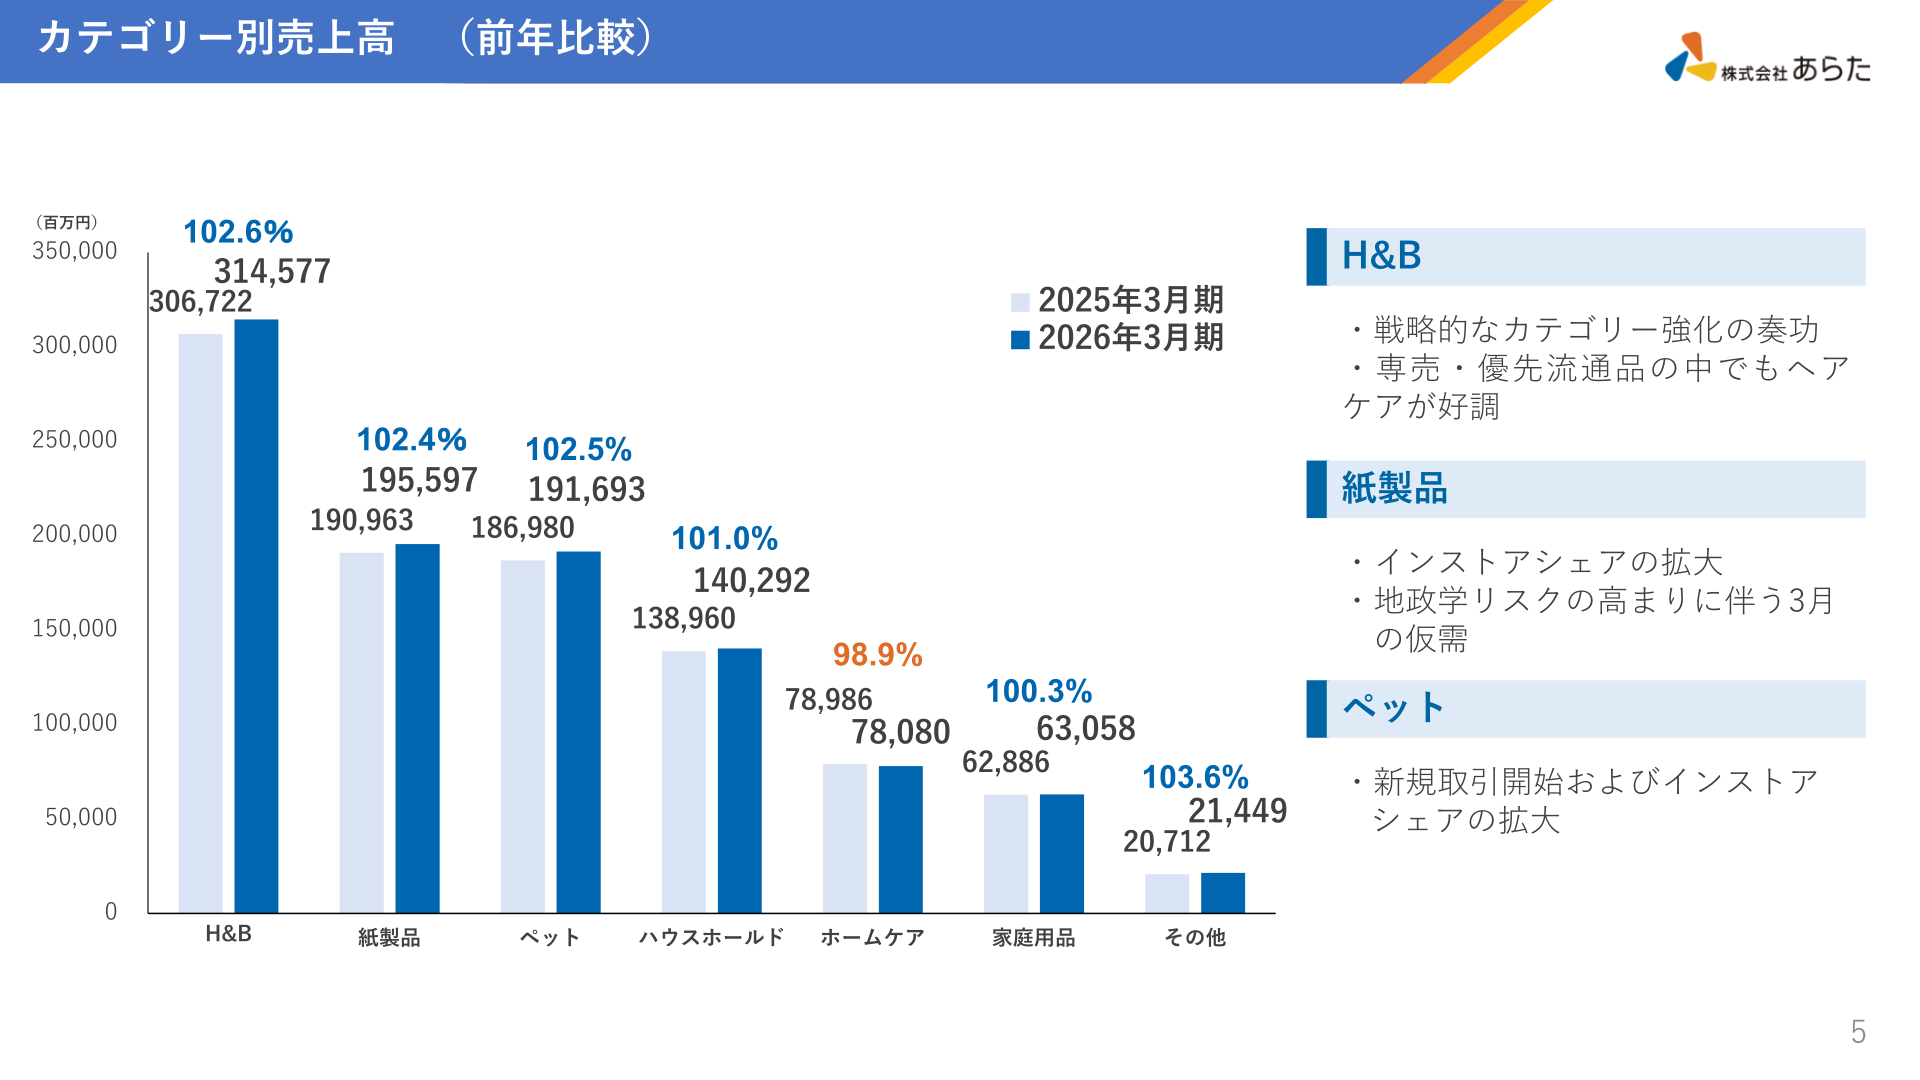
In net sales by category (compared with the previous year), the H&B, paper products and pet categories grew. In H&B, strategic reinforcement of the category paid off and, among exclusive and priority-distribution items, hair care performed strongly. Paper products were lifted by an expansion of in-store share and by provisional demand in March that accompanied heightened geopolitical risk. Pet benefited from newly started transactions and an expansion of in-store share.
| Category | FY ended March 2025 (millions of yen) | FY ended March 2026 (millions of yen) |
|---|---|---|
| H&B | 306,722 | 314,577 |
| Paper products | 190,963 | 195,597 |
| Pets | 186,980 | 191,693 |
| Household | 138,960 | 140,292 |
| Home care | 78,986 | 78,080 |
| Household goods | 62,886 | 63,058 |
| Others | 20,712 | 21,449 |
Full-Year Forecast
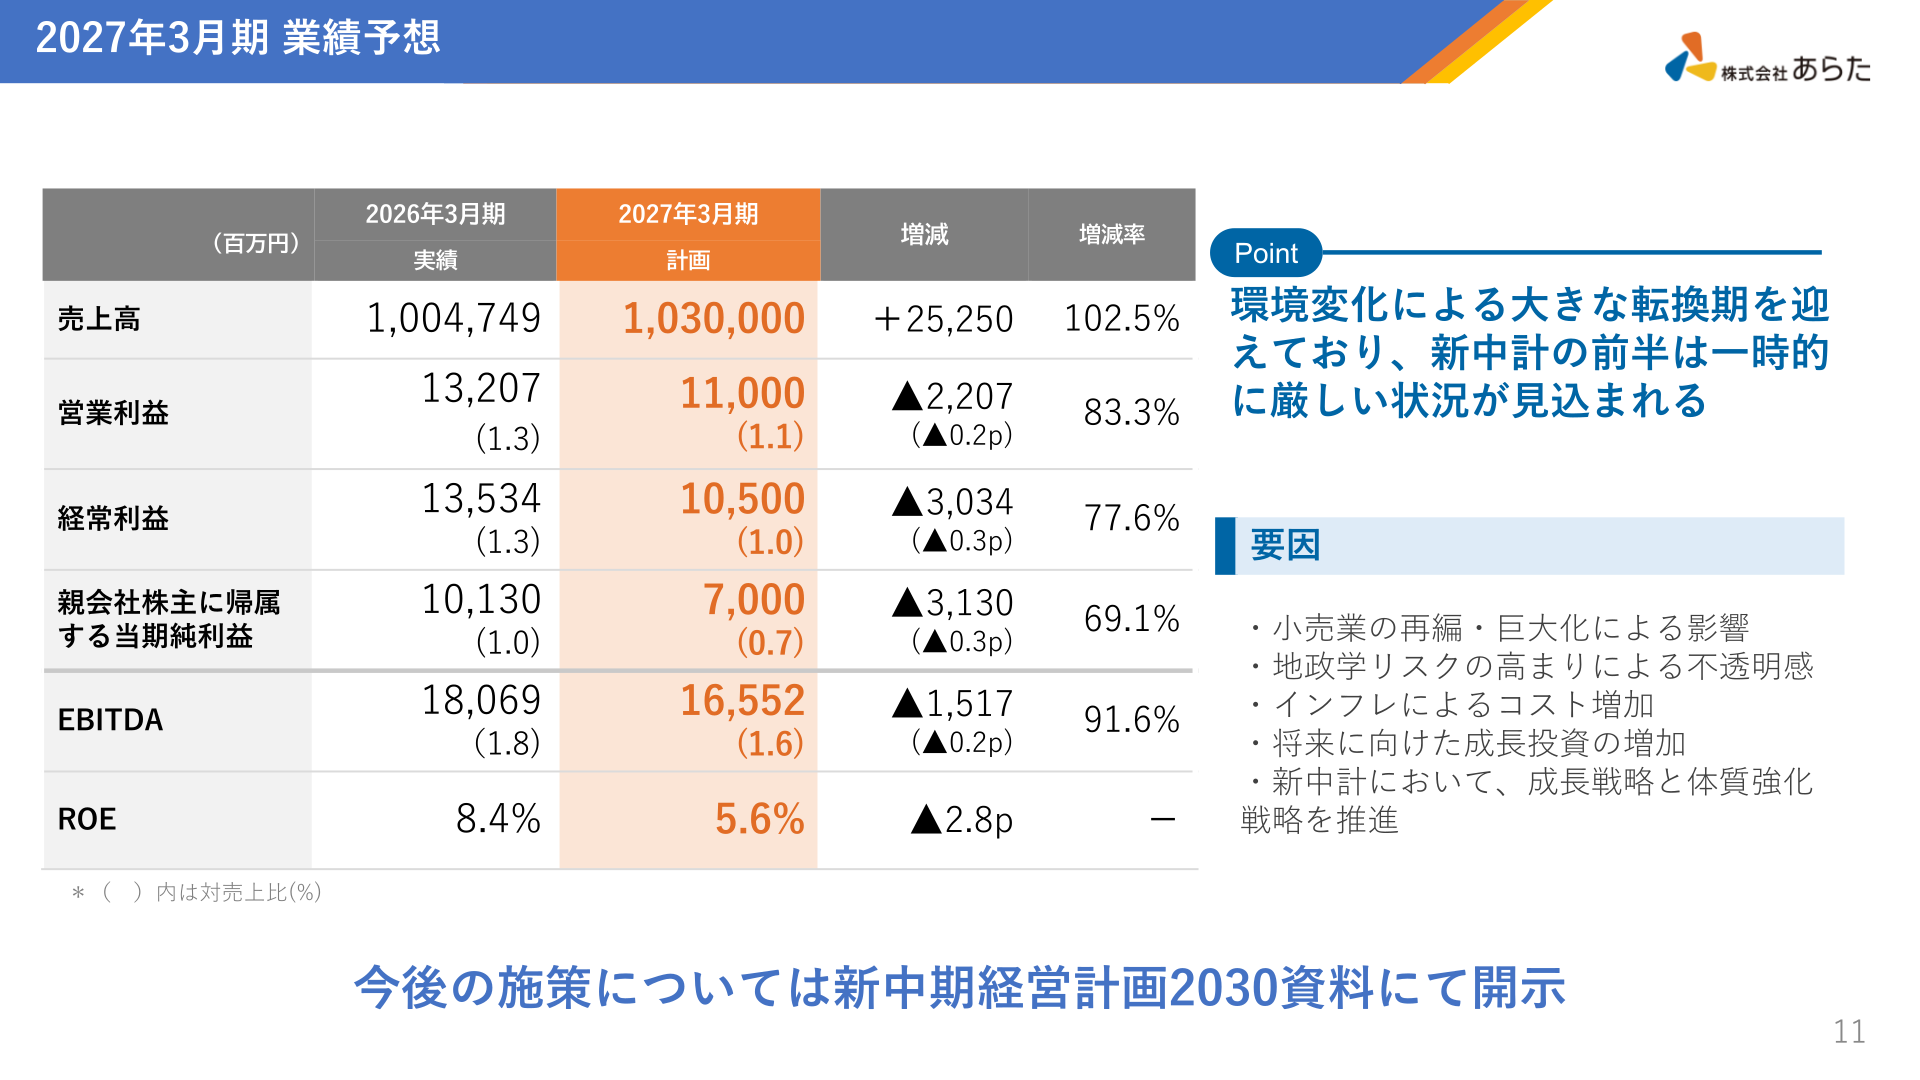
For the fiscal year ending March 2027, taking into account the impact of restructuring and consolidation among retailers, uncertainty from heightened geopolitical risk, inflation-driven cost increases and an increase in growth investment for the future, the company expects net sales of 1,030,000 million yen (102.5% of the previous year), but forecasts declines at every profit level: operating profit of 11,000 million yen (83.3%), ordinary profit of 10,500 million yen (77.6%), profit attributable to owners of parent of 7,000 million yen (69.1%), EBITDA of 16,552 million yen (91.6%) and ROE of 5.6% (down 2.8pt year on year). The company says conditions are expected to be temporarily difficult in the first half of the new medium-term plan, and that its future measures will be disclosed in the materials for the new Medium-Term Management Plan 2030.
| Item | FY ended March 2026 (Actual) | FY ending March 2027 (Plan) | Change rate |
|---|---|---|---|
| Net sales (millions of yen) | 1,004,749 | 1,030,000 | 102.5% |
| Operating profit (millions of yen) | 13,207 | 11,000 | 83.3% |
| Ordinary profit (millions of yen) | 13,534 | 10,500 | 77.6% |
| Profit attributable to owners of parent (millions of yen) | 10,130 | 7,000 | 69.1% |
| EBITDA (millions of yen) | 18,069 | 16,552 | 91.6% |
| ROE | 8.4% | 5.6% | ▲2.8pt |
Shareholder Returns
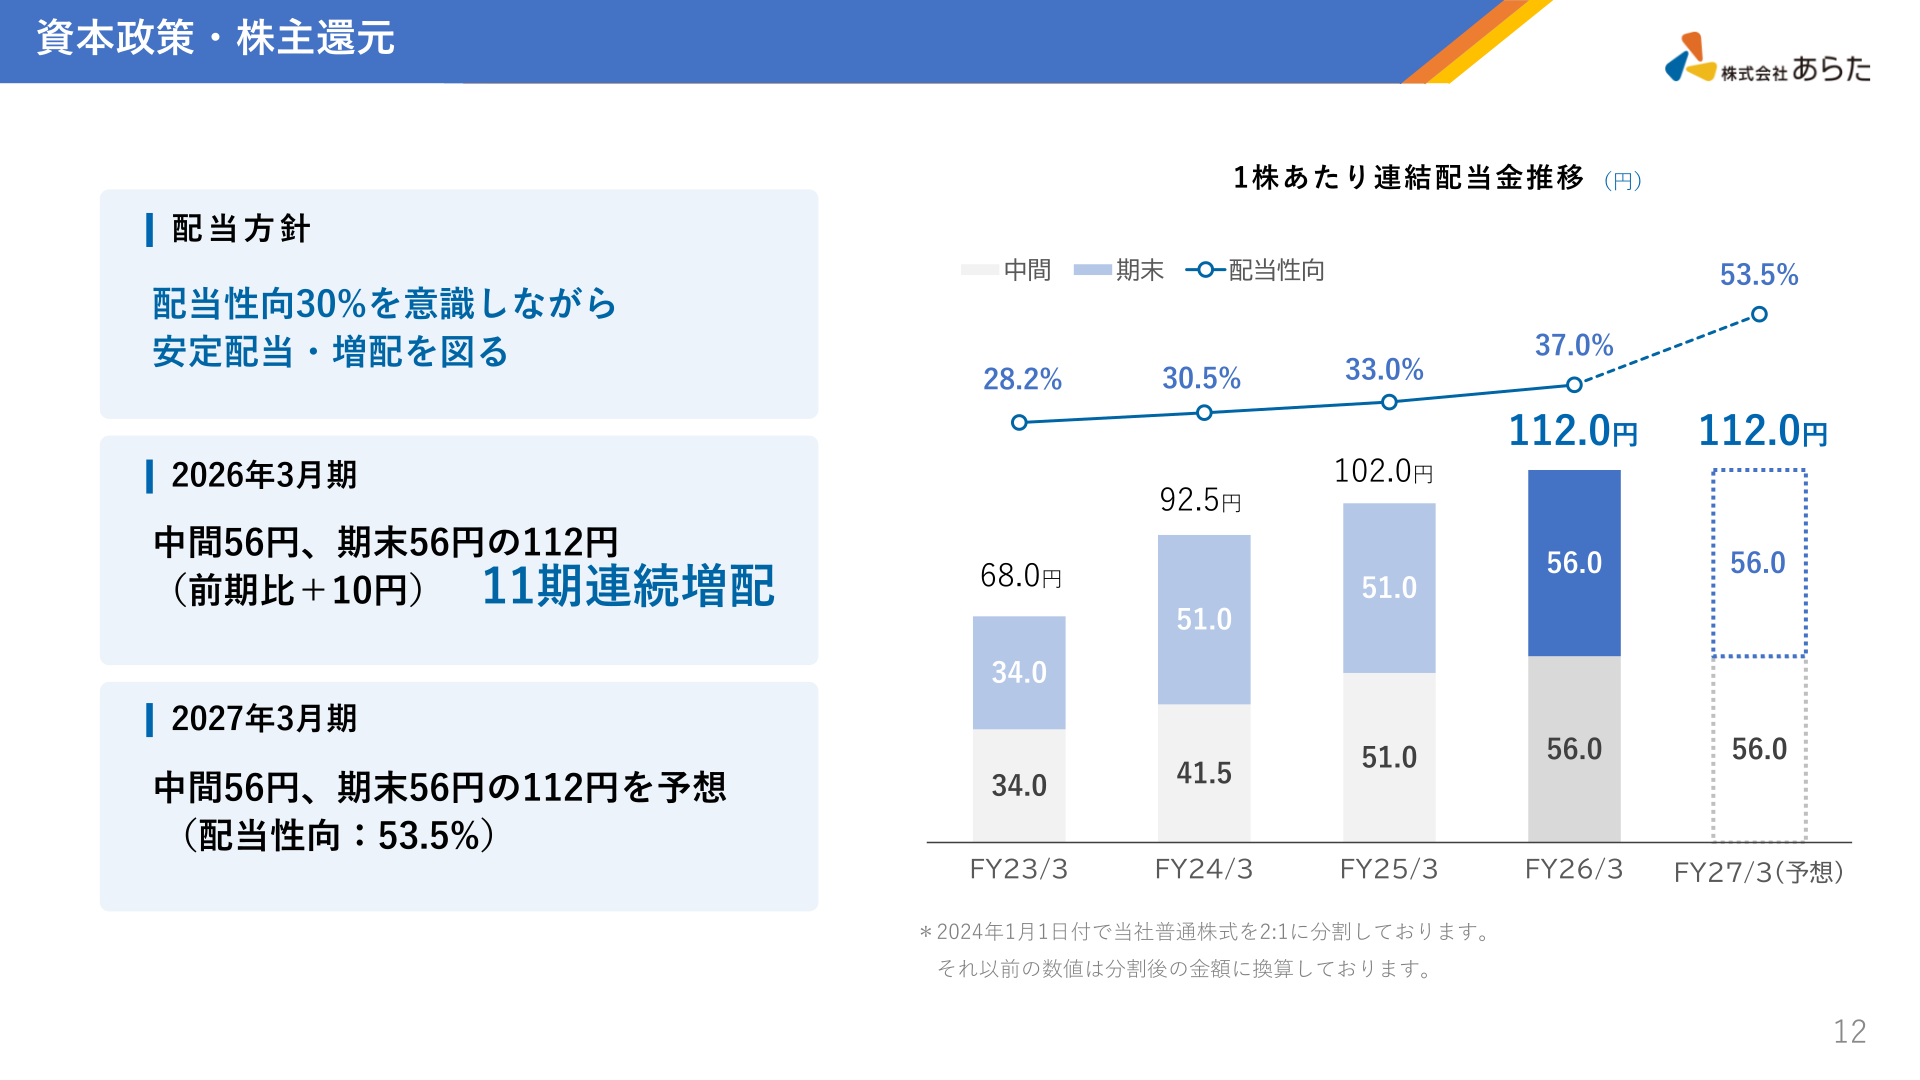
The dividend policy is to aim for a stable dividend and dividend increases while keeping a payout ratio of 30% in mind. For the fiscal year ended March 2026 the dividend was 56 yen at the interim and 56 yen at year-end, for an annual dividend of 112 yen (up 10 yen from the previous year), marking the 11th consecutive year of dividend increases. For the fiscal year ending March 2027 the company forecasts 56 yen at the interim and 56 yen at year-end, for an annual dividend of 112 yen (payout ratio of 53.5%). The company also notes that its common shares were split 2-for-1 effective January 1, 2024, and that figures prior to that date are restated on a post-split basis.
| Period | Interim dividend | Year-end dividend | Annual dividend | Payout ratio |
|---|---|---|---|---|
| FY23/3 | 34.0 yen | 34.0 yen | 68.0 yen | 28.2% |
| FY24/3 | 41.5 yen | 51.0 yen | 92.5 yen | 30.5% |
| FY25/3 | 51.0 yen | 51.0 yen | 102.0 yen | 33.0% |
| FY26/3 | 56.0 yen | 56.0 yen | 112.0 yen | 37.0% |
| FY27/3 (Forecast) | 56.0 yen | 56.0 yen | 112.0 yen | 53.5% |
Medium-Term Management Plan / Topics
Recognizing that it is facing a major turning point brought about by changes in its operating environment, the company says that under its new medium-term management plan it will return to the essence of the wholesale business in order to improve profits and will strengthen both its offensive and defensive footing. It states that specific future measures will be disclosed in the materials for the new Medium-Term Management Plan 2030.
This article is an analysis based on publicly available information and is not a recommendation to buy or sell any specific securities. Investment decisions are your own responsibility.
















