
This article is based on publicly available IR materials and is not a recommendation to buy or sell any specific securities.
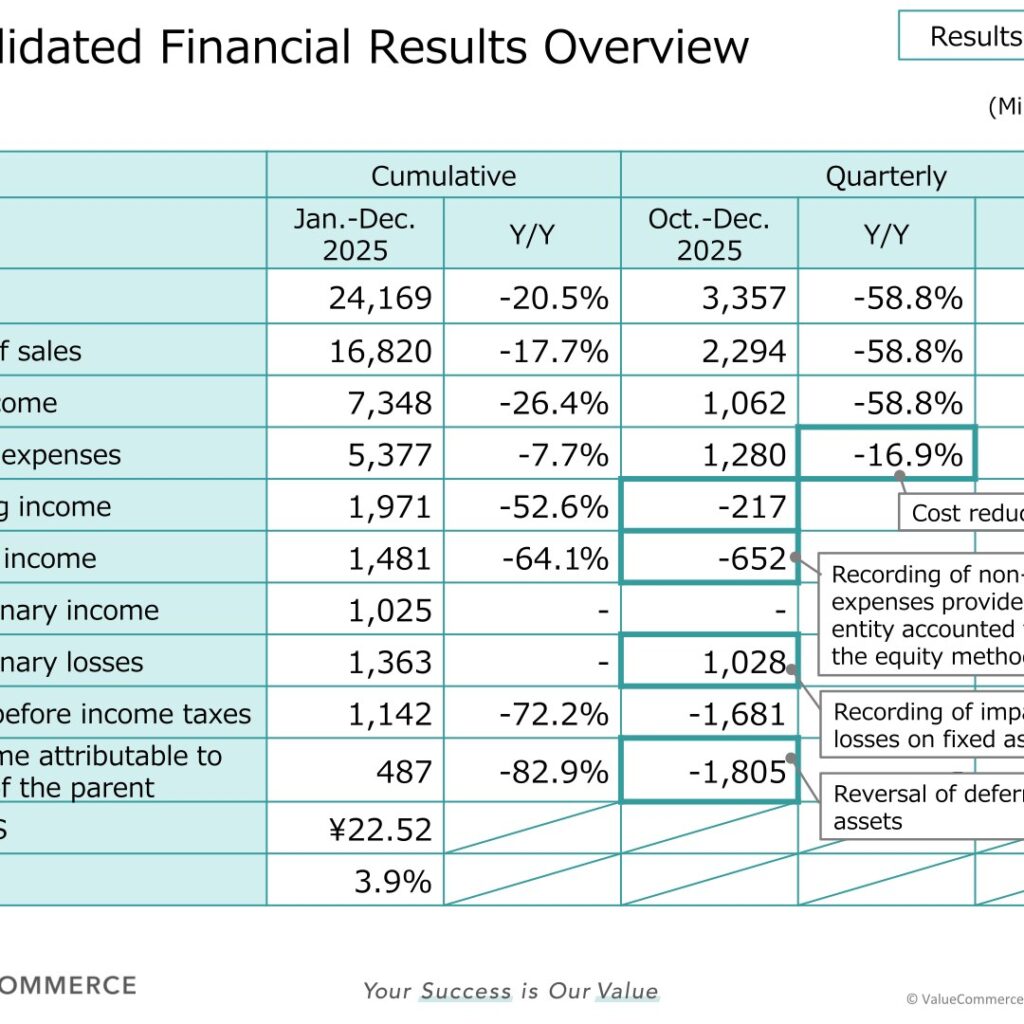
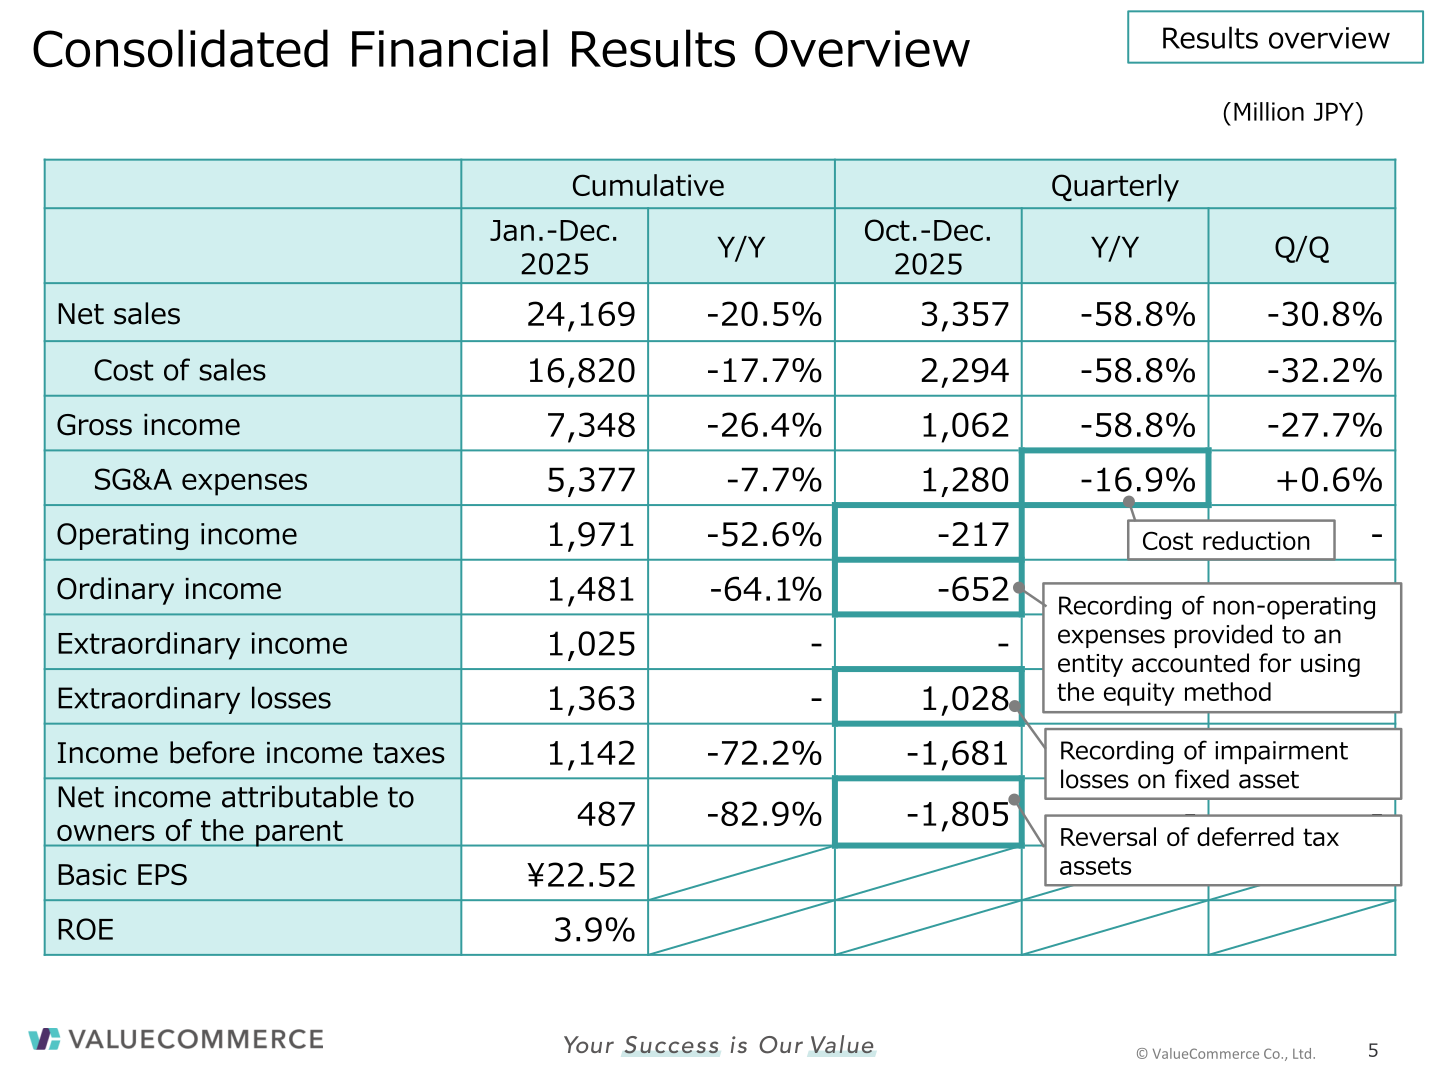
ValueCommerce Co., Ltd. (TSE: 2491) reported consolidated net sales of 24,169 million yen for FY2025 (January–December 2025), down 20.5% year on year, with operating income of 1,971 million yen (-52.6%) and net income attributable to owners of the parent of 487 million yen (-82.9%). The Company states that net sales and operating income exceeded the forecast. The fourth quarter, however, swung into the red — an operating loss of 217 million yen and a net loss of 1,805 million yen — reflecting the termination of the transaction agreements related to “StoreMatch” and “STORE’s R∞” as of the end of July, the recording of impairment losses, and the reversal of deferred tax assets.
Consolidated Results (Full-Year Actual)
Gross income fell 26.4% to 7,348 million yen while SG&A expenses declined 7.7% to 5,377 million yen on cost reductions. Ordinary income of 1,481 million yen (-64.1%) reflects non-operating expenses provided to an entity accounted for using the equity method. Extraordinary income of 1,025 million yen and extraordinary losses of 1,363 million yen were recorded for the full year, leaving income before income taxes at 1,142 million yen (-72.2%). Basic EPS was ¥22.52 and ROE was 3.9%. The Company notes that the impairment losses, the reversal of deferred tax assets and the related forecast revision were disclosed in “Notice of Recording of Extraordinary Losses and Non-operating Expenses, Reversal of Deferred Tax Assets, and Revision of Earnings Forecasts for FY2025” released on January 26, 2026.
| Item (Million JPY) | Jan.-Dec. 2025 | Y/Y | Oct.-Dec. 2025 | Y/Y |
|---|---|---|---|---|
| Net sales | 24,169 | -20.5% | 3,357 | -58.8% |
| Cost of sales | 16,820 | -17.7% | 2,294 | -58.8% |
| Gross income | 7,348 | -26.4% | 1,062 | -58.8% |
| SG&A expenses | 5,377 | -7.7% | 1,280 | -16.9% |
| Operating income | 1,971 | -52.6% | -217 | – |
| EBITDA (*) | 2,363 | -48.6% | -134 | – |
| Ordinary income | 1,481 | -64.1% | -652 | – |
| Extraordinary income | 1,025 | – | – | – |
| Extraordinary losses | 1,363 | – | 1,028 | – |
| Income before income taxes | 1,142 | -72.2% | -1,681 | – |
| Net income attributable to owners of the parent | 487 | -82.9% | -1,805 | – |
| Basic EPS | ¥22.52 | – | – | – |
| ROE | 3.9% | – | – | – |
(*) EBITDA = Operating income + Depreciation and amortization + Amortization of goodwill, as defined in the presentation.
On the balance sheet, total assets decreased 3,449 million yen to 16,142 million yen as of December 31, 2025, with current assets down 2,597 million yen to 15,045 million yen (cash and deposits of 11,026 million yen, a decrease of 748 million yen) and non-current assets down 852 million yen to 1,096 million yen. Current liabilities fell 2,849 million yen to 3,821 million yen and net assets declined 679 million yen to 12,181 million yen, reflecting net income of 487 million yen and cash dividends paid of 1,235 million yen. Operating cash flows were 1,923 million yen against 3,461 million yen a year earlier, investing cash flows were -1,443 million yen, and free cash flows narrowed to 480 million yen from 2,753 million yen. The ending cash balance was 11,026 million yen.
Segment Results
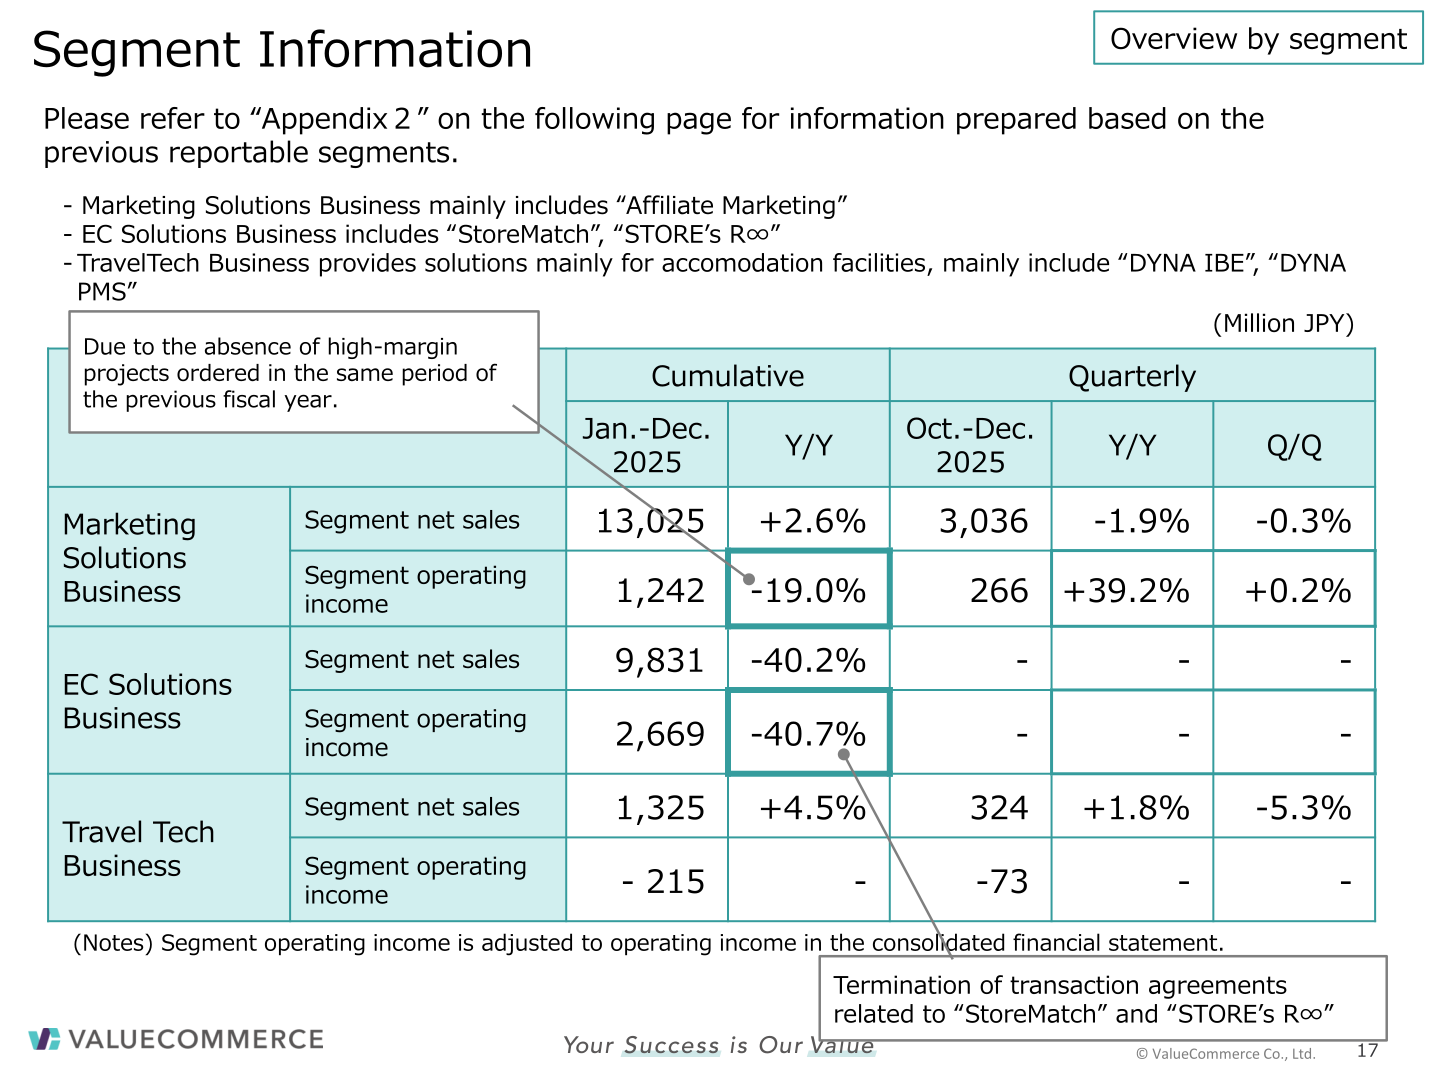
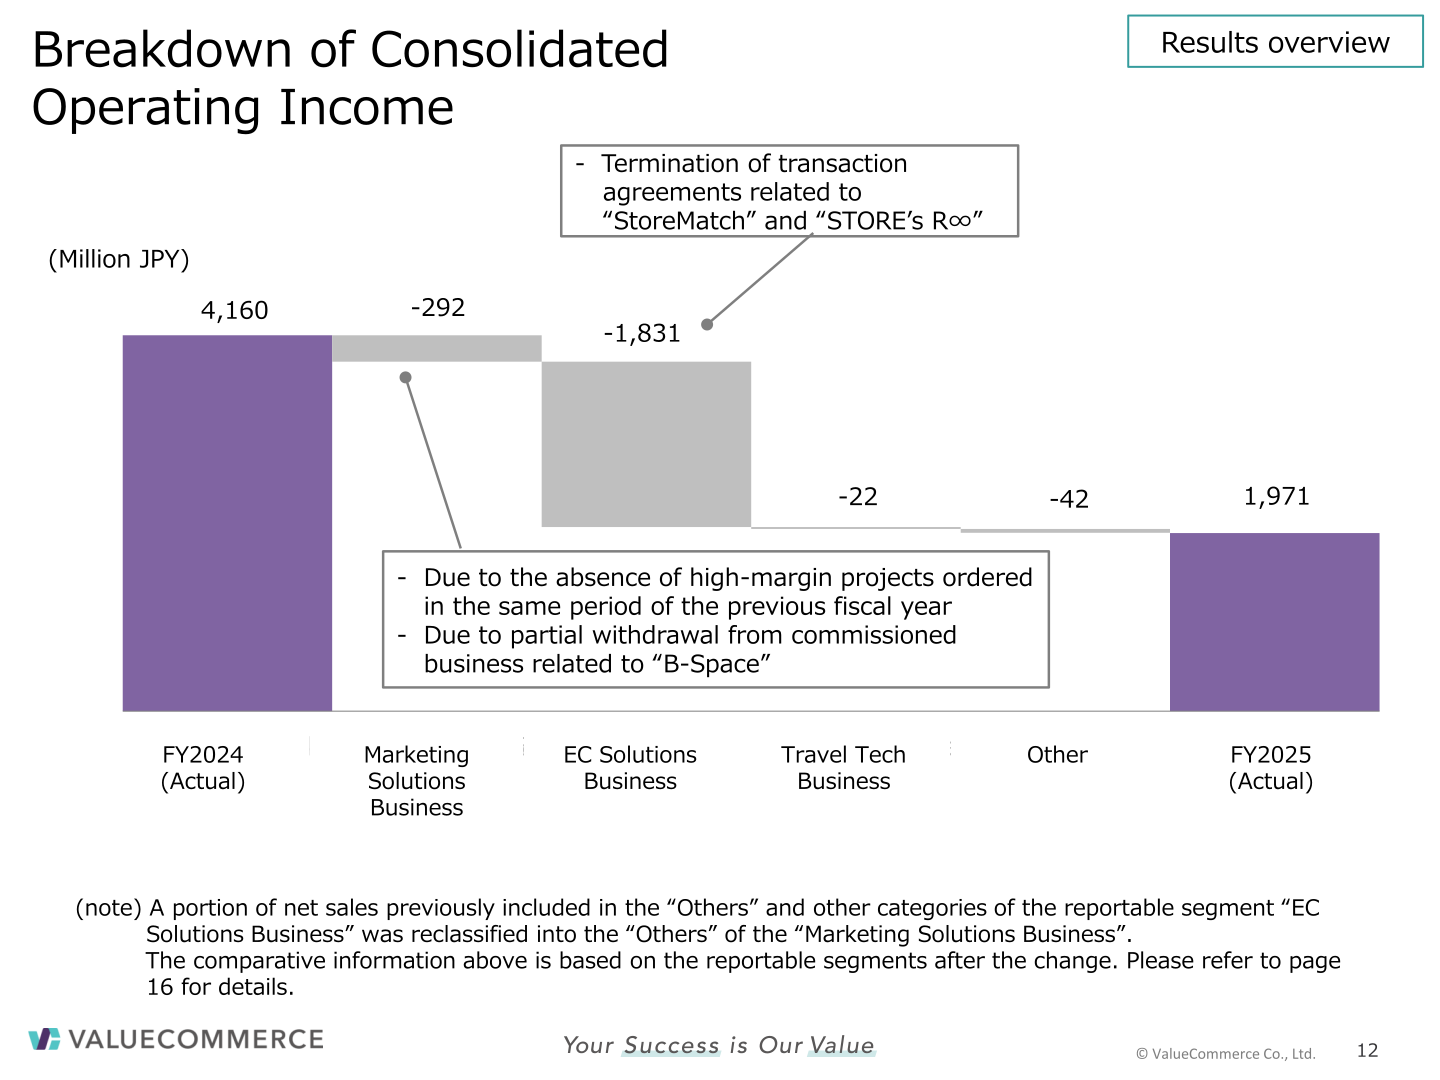
Following the Group’s change in business management classification effective April 1, 2025, a portion of net sales previously included in the “Others” and other categories of the “EC Solutions Business” reportable segment was reclassified into the “Others” of the “Marketing Solutions Business,” and prior-year comparatives are presented after the change. Marketing Solutions Business net sales rose 2.6% to 13,025 million yen while segment operating income fell 19.0% to 1,242 million yen, attributed to the absence of high-margin projects ordered in the same period of the previous fiscal year. EC Solutions Business net sales dropped 40.2% to 9,831 million yen on the termination of the StoreMatch and STORE’s R∞ agreements, with segment operating income of 2,669 million yen (-40.7%). Travel Tech Business net sales grew 4.5% to 1,325 million yen with a segment operating loss of 215 million yen.
| Segment (Million JPY) | Metric | Jan.-Dec. 2025 | Y/Y | Oct.-Dec. 2025 | Y/Y |
|---|---|---|---|---|---|
| Marketing Solutions Business | Segment net sales | 13,025 | +2.6% | 3,036 | -1.9% |
| Marketing Solutions Business | Segment operating income | 1,242 | -19.0% | 266 | +39.2% |
| EC Solutions Business | Segment net sales | 9,831 | -40.2% | – | – |
| EC Solutions Business | Segment operating income | 2,669 | -40.7% | – | – |
| Travel Tech Business | Segment net sales | 1,325 | +4.5% | 324 | +1.8% |
| Travel Tech Business | Segment operating income | – 215 | – | -73 | – |
By service, Affiliate Marketing net sales increased 3.1% to 12,545 million yen but gross income fell 8.4% to 3,459 million yen. StoreMatch net sales were 8,458 million yen (-39.5%) with gross income of 1,704 million yen (-39.9%), and STORE’s R∞ net sales and gross income were both 1,373 million yen (-44.7%). Travel Tech net sales were 1,325 million yen (+4.5%) with gross income of 1,171 million yen (+1.2%). Within Affiliate Marketing, the Company notes that the Shopping category remained solid throughout the year while the Finance category slowed from the second half.
| Service (Million JPY) | Metric | Jan.-Dec. 2025 | Y/Y |
|---|---|---|---|
| Affiliate marketing | Net sales | 12,545 | +3.1% |
| Affiliate marketing | Gross income | 3,459 | -8.4% |
| StoreMatch | Net sales | 8,458 | -39.5% |
| StoreMatch | Gross income | 1,704 | -39.9% |
| STORE’s R∞ | Net sales | 1,373 | -44.7% |
| STORE’s R∞ | Gross income | 1,373 | -44.7% |
| Travel Tech | Net sales | 1,325 | +4.5% |
| Travel Tech | Gross income | 1,171 | +1.2% |
Next-Year Forecast
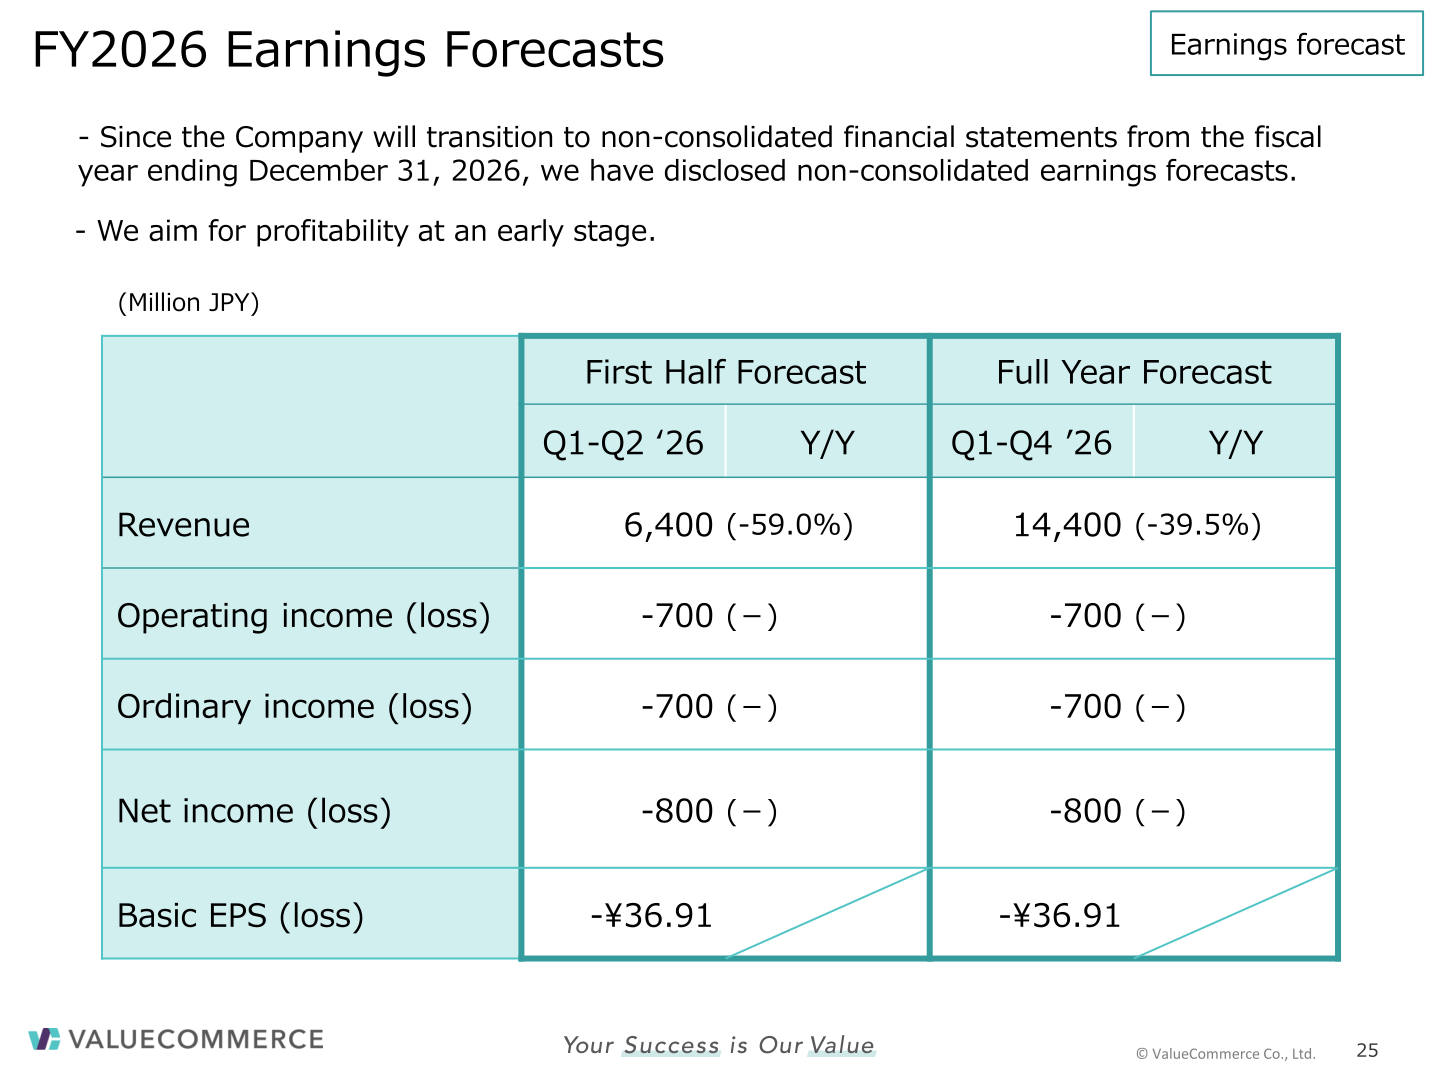
Because the Company will transition to non-consolidated financial statements from the fiscal year ending December 31, 2026, the guidance is disclosed on a non-consolidated basis. For the full year, ValueCommerce forecasts revenue of 14,400 million yen (-39.5%), an operating loss of 700 million yen, an ordinary loss of 700 million yen and a net loss of 800 million yen, equivalent to basic EPS of -¥36.91. First-half guidance is revenue of 6,400 million yen (-59.0%) with an operating loss, ordinary loss and net loss of 700 million yen, 700 million yen and 800 million yen respectively. The Company states that it aims for profitability at an early stage.
| Item (Million JPY) | First Half Forecast (Q1-Q2 ’26) | Y/Y | Full Year Forecast (Q1-Q4 ’26) | Y/Y |
|---|---|---|---|---|
| Revenue | 6,400 | (-59.0%) | 14,400 | (-39.5%) |
| Operating income (loss) | -700 | (-) | -700 | (-) |
| Ordinary income (loss) | -700 | (-) | -700 | (-) |
| Net income (loss) | -800 | (-) | -800 | (-) |
| Basic EPS (loss) | -¥36.91 | – | -¥36.91 | – |
On the outlook, the Company says that amid a maturing market and simultaneous changes in consumer purchasing behavior, significant growth in existing businesses is difficult to expect, and that a challenging business environment is anticipated to continue due in part to the termination of the transaction contracts related to StoreMatch and STORE’s R∞. Significant cost reductions have already been implemented on a company-wide basis starting from the current fiscal year, and the Company will promote strategic investments in areas that can serve as new pillars of revenue in line with its Mid-term Strategy.
Shareholder Returns
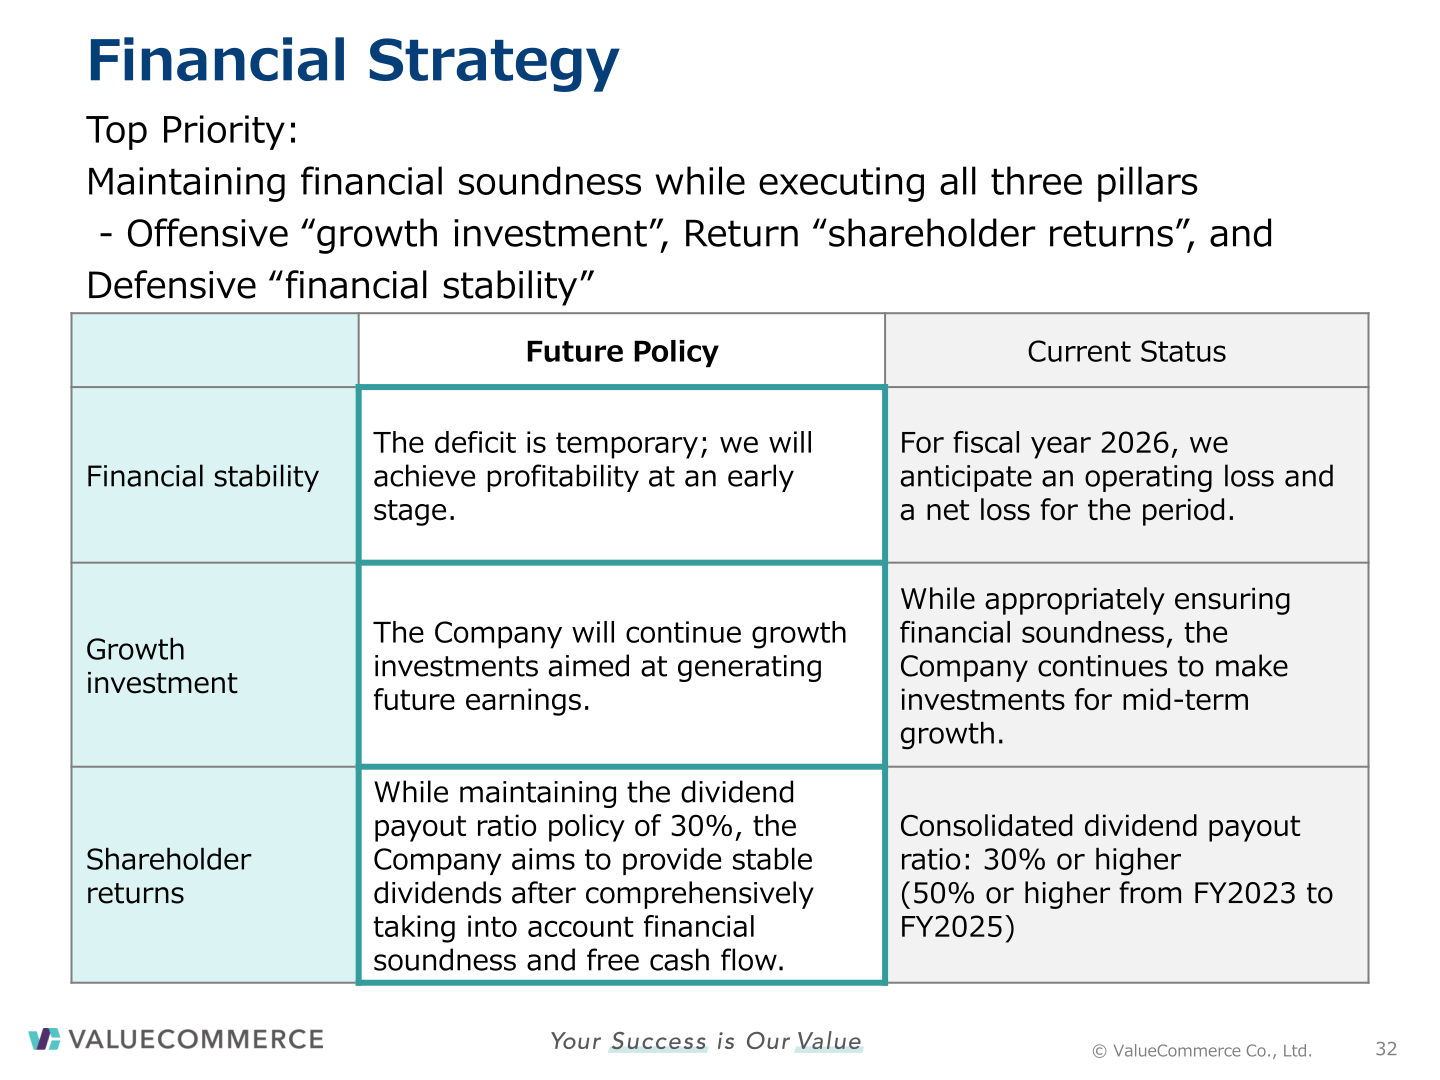
For FY2026 the Company forecasts an interim dividend of ¥8.00 and a year-end dividend of ¥8.00, for a total of ¥16.00 per share; the payout ratio is shown as “-” in the forecast. ValueCommerce states that while maintaining the dividend payout ratio policy of 30%, it aims to provide stable dividends after comprehensively taking into account financial soundness and free cash flow. The materials describe the current status of the consolidated dividend payout ratio as 30% or higher (50% or higher from FY2023 to FY2025).
| Dividends per Share (FY2026 Forecast) | Amount |
|---|---|
| Interim Dividend | ¥8.00 (forecast) |
| Year-end Dividend | ¥8.00 (forecast) |
| Total | ¥16.00 (forecast) |
| Payout Ratio | – (forecast) |
Mid-term Strategy
Alongside the results, ValueCommerce presented a Mid-term Strategy dated January 30, 2026. In the Marketing Solutions Business, the direction is “Redefining Demand Creation through Narrative Marketing” and a shift “from an ‘Advertising Company’ to a ‘Commerce Architect’,” moving beyond conventional performance marketing toward contextual demand creation. In the Travel Tech Business, the direction is “Redefining Demand Fulfillment with AX at the Core” and a shift “from a ‘SaaS Vendor’ to a ‘Platform that Optimizes Experiential Value’,” where AX refers to AI Transformation. By integrating both businesses the Company aims to realize a “new value creation ecosystem” enabling cross-functional utilization of customer touchpoints and data, first establishing an integrated model in the travel domain before expanding to other industries.
On financial strategy, the Company frames three pillars — offensive “growth investment”, return “shareholder returns” and defensive “financial stability” — with maintaining financial soundness as the top priority. It describes the deficit as temporary and targets profitability at an early stage, while continuing growth investments aimed at generating future earnings. For fiscal year 2026 it anticipates an operating loss and a net loss for the period.
This article is an analysis based on publicly available information and is not a recommendation to buy or sell any specific securities. Investment decisions are your own responsibility.
















