
This article is based on publicly available IR materials and is not a recommendation to buy or sell any specific securities.
CORE CORPORATION posted higher net sales and higher profits for the fiscal year ended March 31, 2026, with the company stating that both revenue and profit marked new record levels. Net sales came to 26,532 millions of yen (107.9% year on year), operating profit to 3,819 millions of yen (120.3%), ordinary profit to 3,921 millions of yen (120.0%) and profit attributable to owners of parent to 2,879 millions of yen (128.4%). The company attributes the gains to growth across its solution businesses, led by IoT(AI) Solutions, Media Solutions, Energy Solutions and public-sector system development. Note: the source material labels this completed fiscal year as the “fiscal year ending March 2026”; on this site it is classified as FY2025, and the labels used in the text and tables below follow the material.
Consolidated Results (Full-Year Actual)
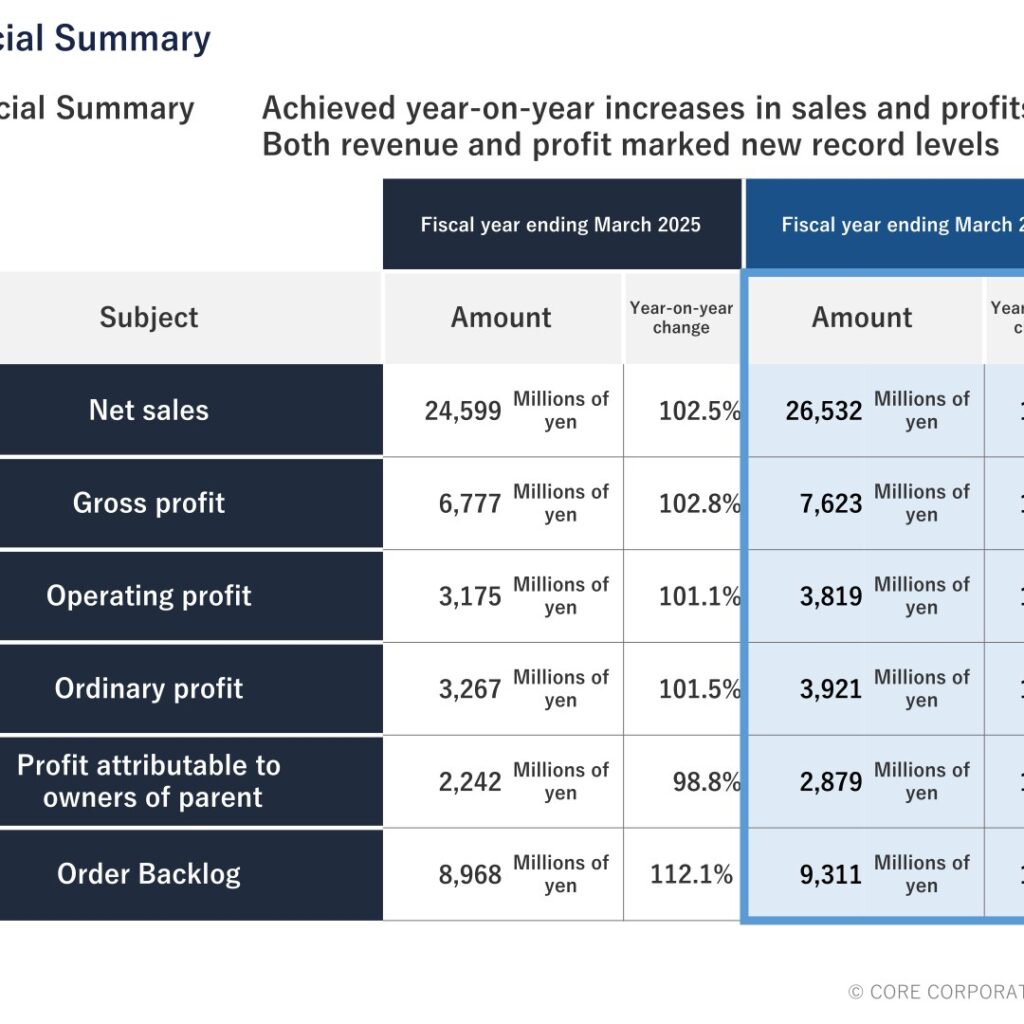
The supplementary materials summarize consolidated results as shown below. Amounts are in millions of yen as presented in the material, and the “Year-on-year change” figures are the ratios to the previous fiscal year given in the material. The company’s headline comment is: “Achieved year-on-year increases in sales and profits / Both revenue and profit marked new record levels.”
| Item | FY ending March 2025 | Year-on-year change | FY ending March 2026 | Year-on-year change |
|---|---|---|---|---|
| Net sales | 24,599 | 102.5% | 26,532 | 107.9% |
| Gross profit | 6,777 | 102.8% | 7,623 | 112.5% |
| Operating profit | 3,175 | 101.1% | 3,819 | 120.3% |
| Ordinary profit | 3,267 | 101.5% | 3,921 | 120.0% |
| Profit attributable to owners of parent | 2,242 | 98.8% | 2,879 | 128.4% |
| Order Backlog | 8,968 | 112.1% | 9,311 | 103.8% |
On a cumulative quarterly basis, net sales progressed at 5,929 millions of yen in the 1st Quarter, 12,315 millions of yen in the Interim Period, 19,326 millions of yen in the 3rd Quarter and 26,532 millions of yen for the Full Year, with operating profit at 685, 1,623, 2,888 and 3,819 millions of yen respectively.
As factors behind the change in net sales (year-on-year change 107.9%), the material cites: Public Sol — solid growth in system development for government offices; Energy Sol — solutions for electric power companies grow; IoT(AI) Sol — growth in IT roll call systems “Cagou IT Tenko” and solutions for the manufacturing industry; Media Sol — video solutions for the broadcasting industry are strong; and solution projects also grew overall in other Sol fields. A negative factor was a decrease in projects for system development for transportation companies. For operating profit (year-on-year change 120.3%), the material notes that growth in Energy Sol led to an overall rise in projects resulting in higher profits, that profits increased due to an increase in overall solution projects including IoT(AI) Sol and Media Sol, and that development work related to semiconductor-related devices and audio equipment is strong.
Segment Results
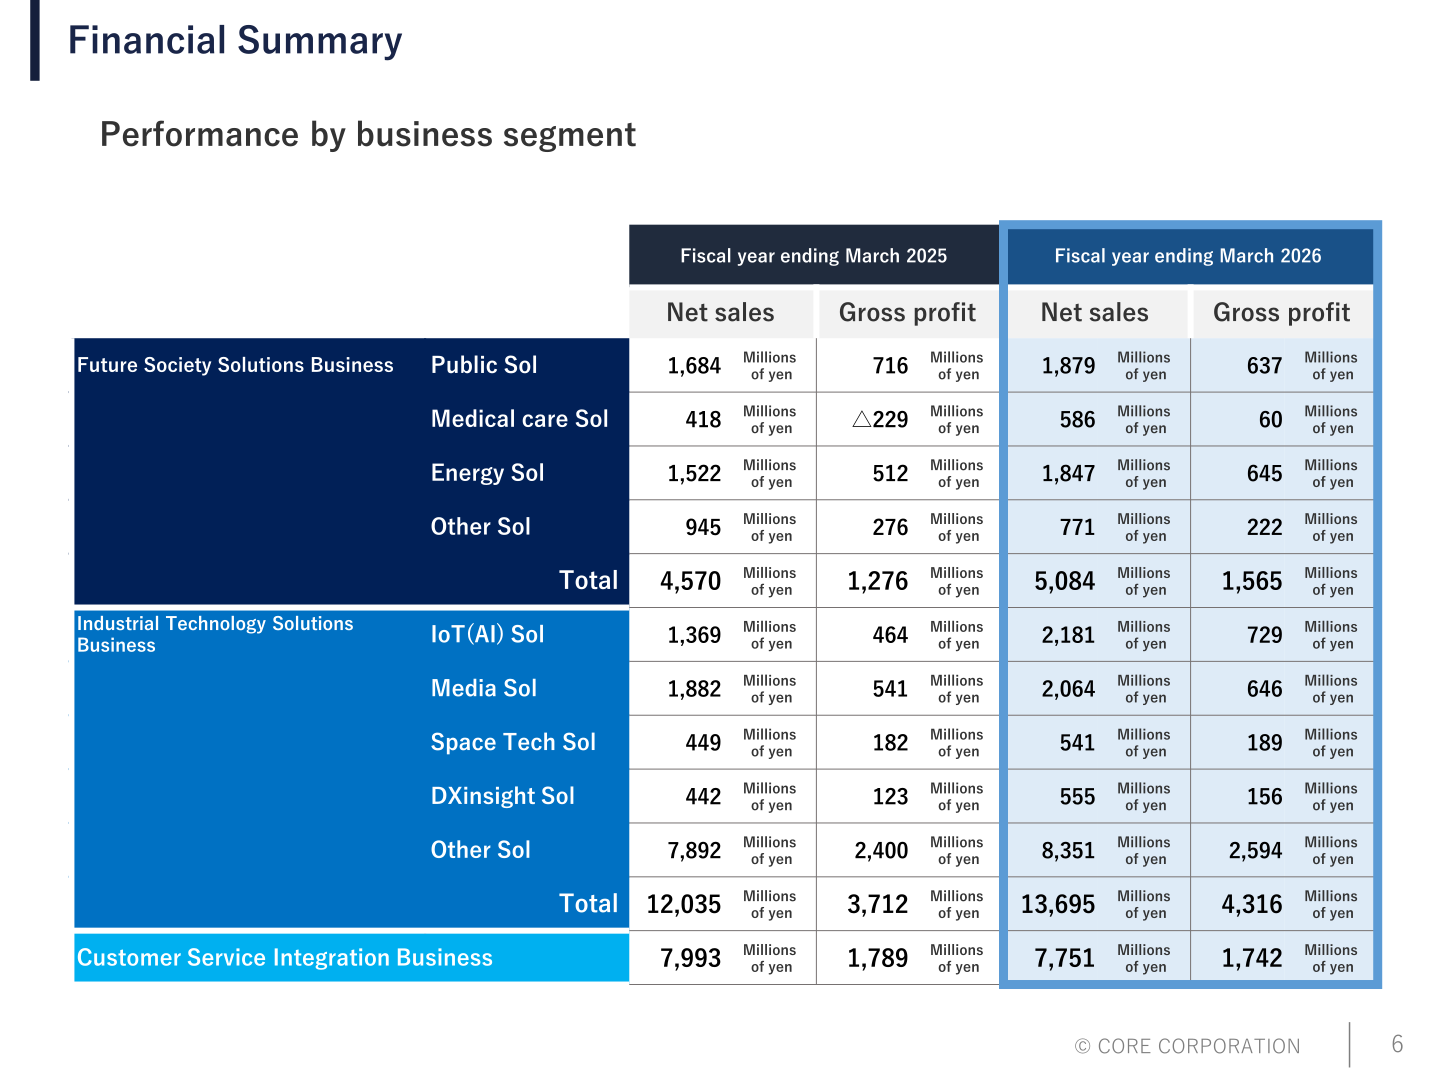
The material breaks out net sales and gross profit by business segment and by solution field. Amounts are in millions of yen.
| Segment / Solution | FY ending March 2025 Net sales | FY ending March 2025 Gross profit | FY ending March 2026 Net sales | FY ending March 2026 Gross profit |
|---|---|---|---|---|
| Future Society Solutions Business — Public Sol | 1,684 | 716 | 1,879 | 637 |
| Future Society Solutions Business — Medical care Sol | 418 | △229 | 586 | 60 |
| Future Society Solutions Business — Energy Sol | 1,522 | 512 | 1,847 | 645 |
| Future Society Solutions Business — Other Sol | 945 | 276 | 771 | 222 |
| Future Society Solutions Business — Total | 4,570 | 1,276 | 5,084 | 1,565 |
| Industrial Technology Solutions Business — IoT(AI) Sol | 1,369 | 464 | 2,181 | 729 |
| Industrial Technology Solutions Business — Media Sol | 1,882 | 541 | 2,064 | 646 |
| Industrial Technology Solutions Business — Space Tech Sol | 449 | 182 | 541 | 189 |
| Industrial Technology Solutions Business — DXinsight Sol | 442 | 123 | 555 | 156 |
| Industrial Technology Solutions Business — Other Sol | 7,892 | 2,400 | 8,351 | 2,594 |
| Industrial Technology Solutions Business — Total | 12,035 | 3,712 | 13,695 | 4,316 |
| Customer Service Integration Business | 7,993 | 1,789 | 7,751 | 1,742 |
Sales Breakdown
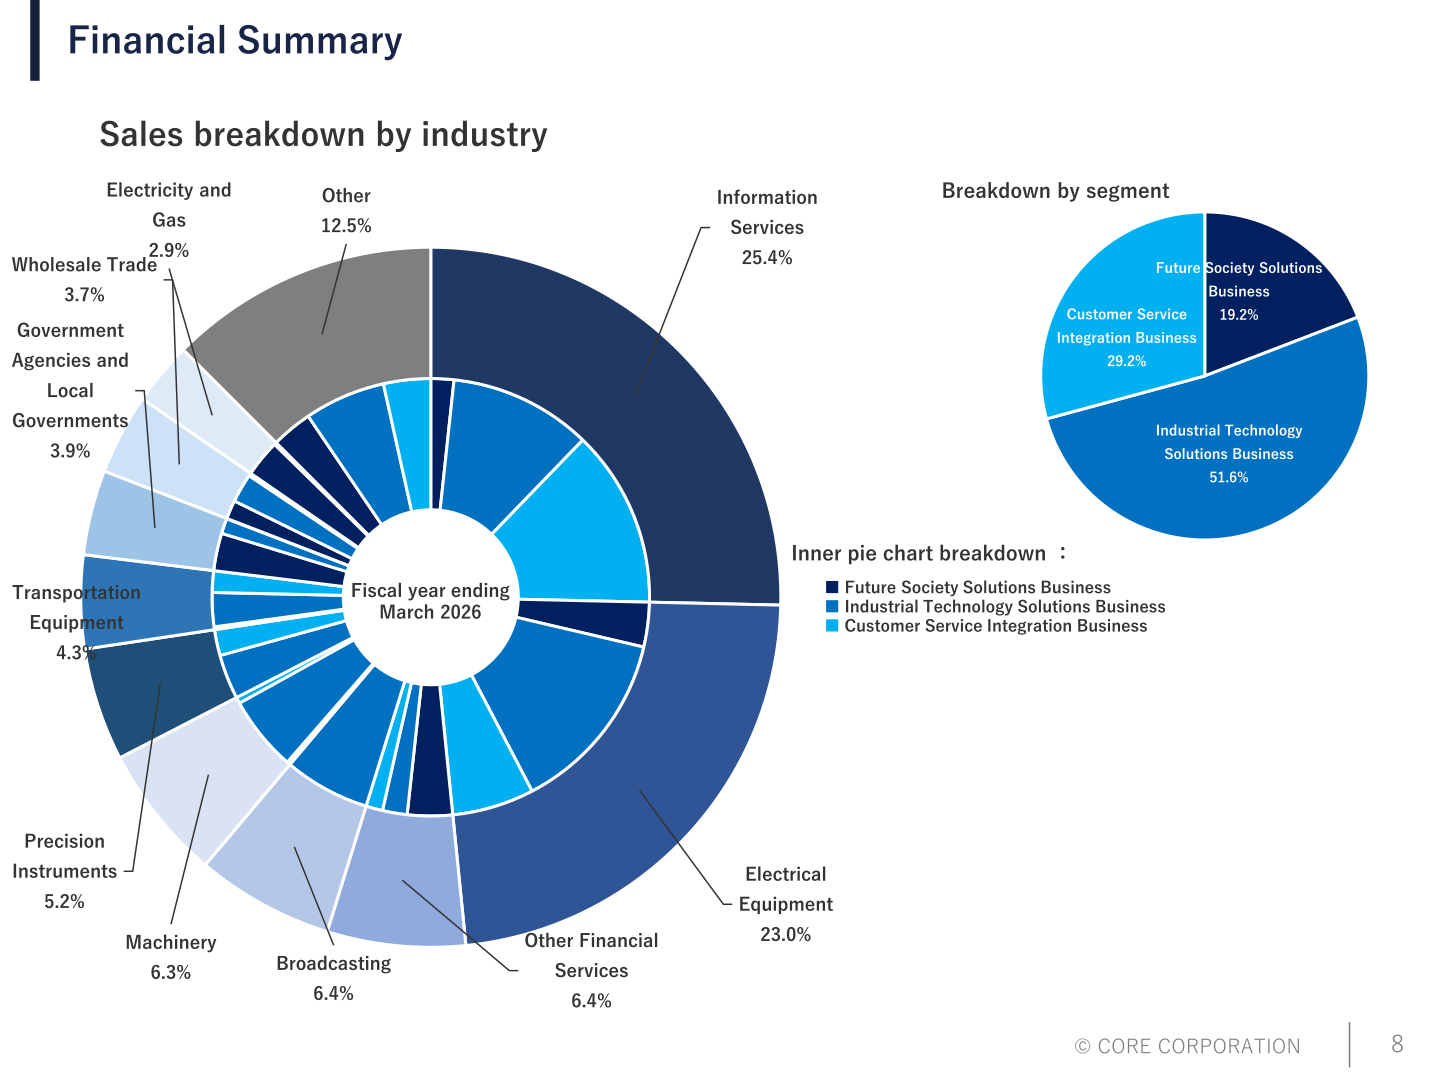
By segment, the fiscal year ending March 2026 sales mix was Future Society Solutions Business 19.2%, Industrial Technology Solutions Business 51.6% and Customer Service Integration Business 29.2%. By customer industry, the breakdown was Information Services 25.4%, Electrical Equipment 23.0%, Other Financial Services 6.4%, Broadcasting 6.4%, Machinery 6.3%, Precision Instruments 5.2%, Transportation Equipment 4.3%, Government Agencies and Local Governments 3.9%, Wholesale Trade 3.7%, Electricity and Gas 2.9% and Other 12.5%.
Consolidated Balance Sheets
Total assets grew to 28,168 millions of yen at the end of the fiscal year ending March 2026, 112.0% of the previous period-end, while net worth rose to 20,709 millions of yen (111.7%). Amounts are in millions of yen.
| Item | FY ending March 2025 | Compared to the end of the previous period | FY ending March 2026 | Compared to the end of the previous period |
|---|---|---|---|---|
| Current assets | 16,386 | 109.4% | 18,347 | 112.0% |
| Fixed assets | 8,771 | 98.4% | 9,821 | 112.0% |
| Total assets | 25,157 | 105.3% | 28,168 | 112.0% |
| Current liabilities | 5,996 | 96.0% | 6,630 | 110.6% |
| Fixed liabilities | 629 | 97.9% | 828 | 131.7% |
| Total liabilities | 6,625 | 96.2% | 7,459 | 112.6% |
| Net worth | 18,532 | 109.0% | 20,709 | 111.7% |
| Total liabilities and net assets | 25,157 | 105.3% | 28,168 | 112.0% |
Shareholder Returns and IR Indicators
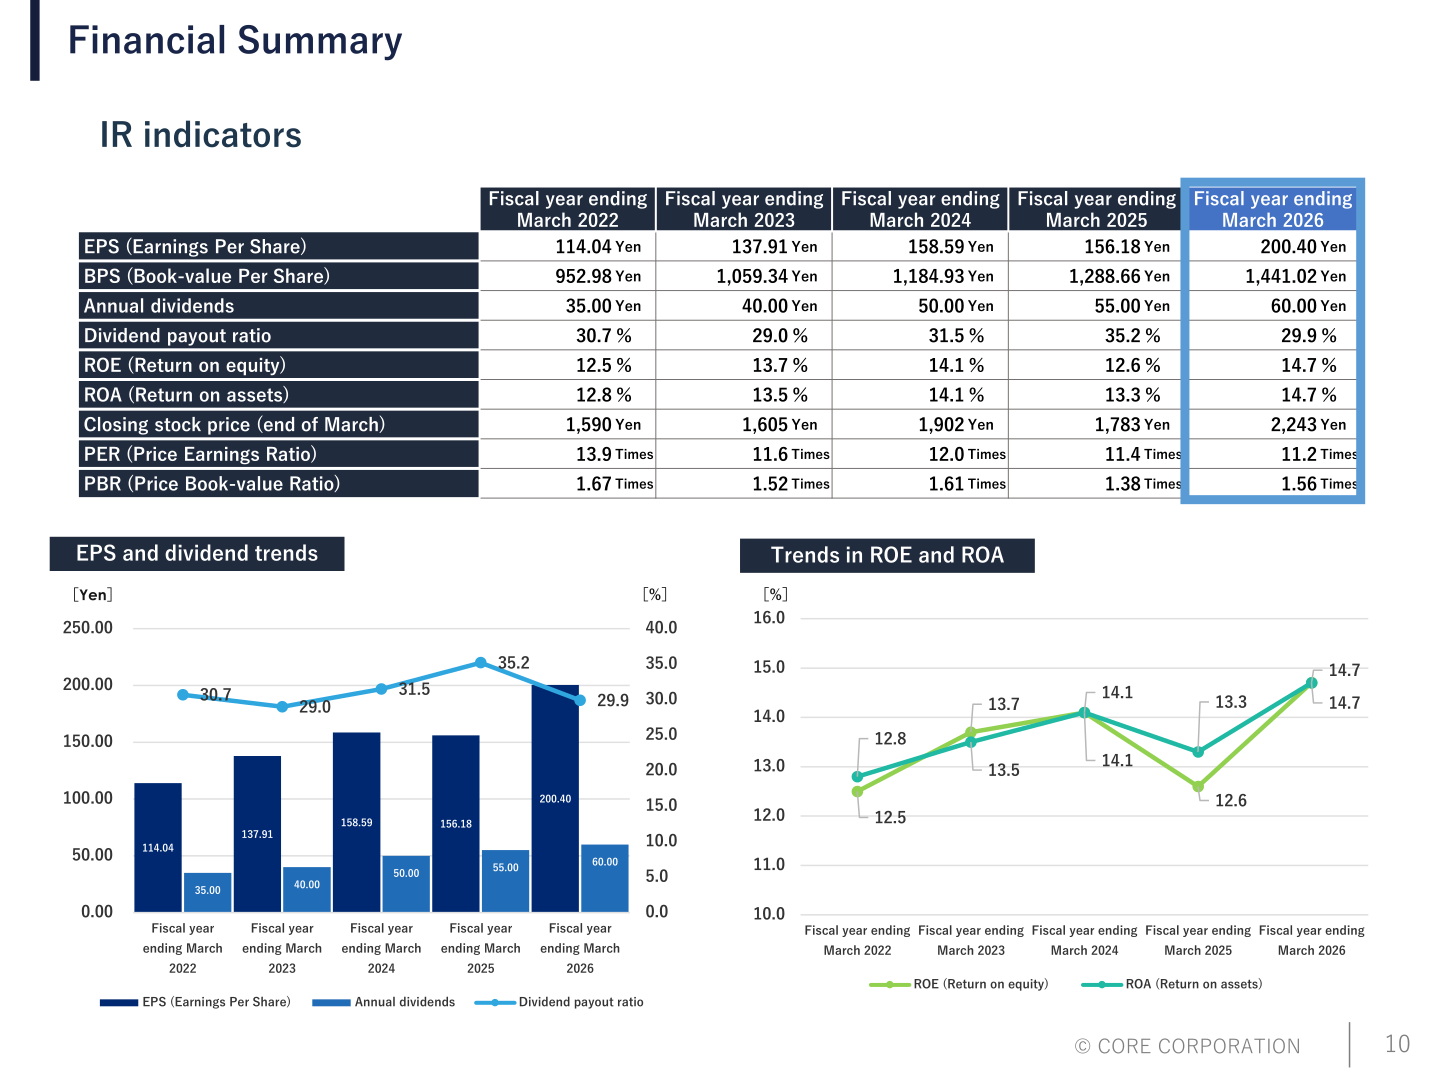
Annual dividends for the fiscal year ending March 2026 were 60.00 Yen, up from 55.00 Yen in the previous fiscal year, with a dividend payout ratio of 29.9%. EPS rose to 200.40 Yen and BPS to 1,441.02 Yen, while ROE and ROA both came to 14.7%.
| Indicator | FY ending March 2022 | FY ending March 2023 | FY ending March 2024 | FY ending March 2025 | FY ending March 2026 |
|---|---|---|---|---|---|
| EPS (Earnings Per Share) | 114.04 Yen | 137.91 Yen | 158.59 Yen | 156.18 Yen | 200.40 Yen |
| BPS (Book-value Per Share) | 952.98 Yen | 1,059.34 Yen | 1,184.93 Yen | 1,288.66 Yen | 1,441.02 Yen |
| Annual dividends | 35.00 Yen | 40.00 Yen | 50.00 Yen | 55.00 Yen | 60.00 Yen |
| Dividend payout ratio | 30.7 % | 29.0 % | 31.5 % | 35.2 % | 29.9 % |
| ROE (Return on equity) | 12.5 % | 13.7 % | 14.1 % | 12.6 % | 14.7 % |
| ROA (Return on assets) | 12.8 % | 13.5 % | 14.1 % | 13.3 % | 14.7 % |
| Closing stock price (end of March) | 1,590 Yen | 1,605 Yen | 1,902 Yen | 1,783 Yen | 2,243 Yen |
| PER (Price Earnings Ratio) | 13.9 Times | 11.6 Times | 12.0 Times | 11.4 Times | 11.2 Times |
| PBR (Price Book-value Ratio) | 1.67 Times | 1.52 Times | 1.61 Times | 1.38 Times | 1.56 Times |
Next-Year Forecast
The supplementary materials do not contain a consolidated earnings forecast for the following fiscal year. This cannot be confirmed from the materials. The material notes only that the plans and earnings forecasts it contains are planned and forecasted by the company based on current information and are subject to change due to various conditions and factors such as future economic trends and market conditions.
Medium-Term Management Plan Track Record
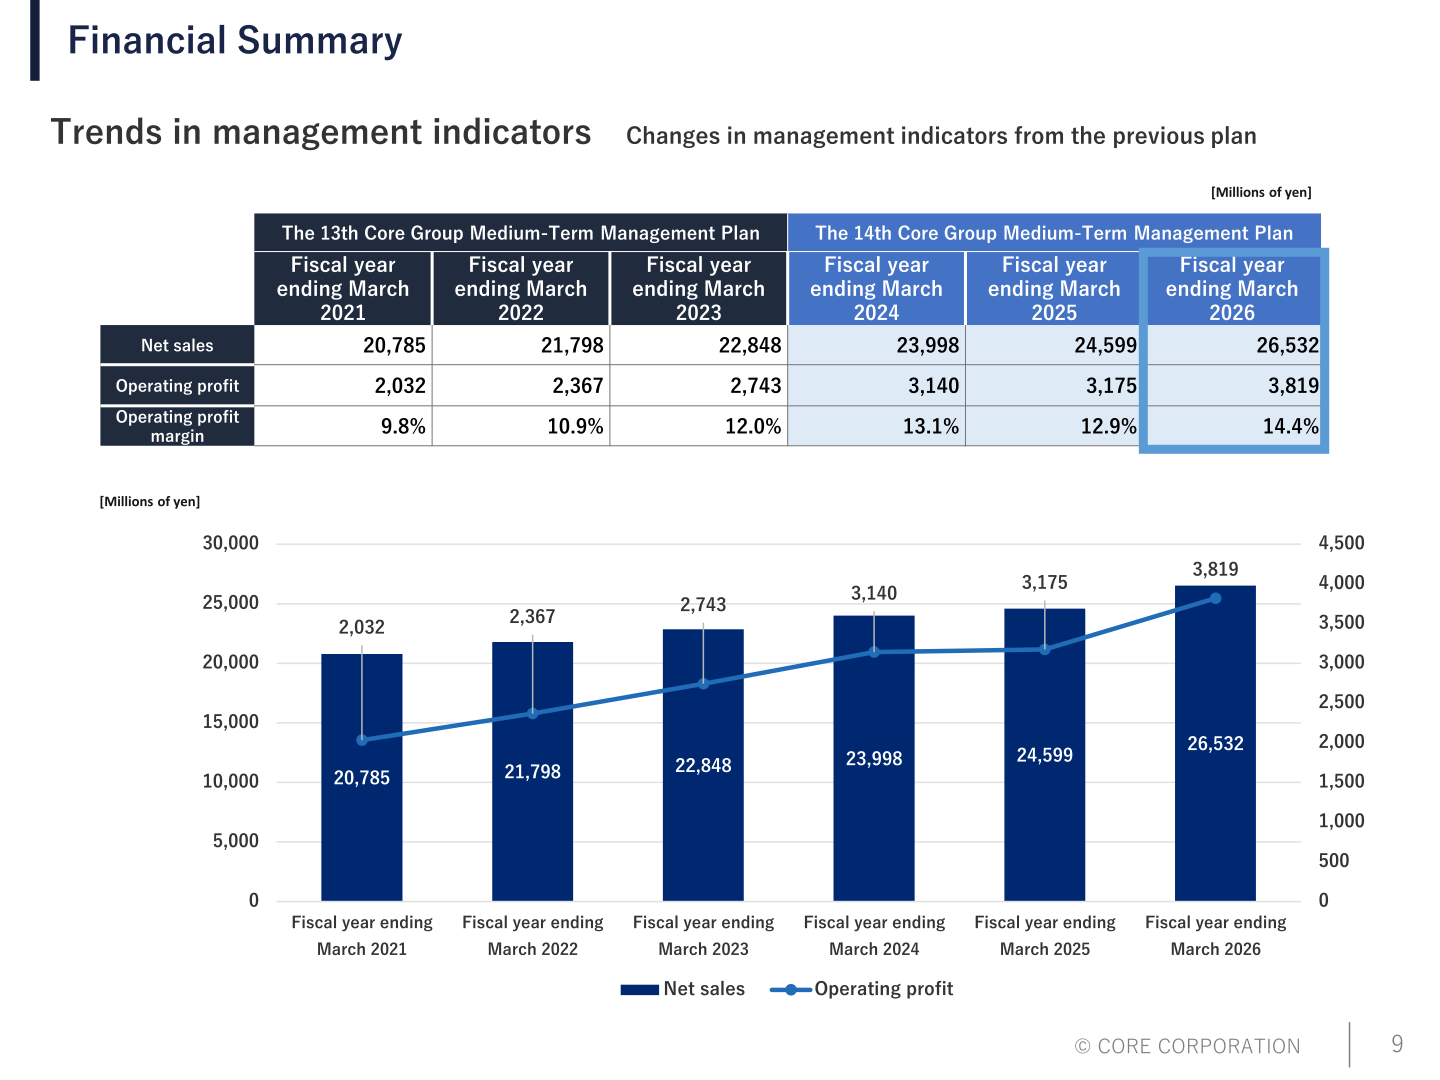
The material shows management indicators spanning the 13th Core Group Medium-Term Management Plan and the 14th Core Group Medium-Term Management Plan. Net sales rose from 20,785 millions of yen in the fiscal year ending March 2021 to 21,798, 22,848, 23,998, 24,599 and 26,532 millions of yen through the fiscal year ending March 2026. Operating profit rose from 2,032 millions of yen to 2,367, 2,743, 3,140, 3,175 and 3,819 millions of yen over the same period, with the operating profit margin improving from 9.8% to 10.9%, 12.0%, 13.1%, 12.9% and 14.4%.
This article is an analysis based on publicly available information and is not a recommendation to buy or sell any specific securities. Investment decisions are your own responsibility.
















